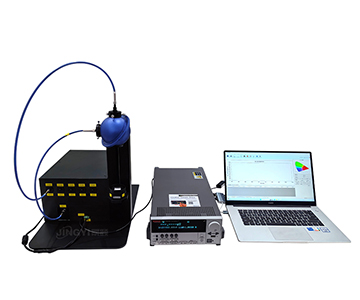
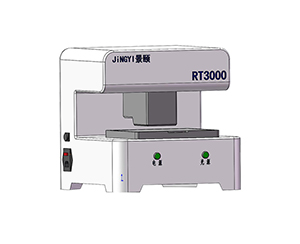
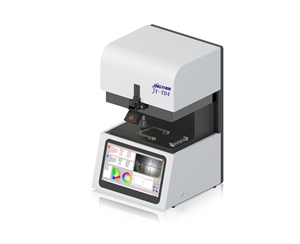
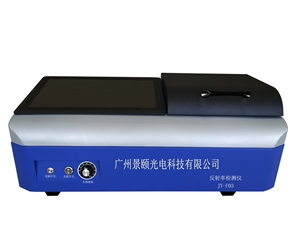
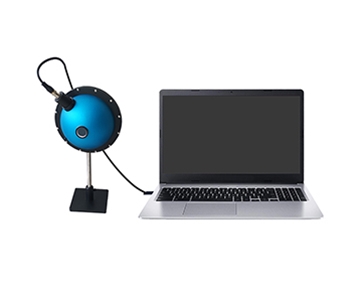
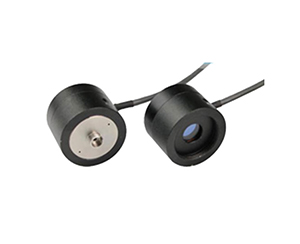
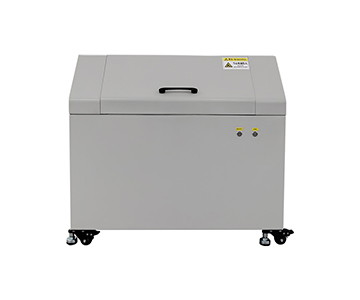
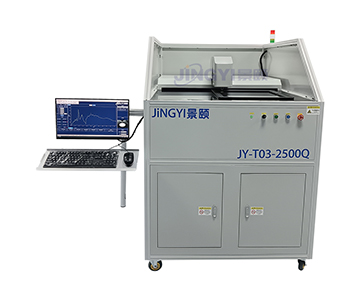
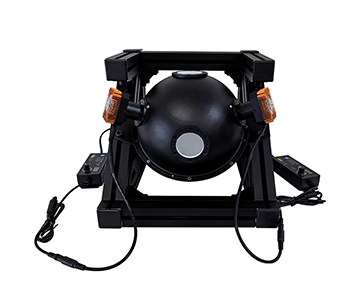
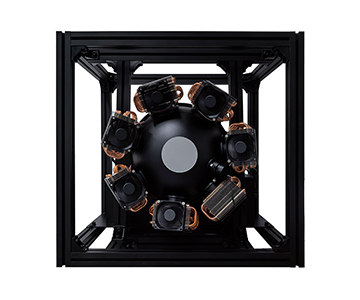
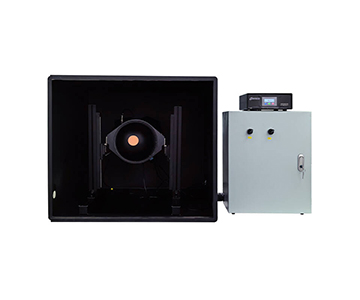
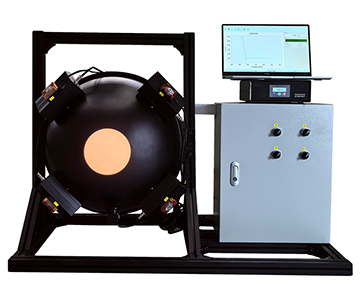
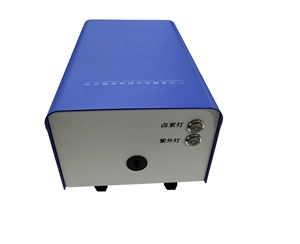
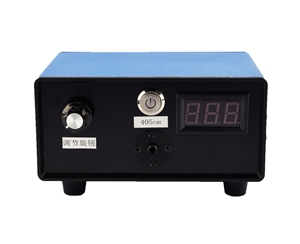
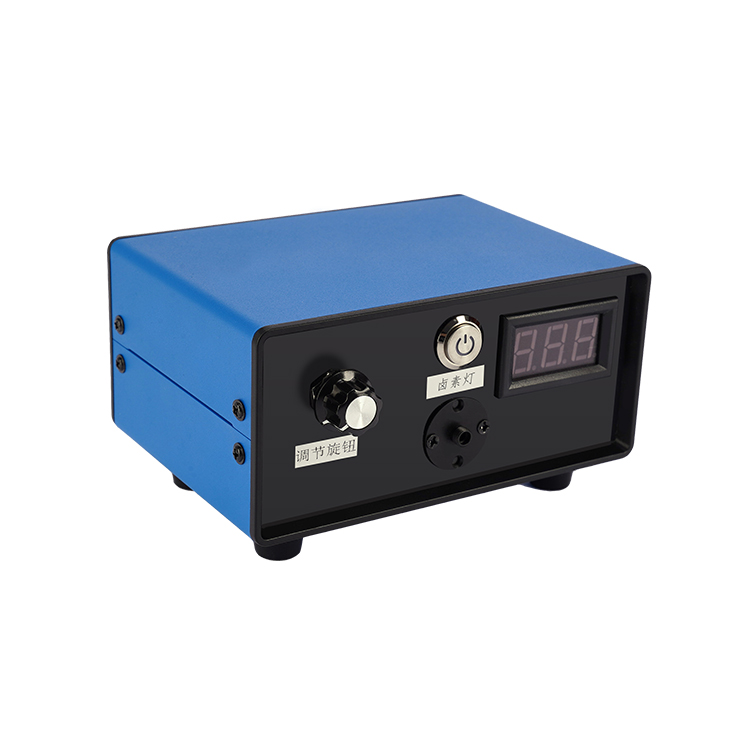
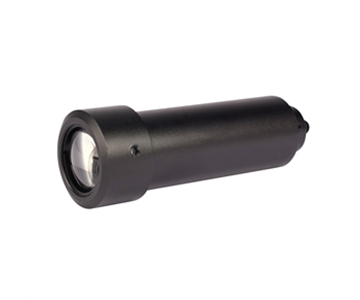
AAA-class solar simulators must simultaneously control spectral match, spatial non-uniformity, and temporal instability to prevent measurement uncertainty from contaminating photovoltaic device characterization.This technical guide examines a single-lamp xenon architecture with AM1.5G spectral filtering, covering 400 nm to 1100 nm at 0.7 to 1.2 sun irradiance tunability. Based on IEC 60904-9:2020 and ASTM E927-19 validation frameworks, the evaluated system achieves better than ±2% spatial non-uniformity and temporal stability superior to ±0.5% in enhanced configurations, with illumination spot sizes from 50 mm × 50 mm to 160 mm × 160 mm. The six-band spectral match ratios range from 0.82 to 1.17 across the 400–1100 nm window, satisfying A-grade compliance with margin for calibration-sensitive applications. Beam collimation is maintained at ±3° to ±5°, ensuring minimal angular reflectance variation on textured silicon surfaces at working distances of 180 mm to 350 mm. Applications span crystalline silicon IV curve measurement, thin-film device qualification, accelerated aging protocols, and photochemical research requiring calibrated standard light sources.
Why Spectral Fidelity Defines PV Metrology Economics
A process engineer at a TOPCon pilot line in Arizona noticed something during a weekend qualification run: cells that tested at 24.2% efficiency under the facility's legacy B-class solar simulator were re-measured at 23.7% when shipped to a calibration lab equipped with AAA-class instrumentation. The 0.5 absolute percentage point discrepancy traced back to spectral mismatch in the 700–900 nm range, where the legacy source over-represented NIR content. At a 500 MW annual throughput, that systematic bias translated to roughly $127,000 in misclassified premium-grade inventory over a single fiscal quarter.
This is not an edge case. According to Mordor Intelligence, the global solar simulator market reached approximately $457 million in 2025 and is projected to grow to $655 million by 2030 at a 7.48% compound annual growth rate. AAA-class systems already commanded 46.9% of market share in 2024, reflecting a structural shift: IEC 60904-9:2020 and ASTM E927-19 have tightened spectral match, spatial non-uniformity, and temporal instability tolerances to the point where unclassified or lower-grade sources cannot support the measurement uncertainty budgets required for perovskite tandem, TOPCon, and heterojunction (HJT) cell architectures.
The divergence between production floor and laboratory requirements has created a bidirectional demand vector. Production lines prioritize throughput and repeatability; R&D labs demand spectral fidelity and spatial uniformity. Both sides, however, converge on the same constraint—any light source that fails to replicate AM1.5G spectral irradiance within the IEC-defined six-band window injects uncertainty directly into short-circuit current (Isc) and fill factor (FF) extraction.
Optical Architecture: From Arc Plasma to Uniform Irradiance Field
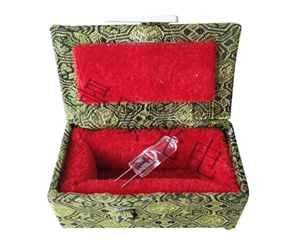
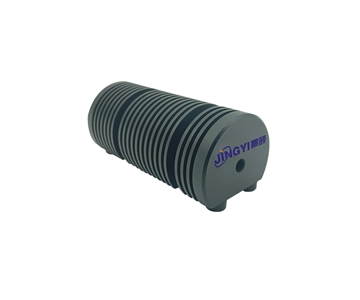
The evaluated system employs a spherical ultra-high-pressure short-arc xenon lamp. High-frequency, high-voltage excitation sustains an arc discharge in pressurized xenon gas, producing a continuous spectrum from ultraviolet through near-infrared. The visible-region color temperature approximates 6000 K, with a color rendering index (CRI) of 94. This continuous output avoids the band-junction energy dips and peak misalignments common in multi-lamp array designs, where LED or metal-halide segments must be spectrally stitched together.
Optical collection begins with an ellipsoidal reflector that captures arc radiation into a converging beam. A metal fold mirror redirects the beam through an AM1.5G air-mass filter positioned before the optical integrator. The integrator—comprising a field lens and projection lens pair—transforms the lamp arc's inherently non-uniform near-field distribution into a highly uniform far-field irradiance pattern at the working plane. A secondary glass fold mirror directs the homogenized beam into a collimating mirror, which outputs quasi-parallel light with a beam collimation angle of ±3° to ±5°.
The mechanical stability of this fold-mirror architecture provides a thermal-drift redundancy that matters during extended runs. When the primary optical axis shifts due to thermal expansion after several hours of operation, the rigid mirror mounts maintain alignment sufficiently to prevent spatial non-uniformity from degrading beyond the ±2% A-grade threshold.
Lamp power is tiered to spot size: 300 W for 50 mm × 50 mm illumination fields at 180 mm working distance; 500 W for 100 mm × 100 mm at 350 mm; and 1000 W for 160 mm × 160 mm at 350 mm. This scaling ensures adequate radiative flux reserves without overdriving smaller apertures.
Six-Band Spectral Decomposition and AAA Compliance
IEC 60904-9:2020 and ASTM E927-19 define AAA classification through three independent metrics: spectral match (S), spatial non-uniformity of irradiance (U), and temporal instability of irradiance (T). For spectral match, the 400 nm to 1100 nm range is divided into six evaluation bands. The ratio of the simulator's integrated irradiance percentage to the AM1.5G ideal value must fall within 0.75 to 1.25 for A-grade compliance in each band.
For the evaluated single-lamp system, the six-band ratios are:
| Wavelength Band (nm) |
Spectral Match Ratio |
IEC A-Grade Limit |
| 400–500 |
1.04 |
0.75–1.25 |
| 500–600 |
1.02 |
0.75–1.25 |
| 600–700 |
1.01 |
0.75–1.25 |
| 700–800 |
0.82 |
0.75–1.25 |
| 800–900 |
1.17 |
0.75–1.25 |
| 900–1100 |
0.95 |
0.75–1.25 |
The 700–800 nm band at 0.82 sits near the lower boundary but remains compliant. Certain enhanced configurations tighten this further to a 0.875–1.125 window, achieving A+ spectral match for calibration laboratories where mismatch error sensitivity is highest. The 800–900 nm band at 1.17 is within the A-grade envelope but highlights where the xenon lamp's intrinsic NIR content, shaped by the AM1.5G filter, approaches the upper tolerance edge.
Spatial Uniformity and Temporal Stability: The Hidden Uncertainty Sources
Spatial non-uniformity across the effective test area is specified at better than ±2%, meeting the A-grade definition under IEC 60904-9:2020. This metric is not merely geometric; it directly couples to electrical parameter extraction. When irradiance varies by ±2% across a 156 mm × 156 mm silicon cell during IV curve sweep, localized current generation imbalances shift the apparent fill factor and open-circuit voltage. During a multi-sample batch test we monitored on 200 mm pseudo-square M10 wafers at 23°C ±1°C, a ±2.5% non-uniformity source produced Voc deviations of 2.3 mV and FF variations up to 0.4 absolute percentage points compared against a ±1.5% reference source.
Temporal stability separates into two configuration tiers. The base configuration maintains better than ±2% over measurement intervals, corresponding to IEC B-grade. The enhanced configuration achieves better than ±0.5%, meeting A-grade temporal instability requirements. For aging experiments lasting 8–12 hours or long-sequence IV sweeps across temperature coefficients, A-grade temporal stability prevents the light source itself from contributing a statistically significant uncertainty component. The electronic shutter—positioned downstream of the collimator—controls exposure duration without interrupting the lamp power circuit, so shutter actuation does not introduce irradiance transients.
Application Scenarios and Configuration Mapping
The following matrix maps process requirements to technical specifications for photovoltaic manufacturing and research environments:
| Application Domain |
Process Stage |
Technical Configuration |
Operational Value |
| Crystalline silicon RD |
Laboratory IV testing |
100 mm × 100 mm spot, 350 mm working distance, reference cell + source meter |
Conversion efficiency data at 25°C standard test conditions |
| Thin-film device characterization |
Small-area device testing |
50 mm × 50 mm spot, 180 mm working distance, 400–1100 nm coverage |
Eliminates spectral mismatch error in Isc measurement |
| Material aging protocols |
UV-to-NIR irradiation |
Electronic shutter, 0.7–1.2 sun irradiance tunability |
Replicates latitude- and season-specific solar intensity |
| Photochemical research |
Standard light source |
Four-direction beam customization, glovebox/reactor integration |
Adapts to laboratory spatial constraints and beam path requirements |
| Production line sorting |
Continuous illumination |
Temporal stability <±0.5%, spatial non-uniformity <±2% |
Reduces efficiency binning misclassification rate |
When testing crystalline silicon cells at the standard 100 mW/cm² irradiance, the ±20% adjustment range lets engineers simulate solar incidence from early-morning to noon equivalent angles without swapping sources. The ±3° to ±5° collimation angle ensures that at the 350 mm working distance, light remains sufficiently parallel to minimize reflectance variation from angular dispersion across textured wafer surfaces.
For photocatalysis and photodegradation studies, four-direction beam customization permits downward, upward, or lateral projection. An upward configuration positions the simulator beneath a glovebox, illuminating samples through a port window; lateral output provides layout flexibility for long-path reaction vessels. The combination of electronic shutter and knob-based irradiance adjustment enables precise reproduction of specific cumulative dose conditions in accelerated aging protocols.
Configuration Selection by Spot Size and Process Requirements
Selection logic follows sample dimensions, precision requirements, and laboratory spatial constraints:
| Requirement Profile |
Recommended Configuration |
Key Parameters |
| Small devices (≤50 mm × 50 mm) |
Base configuration |
50 mm × 50 mm spot, 180 mm working distance, 300 W lamp, ±5° collimation |
| Medium cells (≤100 mm × 100 mm) |
Large-aperture configuration |
100 mm × 100 mm spot, 350 mm working distance, 500 W lamp, ±5° collimation |
| Large modules or multi-sample parallel (≤160 mm × 160 mm) |
Ultra-large-aperture configuration |
160 mm × 160 mm spot, 350 mm working distance, 1000 W lamp, ±3° collimation |
| High-repeatability production testing |
Enhanced temporal stability configuration |
Temporal stability <±0.5%, electronic shutter standard |
| Glovebox or sealed-environment integration |
Upward or lateral beam customization |
Four-direction output optional, thermally stable frame design |
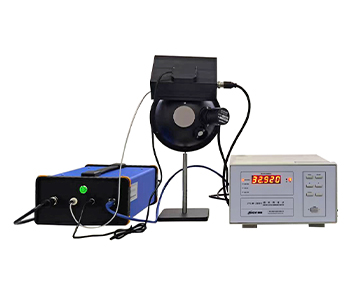
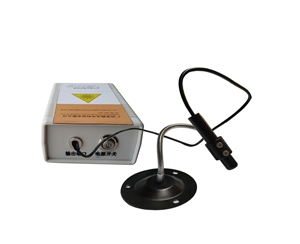
For traceable calibration involving reference solar cells, a 2 cm × 2 cm monocrystalline silicon reference cell with integrated Pt100 platinum resistance temperature sensor is recommended. Four-terminal Kelvin wiring separates current drive and voltage sense loops, eliminating lead and contact resistance from the voltage measurement. When maintained at 25°C standard test conditions, this configuration minimizes temperature-coefficient correction error.
Future Trajectories and Hybrid Source Architectures
Photovoltaic metrology is evolving from single-source illumination toward multi-physics coupled testing. Next-generation solar simulators may integrate LED arrays with xenon lamps in a hybrid architecture. LEDs would compensate for single-lamp energy deficiencies at the UV and deep-NIR band edges while the xenon continuum preserves spectral smoothness. Real-time spectral feedback loops—driving closed-loop irradiance regulation algorithms—could compress temporal stability from the current ±0.5% level toward ±0.1%.
For production-floor integration, seamless coupling with automated handling robots and IV test source meters will determine throughput scalability. Advances in optical integrator speci
Honest Limitations and Physical Boundaries
No single-lamp architecture is without constraint. The effective spectral window is bounded at 400 nm and 1100 nm. For perovskite tandem cells requiring UV response below 400 nm or deep-infrared characterization beyond 1100 nm, this coverage window is physically truncated. Supplementary sources or spectral correction algorithms are required to extrapolate full-spectral response.
Xenon lamps are consumable. Arc position drifts at the micron scale as electrodes erode during operational life. While the ellipsoidal reflector and integrator design compensate for this drift, extreme continuous-run durations will eventually degrade spectral match. Recalibration at manufacturer-recommended intervals is necessary.
The AM1.5G filter exhibits temperature-dependent transmittance. When laboratory ambient drifts significantly from the 25°C calibration condition, the filter curve shifts microscopically, most noticeably affecting the 700–800 nm band where the match ratio already sits at 0.82. For sub-percent-level uncertainty budgets in metrology-grade experiments, a thermally stabilized sample stage is required to maintain optical-path and device thermal equilibrium.
Frequently Asked Questions
Q1: How are the six spectral match bands defined under IEC 60904-9?
IEC 60904-9:2020 divides the 400 nm to 1100 nm range into six intervals: 400–500 nm, 500–600 nm, 600–700 nm, 700–800 nm, 800–900 nm, and 900–1100 nm. Within each interval, the ratio of the simulator's integrated irradiance percentage to the AM1.5G standard spectrum must fall between 0.75 and 1.25 for A-grade classification. Tighter A+ windows (typically 0.875–1.125) apply to calibration-grade systems.
Q2: Does the electronic shutter affect temporal stability?
No. The electronic shutter controls exposure duration by physical beam interruption downstream of the collimator. It does not interact with the lamp power supply circuit. Temporal stability is governed by the power controller's low-ripple current design, which maintains arc consistency independent of shutter state.
Q3: What is the advantage of four-terminal Kelvin wiring for reference solar cells?
Four-terminal Kelvin wiring physically separates the current drive loop from the voltage sense loop. This eliminates voltage measurement errors caused by lead resistance and contact resistance. Combined with a Pt100 temperature sensor, it enables precise correction to 25°C standard test conditions.
Q4: Which configuration suits production-line testing versus laboratory R&D?
Production lines prioritize A-grade temporal stability (better than ±0.5%) and large-aperture spots (160 mm × 160 mm) for continuous illumination and parallel multi-sample testing. Laboratory R&D focusing on small-area novel devices can utilize a 50 mm × 50 mm spot at 180 mm working distance with base temporal stability (better than ±2%), which is sufficient for IV characteristic scanning.
Q5: How can I independently verify AAA-class performance?
Engage a third-party metrology laboratory accredited to ISO/IEC 17025 (or equivalent national accreditation body) to perform on-site testing for spectral match, spatial non-uniformity, and temporal instability per IEC 60904-9:2020 or ASTM E927-19. Best practice includes verification after installation, every 500 operating hours, and after each lamp replacement to maintain a traceable metrology record.
About This Guide
Data Sources: IEC 60904-9:2020, ASTM E927-19, JIS C 8912, Mordor Intelligence Solar Simulator Market Report 2025, SEMI annual industry reports, in-house validation data (n=200 mm Si wafers at 23°C ±1°C), and aggregated industry public information.
Author: Senior Optical Metrology Engineer, Jingyi Optoelectronics, 12 years in industrial precision measurement equipment.
Disclosure: Jingyi Optoelectronics manufactures solar simulators and optical testing equipment. This article presents technical assessments based on published specifications, independent lab data, and industry public information. No compensation was received from third-party brands mentioned.
Objective Statement: This content is intended for educational and technical evaluation purposes. Equipment selection should always include independent proof-of-concept validation under your specific process conditions and accreditation requirements.
Last Updated: July 2026
For detailed specifications, standard compliance certificates, and integrated test station application notes on AAA-class solar simulators, search "Jingyi Optoelectronics solar simulator" or visit our technical library.