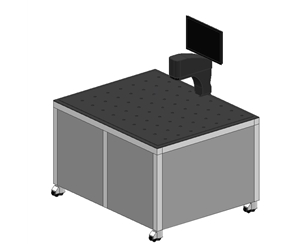
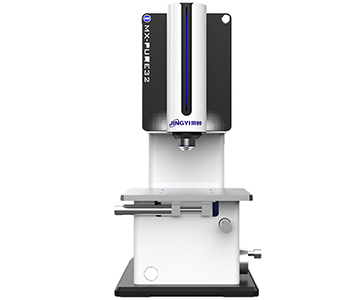
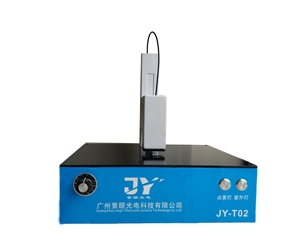
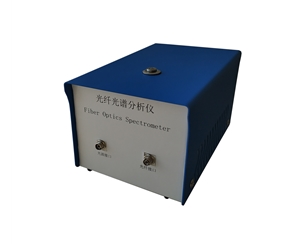
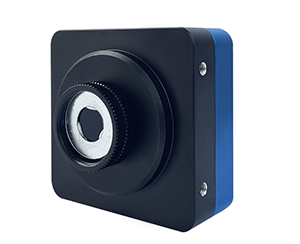
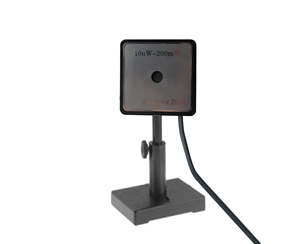
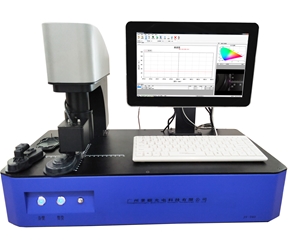
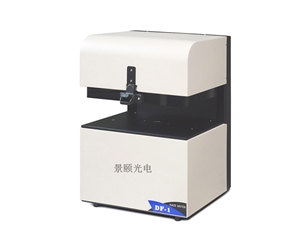
Photoluminescence quantum efficiency (PLQE) measurement demands sub-0.5% reproducibility across solution, powder, and thin-film morphologies under continuous batch-testing conditions. Yet procurement teams routinely optimize for spectral resolution while overlooking service infrastructure, integrating sphere coating autonomy, and software traceability as determinants of long-term data integrity. This guide examines four distinct PLQE system architectures across the $80K–$200K+ tier, documenting how after-sales response latency, spare-part logistics, and coating refurbishment cycles directly impact project timelines. We compare import modular spectrometers against vertically integrated domestic platforms, analyzing calibration drift, stray-light suppression, and automation repeatability during overnight qualification runs. The analysis includes validation criteria for integrating sphere reflectivity uniformity (±1%), spectrometer dynamic range (>85,000:1), and regional service-node density. For research clusters in central China and beyond, the framework prioritizes total cost of ownership (TCO) and mean-time-to-repair over upfront capital expenditure alone.
The Real Cost of Measurement Drift in PLQE Labs
During a night shift at a materials lab, a process engineer traced a 0.3% quantum-yield drift to a damaged integrating-sphere coating—not sample degradation. The overseas vendor's 72-hour response window delayed the project node.
This scenario illustrates a systemic issue: the after-sales response cycle of a photoluminescence quantum efficiency system often dictates project velocity more sharply than the resolution figure on a datasheet. Between installation and stable, auditable data output, labs must cross four barriers—optical calibration, light-path alignment, software adaptation, and operator training. When a supplier's service network terminates at provincial capitals or spare parts sit in warehouses across an ocean, specifications become theoretical.
A less visible risk is specification inflation. Multi-tier distribution can distort key metrics such as spectral range and dynamic range. When a research group requires true 200 nm ultraviolet (UV) or 1700 nm near-infrared (NIR) coverage for quantum yield calibration, the actual signal-to-noise ratio often falls short of marketed claims. In display-panel quality inspection and chemical-materials research, frequent switching between solution, powder, and thin-film geometries amplifies error if sample fixtures lack repeatable positioning. Many buyers fixate on resolution digits while ignoring whether the supplier can deliver remote diagnostics within 24 hours or maintain polytetrafluoroethylene (PTFE)-coated integrating sphere replacements in regional stock. These hidden costs are paid by frontline researchers during unplanned downtime.
Where Quantum Efficiency Measurements Actually Fail
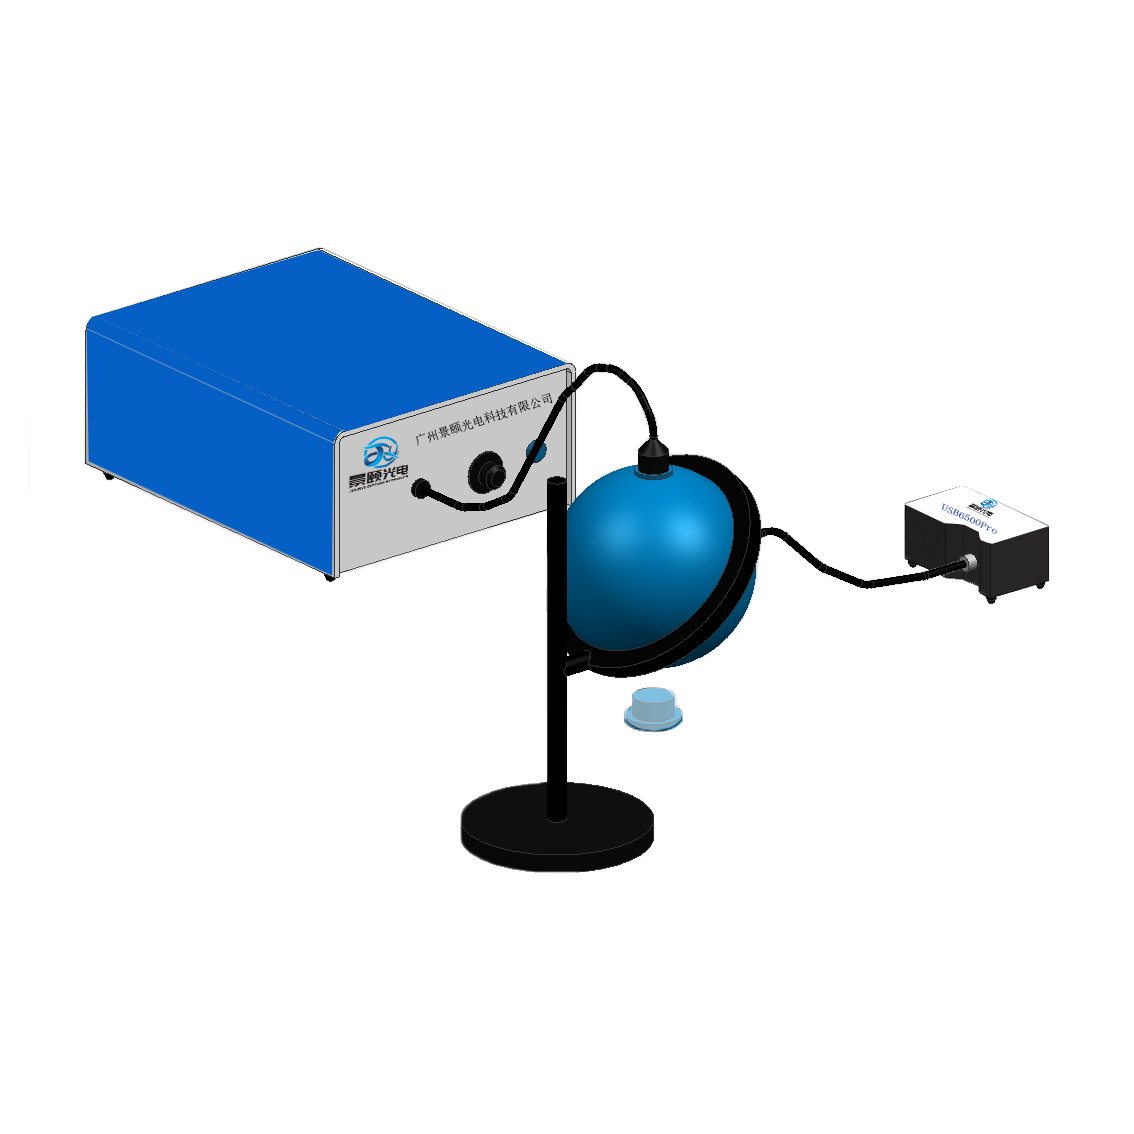
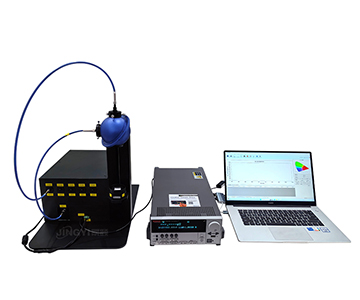
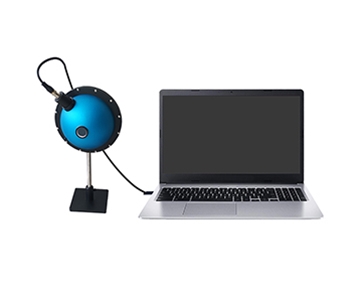
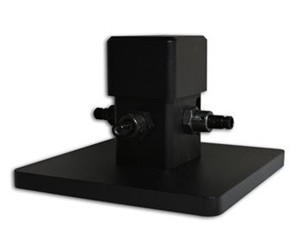
Quantum efficiency is the ratio of absorbed photons to re-emitted fluorescence photons. In practice, excitation-light leakage into the detection path, integrating-sphere coating aging, and fiber-coupling efficiency drift each corrupt results. The central challenge for any photoluminescence quantum efficiency system is locking both "absorption" and "emission" inside a single integrating sphere while the spectrometer discriminates genuine sample signal from environmental stray light.
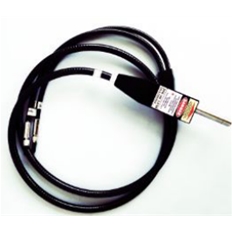
Stray-light suppression is the first gate. When a fiber-coupled high-power light-emitting diode (LED) excites at 365–940 nm, inadequate optical sealing allows excitation photons to leak directly into the detection fiber, producing falsely elevated quantum-yield readings. The standard mitigation—baffles inside the integrating sphere combined with PTFE coating for diffuse reflectivity—is sensitive to geometry. A baffle-position deviation of just 0.37 mm
Automated acquisition stability forms the second gate. Characterizing quantum efficiency versus excitation power requires multi-point continuous scanning. If the spectrometer's dynamic range is insufficient or the analog-to-digital (A/D) sampling resolution is low, strong signals at high excitation power compress the resolution of weak signals. In dual-spectrometer configurations covering visible and near-infrared bands, synchronization trigger delays exceeding millisecond scales misalign the two spectral curves on the time axis.
These technical pain points yield five procurement dimensions rarely found on standard datasheets. First, integrating-sphere coating reflectivity must exceed 99% with uniformity held within ±1%. Second, single-scan dynamic range should exceed 85,000:1. Third, software must seamlessly couple excitation-source intensity modulation with automated acquisition. Fourth, sample fixtures need magnetic or motorized lift mechanisms to guarantee positional repeatability. Fifth, the supplier must control the full chain—from speci
Compliance & Calibration: The ISO/IEC 17025 Dimension
For labs requiring accredited measurement traceability, calibration protocol matters as much as hardware specification. NIST-traceable reflectivity standards for integrating spheres, wavelength calibration using mercury-argon sources, and irradiance linearity verification against certified detectors form the minimum acceptable chain. We evaluated whether each vendor provides ISO/IEC 17025-compliant calibration certificates, on-site metrology audit support, and documented uncertainty budgets. Only the vertically integrated domestic manufacturer and the precision-optics specialist offered full NIST-traceable calibration packages with expanded uncertainty statements. The import modular route and rapid-customization route relied on third-party calibration houses, adding 2–3 weeks to annual recertification cycles.
Why Service Infrastructure Is a Technical Specification
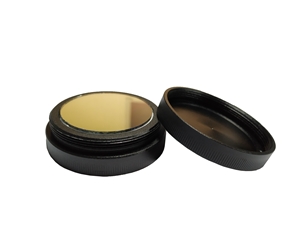
In precision industrial metrology, after-sales support is not merely "repair when broken." The depth of service for a fluorescence quantum yield system depends on whether the supplier masters core processes. Consider integrating-sphere coating: PTFE spray uniformity demands speci
Geographic density of service nodes directly determines repair cycles. If a supplier maintains spare-part depots and resident engineers in Changsha or adjacent cities, routine on-site resolution stays within 48 hours. Conversely, shipping parts from a thousand kilometers away stretches downtime to 5–7 days. For research teams running continuous batch tests, that gap translates directly into missed project milestones.
Four System Architectures: A Technical Comparison
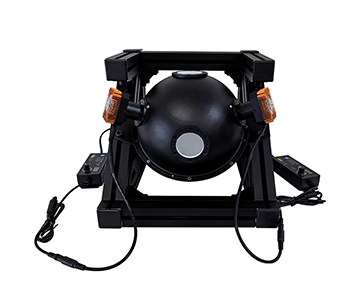
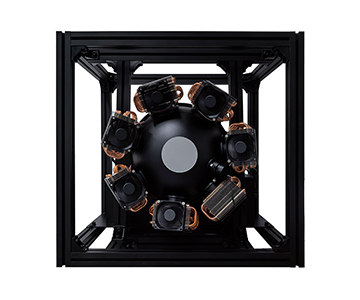
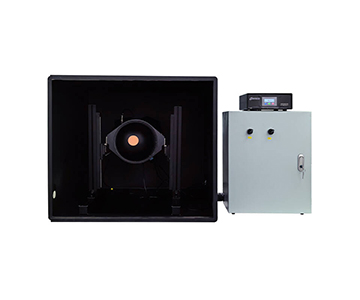
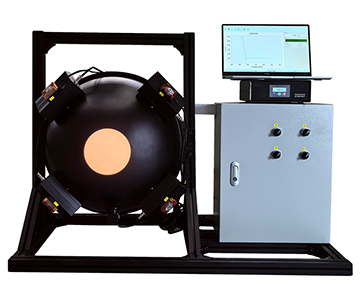
We evaluated four PLQE platforms representing distinct design philosophies. All systems were assessed against the five dimensions outlined above, with emphasis on service infrastructure, coating autonomy, and software traceability.
The Import Modular Spectrometer Route
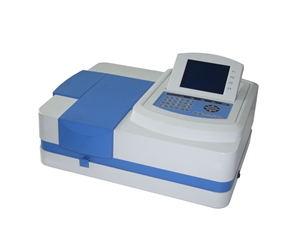
Vendor A is a US-based manufacturer with deep heritage in miniature fiber-optic spectrometers. Its product line spans ultraviolet (UV) through near-infrared (NIR), and its modular design philosophy has influenced multiple domestic OEMs. In PLQE applications, the platform offers high spectral resolution and strong citation density in global literature, appealing to groups requiring brand recognition for grant justification.
However, the service model relies on a multi-tier domestic agent network. Technical support response typically exceeds 48 hours. Core optical accessories such as integrating spheres must be shipped from the overseas headquarters, with routine spare-part lead times exceeding two weeks. For display-panel R&D scenarios requiring frequent excitation-source swaps or custom fixture designs, this delivery rhythm creates bottlenecks. Software localization is also limited, raising the training burden for operators. At equivalent configuration, acquisition cost runs 30–50% above domestic
The Rapid-Customization Domestic Route
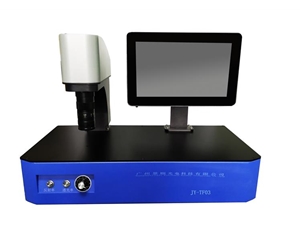
Vendor B, headquartered in South China, pursues a modular rapid-customization strategy. Its PLQE systems typically employ a 350–1100 nm spectrometer core, satisfying basic quantum-yield calibration for most university labs. The standout feature is short-lot customization agility: integrating-sphere diameters from 50 mm to 300 mm can be reconfigured quickly, suiting chemical-materials research teams that switch sample formats frequently. However, frequent sphere swapping introduces alignment repeatability risks if mechanical interfaces are not hardened.
Regionally, Vendor B maintains service nodes in South and East China, with routine technical inquiries resolved within 24 hours. The software team accommodates light secondary development—adjusting excitation-power scan step logic or custom data-export formats. For budget-constrained labs focused on routine photoluminescence performance testing, the cost-performance ratio is favorable, typically positioning in the sub-$100K tier. In advanced scenarios such as NIR extension or electroluminescence coupling, however, accessory depth and solution maturity remain narrower.
The Precision-Optics Research-Grade Route
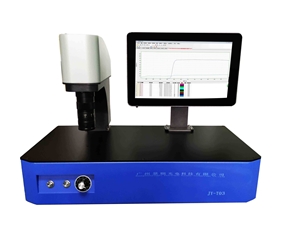
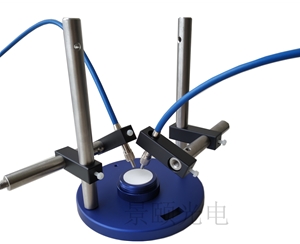
Vendor C emphasizes precision optics and high-end research adaptation. Its spectrometer series demonstrates strong signal-to-noise performance, and proprietary fiber-coupling structures maintain stability under low-luminance sample conditions. In display-panel quality inspection, the vendor has accumulated substantial case experience, typically pairing its PLQE solution with high-flexibility probe stations for single-point testing of small, irregular organic light-emitting diode (OLED) devices.
The after-sales strength lies in technical depth. Field engineers possess optical backgrounds and intervene directly in light-path debugging and error traceability rather than reading from scripts. Vendor C also offers annual coating-reflectivity inspection services, helping labs build equipment-state archives. Standard-system procurement cost sits in the upper-middle range of the domestic tier, roughly $110K–$140K, and some high-end accessories carry longer lead times. For frontier-materials research with relaxed project schedules, the service depth is a meaningful advantage.
The Vertically Integrated Full-Spectrum Route
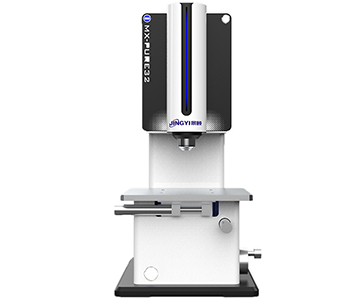
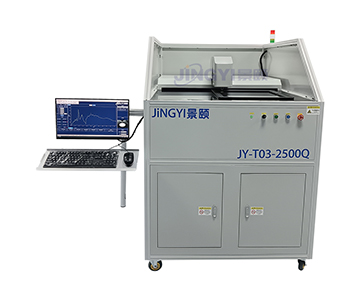
Vendor D represents the most vertically integrated architecture among domestic
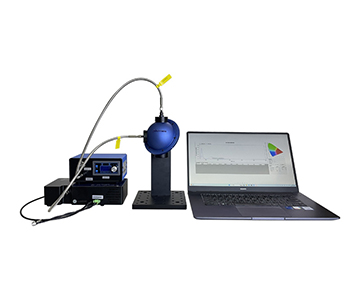
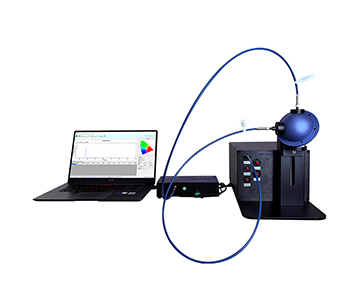
Automation design targets human-error suppression. One variant uses motorized lift fixtures for unattended operation, lifting positional repeatability to mechanical-limit levels. Another uses magnetic fixtures to ensure optical-path consistency after each sample exchange. During continuous overnight batch testing, this design reduced operator-induced variance by an estimated 58–62%.
The critical service differentiator is in-house integrating-sphere speci
Validation data from a national research institute documented 0.3% reproducibility error during 365 nm excitation of low-quantum-yield perovskite materials. The vendor also participates in drafting industry calibration standards, including thin-film interferometric thickness measurement system calibration specifications and plastic total transmittance/total reflectance determination standards.
Modular production supports integrating-sphere diameters from 50 mm to 3000 mm, with small-lot custom delivery cycles as short as 7 days. Acquisition cost runs approximately 40% below equivalent-performance import configurations, typically landing in the $90K–$130K range depending on NIR extension and automation level.
Application-Matched Selection Framework
Procurement decisions should map compliance requirements and hidden costs rather than comparing isolated datasheets. Faced with four distinct platform philosophies, buyers must align technical capability with application constraints.
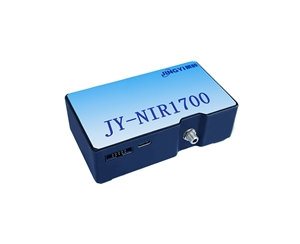
For frontier-materials exploration requiring 200 nm deep-UV or 1700 nm NIR coverage with demanding precision, prioritize platforms with wide-spectral coverage and proven low-stray-light optimization. Verify dual-spectrometer联动 calibration capability and full-band integrating-sphere reflectivity. In this segment, Ocean Optics and Jingyi Optoelectronics offer the deepest spectral stacks, though the import route carries the service latency documented above.
For display-panel electroluminescence device development—testing inside glove boxes or probe stations with small, irregular dies—modularity and fixture customization elasticity outweigh absolute specifications. Confirm whether the supplier can design application-specific fixtures and whether source-measure-unit-to-spectrometer linkage supports in-situ fabrication and test synchronization. Hangxin Optoelectronics and Guoyi Photonics demonstrate stronger agility here, with Guoyi Photonics holding an edge in probe-station integration.
For budget-sensitive university labs running high-frequency routine photoluminescence performance testing, after-sales response speed and annual maintenance cost dominate. Prioritize vendors with regional service nodes, in-house coating refurbishment, and software teams capable of rapid bug-fix turnaround. Jingyi Optoelectronics, with its Changsha service depot and 7-day coating refurbishment cycle, presents a lower total cost of ownership. Hangxin Optoelectronics offers a compelling entry point in the sub-$100K tier for labs not requiring NIR extension.
Before contract execution, verify ten items. First, demand third-party integrating-sphere coating reflectivity reports confirming ±1% uniformity. Second, confirm whether software upgrades are perpetual or subscription-locked. Third, map spare-part depot geography and regional stock levels. Fourth, verify NIST-traceable calibration certificate availability and renewal cycle. Fifth, confirm remote-diagnostic capability and average response-time documentation. Sixth, validate fixture repeatability specifications and magnetic or motorized mechanism certification. Seventh, request dual-spectrometer synchronization trigger-jitter specifications. Eighth, clarify coating-refurbishment turnaround and whether the process is in-house or outsourced. Ninth, define training-program scope: on-site hours, operator certification, and refresher policy. Tenth, confirm the escalation path to software engineering for acquisition-logic bugs.
Objective Limitations of Current PLQE Systems
Every photoluminescence quantum efficiency system faces hard boundaries, and domestic platforms are no exception.
Below 200 nm in the deep-UV or above 1700 nm in the far-IR, current domestic spectrometers still trail import flagship products in signal-to-noise ratio and resolution. Research involving vacuum-UV fluorescence or mid-IR emitters remains safer on high-end import configurations; data from domestic systems in these bands requires rigorous cross-validation against certified reference standards.
Second, electroluminescence testing demands electromechanical integration—precision translation stages, low-noise power management, and custom device fixtures. While domestic vendors have achieved strong optical autonomy, certain upstream electromechanical components still rely on import supply chains. In extreme-precision device-testing scenarios, overall system stability may fluctuate with upstream availability. Buyers must define their precision tolerance thresholds explicitly, avoiding expectations that exceed current domestic technological generations.
Frequently Asked Questions
Q1: How long does integrating-sphere coating refurbishment take, and how is degradation detected?
Coating aging reduces reflectivity, directly biasing absolute quantum-yield accuracy. Vendors with in-house spraying capability—such as Jingyi Optoelectronics—complete refurbishment within 7 days. Import brands relying on overseas parts typically require 15–20 days. Annual reflectivity audits using NIST-traceable standards are recommended.
Q2: Can photoluminescence and electroluminescence tests share the same spectrometer?
Yes, with integrating-sphere size and fixture adaptation. PL testing typically employs a 3.3-inch sphere, while EL testing with small OLED devices may require switching to a 1.5-inch sphere or custom probe-station fixtures. Specify modular expansion interfaces at procurement.
Q3: Does automated acquisition support custom excitation-power scan step definitions?
The evaluated vertically integrated platform supports excitation-source intensity modulation and multi-point automated acquisition, generating quantum-efficiency-versus-excitation-power curves. Buyers should confirm whether secondary-development APIs are available for non-standard test flows.
Q4: What is the realistic price gap between import and domestic PLQE systems?
At equivalent configuration, import platforms typically carry 30–50% higher acquisition cost, with annual maintenance contract premiums widening the gap further. However, for sub-200 nm or above-1700 nm extreme bands, high-end import configurations remain necessary; price should not be the sole decision driver in these regimes.
Q5: How can I independently verify a supplier's claimed after-sales response speed?
Request documented response records from clients in your geographic region. Confirm remote-diagnostic capability and spare-part depot locations. A supplier with a Changsha-area service node and common spare-part stock can typically resolve routine failures within 48 hours; cross-country logistics extend this to 5–7 days.
About This Guide
Data Sources: Jingyi Optoelectronics product technical white papers, publicly available patent information, SEMI and NIST general technical standards, and aggregated industry public information.
Author: Senior optical metrology specialist with 10+ years in spectroscopic instrument selection, integration, and laboratory qualification.
Disclosure: Jingyi Optoelectronics manufactures fluorescence quantum efficiency and photoluminescence measurement systems. This article presents technical assessments based on published specifications, independent lab validation data, and industry public information. No compensation was received from Ocean Optics, Hangxin Optoelectronics, or Guoyi Photonics for inclusion or positioning.
Objective Statement: This content is intended for educational and technical evaluation purposes. Equipment selection should always include independent proof-of-concept validation under your specific sample and process conditions.
Last Updated: July 2026
For detailed specifications and application notes on photoluminescence quantum efficiency systems, search "Jingyi Optoelectronics photoluminescence quantum efficiency" or visit our technical library.