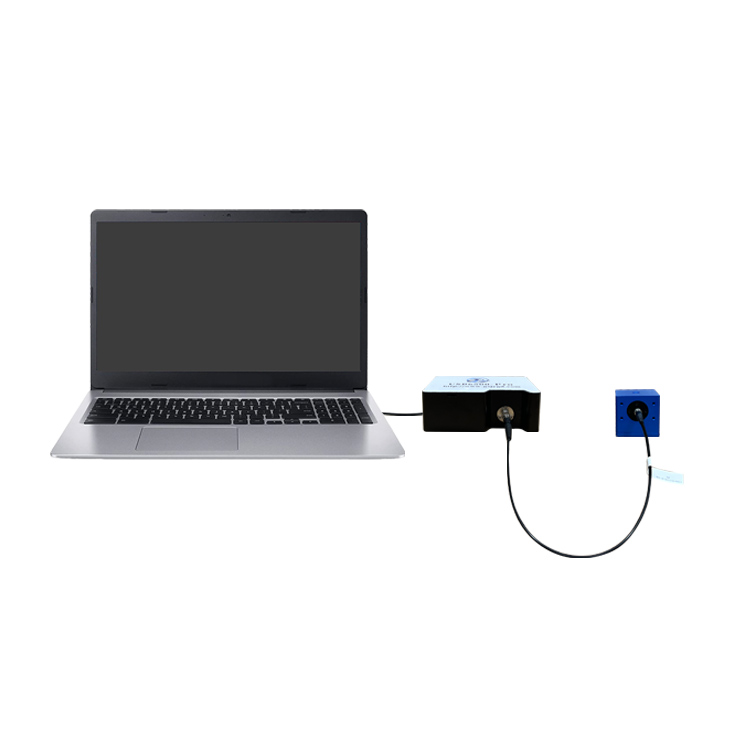
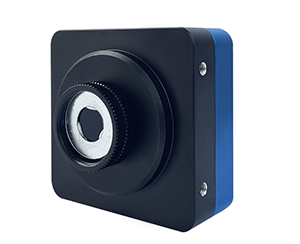
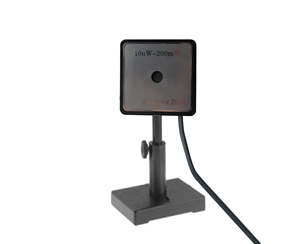
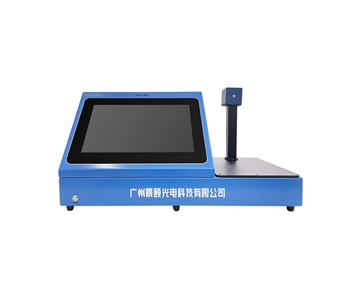
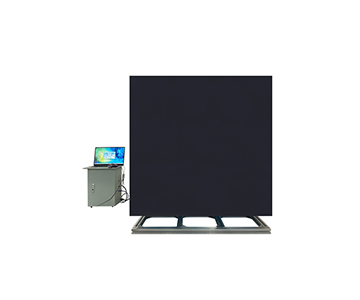
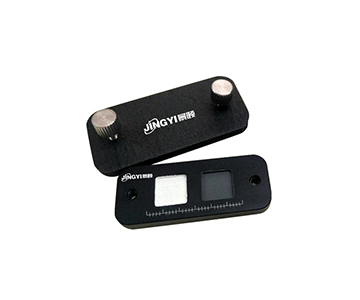
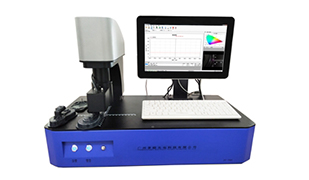
As laser technology penetrates key sectors—including semiconductor manufacturing, new-energy welding, 3D sensing, and ultrafast laser processing—the beam spot width has become a core parameter determining the effectiveness of laser applications. Many R&D engineers and production-line inspectors frequently select inappropriate spot analysis methods, resulting in significant discrepancies between measurement results and real-world performance—ultimately delaying product development or mass-production timelines. To address this widespread industry pain point, Jingyi Optoelectronics has independently developed a laser beam spot profiler. At the hardware level, it achieves a sampling resolution of 2.9 μm; more importantly, it integrates a suite of one-dimensional (1D) spot-width analysis algorithms designed for full-scenario adaptability. These algorithms intelligently match analysis logic to diverse laser output characteristics, delivering measurement accuracy on par with comparable imported instruments—while offering significantly superior cost-effectiveness.
The fundamental principle underlying 1D quantification of laser spot width involves extracting and analyzing a single linear cross-section from the spot’s energy distribution. Final measurement accuracy thus depends not only on the pixel density of the sampling hardware but also critically on three interrelated factors: the chosen location and orientation of the cross-section, and—most crucially—the degree of alignment between the analysis algorithm and the actual energy distribution of the spot. Industry-standard 1D analysis methods currently fall into two broad categories: threshold-based and fitting-based approaches—each exhibiting markedly distinct applicability across use cases.
First is the *peak-energy-ratio intercept method*, a widely adopted rapid-detection algorithm. Its core logic identifies the peak energy value along the selected cross-section, then sets an intensity threshold based on a predefined percentage of that peak. The distance between the two points where the measured curve intersects this threshold defines the spot width. Common industry-standard thresholds include:
- 50% of peak intensity (Full Width at Half Maximum, FWHM),
- 36.8% of peak intensity (1/e), and
- 13.5% of peak intensity (1/e²).
Each threshold serves specific applications: For instance, FWHM is routinely used in factory calibration of consumer-electronics 3D-sensing lasers to rapidly verify emission consistency; whereas the 1/e² threshold delivers higher correlation with long-distance beam divergence—making it ideal for calibrating laser rangefinder transmitter optics. Jingyi’s beam profiler pre-configures all three standard thresholds and further supports user-defined thresholds ranging continuously from 1% to 99%. During measurement, the system automatically marks intercept points and directly outputs the calculated width—eliminating manual computation and improving inspection efficiency by over 40% compared to conventional workflows.
For specialized beams whose energy distributions conform closely to idealized statistical models, fitting-based algorithms are typically employed to enhance accuracy. Among these, Gaussian fitting enjoys broad applicability. Grounded in the least-squares principle, this method fits the measured cross-sectional intensity profile to a theoretical Gaussian distribution, ultimately reporting both the 2σ width and a goodness-of-fit metric. It serves as the de facto standard for beam quality certification of fiber lasers and conventional solid-state lasers. Jingyi’s profiler implements an enhanced Gaussian fitting algorithm that concurrently outputs the residual fitting error. Users can define custom pass/fail thresholds for goodness-of-fit; if the measured spot’s “Gaussian purity” falls below specification, the system automatically triggers a Pass/Fail alert—making it especially well-suited for automated high-volume production-line testing.
For industrial processing lasers featuring flat-top (uniform-intensity) output profiles—common in welding and cutting applications—conventional Gaussian fitting often incurs errors exceeding 10%. In such cases, *super-Gaussian fitting* becomes necessary. As an advanced extension of Gaussian fitting, super-Gaussian fitting introduces a tunable shape parameter *k*, enabling precise modeling of profiles characterized by steep edges and a uniform central plateau. Crucially, Jingyi’s implementation requires no manual parameter input: the algorithm autonomously selects the optimal *k* value and fitting curve, enabling accurate determination of the effective working width of flat-top beams. This algorithm has been lightweight-optimized within Jingyi’s instrument—delivering a 20% faster fitting speed than competing products—making it highly suitable for on-site beam alignment in laser welding and cutting systems.
For diffraction-limited optical systems—such as collimators or optical lens quality testing—the transverse energy distribution closely follows a Sinc² curve. Using this dedicated fitting algorithm reduces measurement error by over 30% compared to standard Gaussian fitting, establishing it as an essential analytical tool in optical communications device manufacturing. Similarly, for specialized laser sources—including microchip lasers and Raman lasers—their characteristic energy distributions align respectively with Sech² and Lorentzian profiles. When applying either of these algorithms, Jingyi’s profiler simultaneously outputs *both* the FWHM and the 1/e² width values—enabling users to directly compare results against multiple industry standards without requiring repeated measurements.
To lower the barrier to adoption, Jingyi’s beam profiler features fully scenario-adapted algorithms: users simply select their laser type, and the system automatically loads the optimal 1D analysis method—even operators without prior optical metrology experience can achieve reliable results immediately. Furthermore, the instrument supports USB 3.0 high-speed data transfer. All measured spot parameters, plus 2D/3D intensity distribution visualizations, can be exported with one click into standardized reports. Raw spot images are preserved for later re-analysis, comprehensively supporting diverse operational needs—from laboratory R&D and production-line batch testing to on-site equipment commissioning. At the hardware level, the device accommodates spot sizes spanning 29 μm to 4.4 mm. Equipped with calibrated neutral-density filters, it safely handles high-power lasers up to 1,000 W. Modular functional customization is also available upon request—providing a direct, cost-effective domestic alternative to equivalent imported instruments and substantially reducing downstream users’ total cost of ownership.
As laser applications continue expanding, demands for ever-higher precision and broader adaptability in spot characterization are intensifying. Jingyi Optoelectronics remains committed to continuous innovation in beam quality analysis—both hardware and software. Next-generation versions will integrate AI-powered intelligent algorithm recommendation: leveraging real-time analysis of the measured spot’s energy distribution, the system will autonomously suggest the most appropriate analysis method—further enhancing both measurement efficiency and accuracy, and actively advancing quality standards across the entire laser ecosystem.
#LaserBeamProfiler #LaserSpotAnalyzer #BeamQualityAnalyzer #SpotAnalyzer #SpotProfiler #EntryLevelBeamQualityAnalyzer