Sample Handling Is the Primary Gate for Bias Prevention
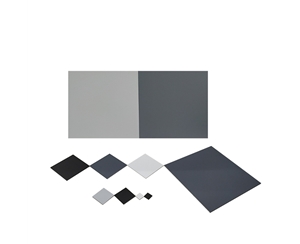
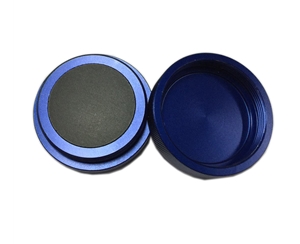
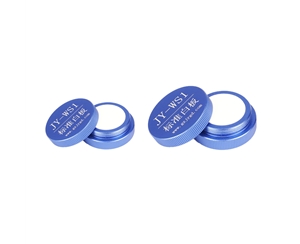
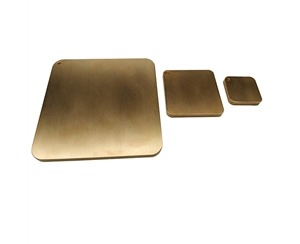
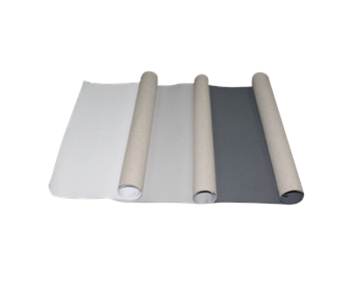
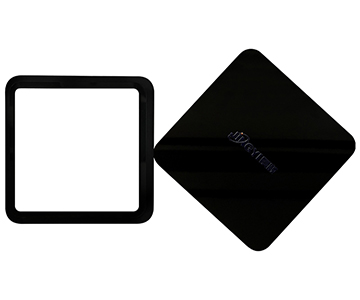
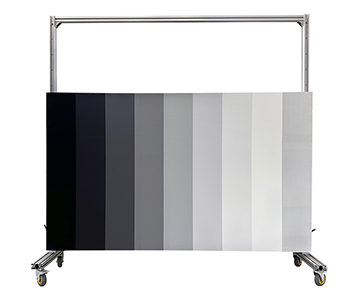
First, ensure the surface of the sample to be tested is sufficiently flat and makes full, gap-free contact with the electrode holder. If air leakage occurs, abnormal sounds will arise during spark excitation, directly distorting the recorded spectral line intensities. Second, the grinding striations on both the sample and the reference standard must match in fineness—cross-hatched patterns must be avoided. During grinding, apply uniform pressure; excessive force may cause surface oxidation, thereby altering the material’s optical properties. For special materials such as high-nickel-chromium steel, it is recommended to use a brand-new abrasive wheel to minimize optical property deviations introduced during grinding. Additionally, proactively screen samples for inherent defects—including segregation, cracks, and porosity—prior to analysis. Such flaws induce anomalous light scattering, rendering the acquired signals wholly unrepresentative of the sample’s true composition; defective specimens must therefore be rejected before testing to avoid futile efforts.
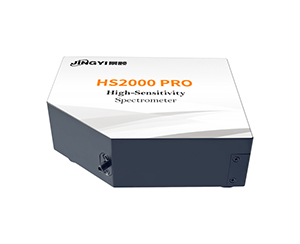
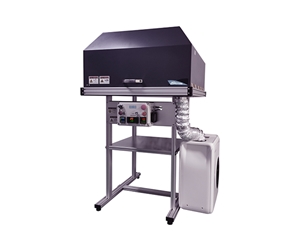
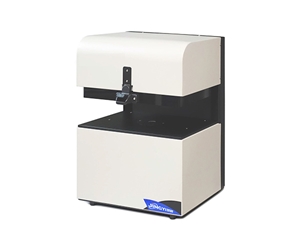
Hardware Status of the Spectrometer Directly Affects Data Accuracy
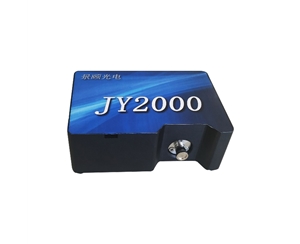
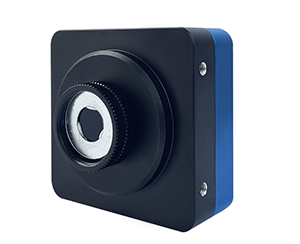
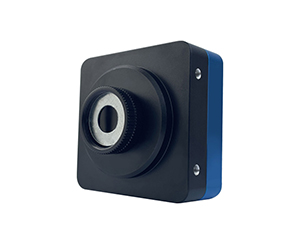
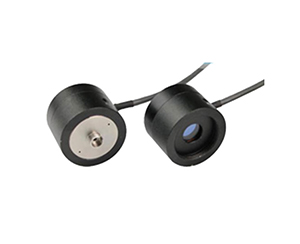
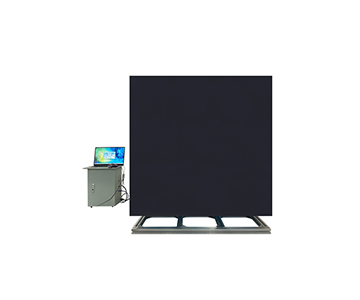
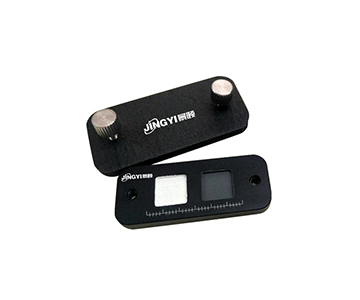
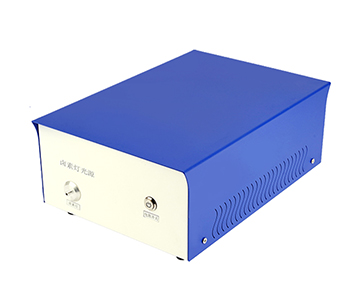
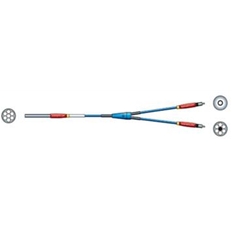
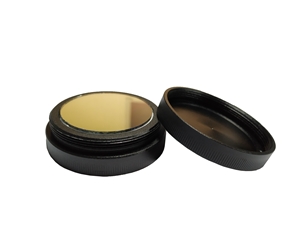
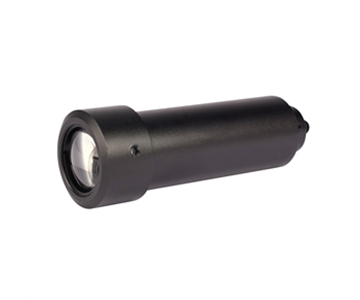
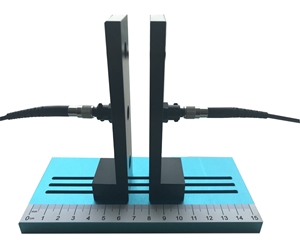
Accurate acquisition and transmission of optical signals constitute the core of spectral analysis; thus, the operational condition of key hardware components directly determines data accuracy. First, the tip angle of the electrode must comply with standard specifications, the optical axis must remain precisely centered, and the spark gap must remain constant. Otherwise, dispersed spectral lines cannot be accurately focused onto the detector’s active region—even high-sensitivity linear CCDs such as the JY2000 will fail to record accurate intensity signals. After each spark event, metal vapor deposits on the electrode surface; repeated use also causes electrode tip elongation, altering the spark gap. Consequently, electrodes must be cleaned with a dedicated brush after every use, and the tip angle must be inspected regularly to ensure compliance with specifications. Second, the condenser lens requires periodic cleaning—especially for users performing ultraviolet (UV) spectral measurements. The inner lens surface is prone to contamination by vacuum pump oil vapor, while the outer surface accumulates metallic dust generated during analysis, both reducing transmittance. Users of Jingyi Optoelectronics’ JY2000 spectrometer—equipped with the optional 200–850 nm UV–visible wavelength range—must pay particular attention to cleaning frequency. Accumulated oil vapor and metallic dust can significantly reduce transmittance below 200 nm, compromising detection sensitivity for short-wavelength elements such as carbon, sulfur, and phosphorus.
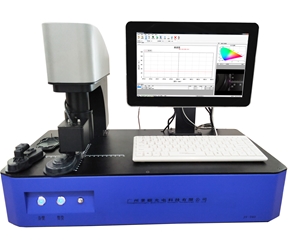
Impact of Environmental Parameter Fluctuations on Critical Optical Components
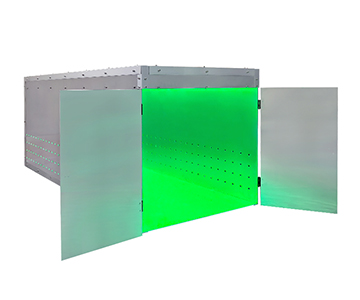
Core optical components of spectral quality analyzers are highly sensitive to environmental parameter variations. First, for UV spectral analysis conducted under vacuum conditions, insufficient vacuum level drastically reduces detection sensitivity for short-wavelength elements. To ensure accurate results, vacuum pressure must remain stably maintained at ≤ 0.05 mmHg. Second, temperature fluctuations inside the monochromator chamber cause thermal expansion or contraction, shifting the exit slit position. Therefore, the monochromator chamber temperature should be stabilized near 30 °C, and ambient room temperature throughout the testing environment should also remain relatively constant—to prevent slit misalignment, spectral line positional shifts, and consequent analytical errors.
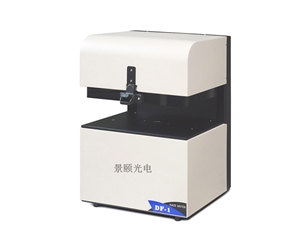
Calibration Technology Evolution and Analytical Process Optimization
Beyond manual procedural controls, intelligent calibration technologies for spectral analysis are rapidly evolving. Jingyi Optoelectronics is actively developing dedicated intelligent calibration algorithm modules targeting common bias sources in portable spectral analysis—such as sample surface flatness deviations and minute thermal drifts. In the near future, these algorithms will enable automatic correction, further lowering operational barriers and enhancing measurement stability. For current general users, diligent implementation of the above three categories of meticulous controls will substantially maximize spectrometer performance and deliver stable, reliable analytical results.
#Spectrometer #SpectralQualityAnalyzer #FiberOpticSpectrometer #NearInfraredSpectrometer #PortableHyperspectralImager