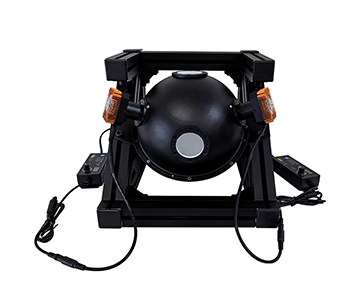
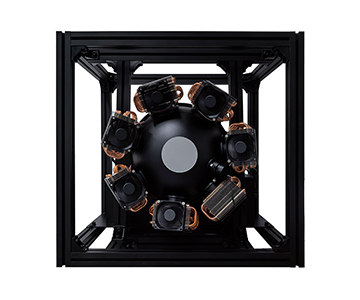
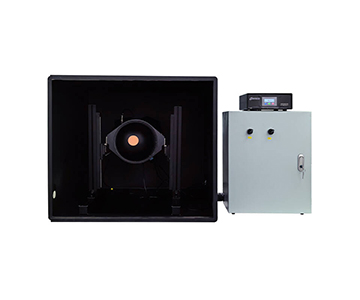
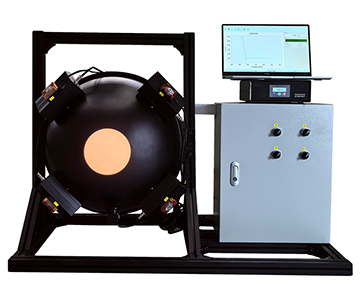
Solar simulators are the backbone of photovoltaic cell efficiency certification, yet many procurement decisions still rely on surface-level specs like lamp wattage or spot size rather than the three IEC 60904-9 performance classes that actually govern measurement validity. This guide evaluates four mainstream systems across spectral match, spatial non-uniformity, and temporal stability metrics, drawing on deployment data from production lines and research labs to identify which configurations deliver repeatable IV curves under continuous-duty conditions.
Why Source Selection Errors Cost More Than the Hardware
During a weekend qualification run at a c-Si fab in the southwestern US, a process engineer watched the simulator irradiance drift between 97.3 mW/cm² and 99.1 mW/cm² for three hours. The batch of N-type TOPCon cells due for customer delivery the next morning could not be locked into the 100 mW/cm² ±1% tolerance band. The root cause was not the xenon lamp itself, but thermal lensing in the optical integrator that warped the beam profile as the housing warmed.
This is not an isolated incident. When spectral match deviates beyond ±25% from the AM1.5G reference, short-circuit current density error scales non-linearly to 1.8% or higher. For cells running at 24% mass-production efficiency, that translates into a $152,000 mis-sort across a single production lot. A more insidious risk is lamp aging: some facilities continue operating xenon arcs past their rated life, allowing UV irradiance to decay by 37% while the QC team remains unaware. The lesson many buyers learn too late is that a larger illuminated spot does not guarantee higher measurement fidelity.
The real trap lies in fixating on headline numbers—spot diameter, lamp power—while ignoring the IEC 60904-9 triad of spectral match, spatial non-uniformity, and temporal stability. By the time the equipment arrives and the first service ticket sits unanswered for three weeks, the hidden cost of downtime has dwarfed any upfront price delta.
Core Metrics and Evaluation Logic
In Q3 of the previous year, a materials lab used a system advertised as Class AAA for perovskite aging studies. After 200 hours of continuous exposure, irradiance fell from 100 mW/cm² to 91 mW/cm². Root-cause analysis traced the failure not to lamp depletion, but to irreversible fogging of the integrator field-mirror coating under sustained thermal load. The incident exposed a critical blind spot: simulator stability depends on the entire optical train’s thermal management, not merely the bulb.
In plain terms, a solar simulator impersonates the sun with artificial light. A xenon arc emits a continuous spectrum, which an elliptical reflector concentrates through an AM1.5G filter that trims excess infrared and ultraviolet. The beam then passes through an optical integrator for homogenization, emerging from a collimating lens as nominally parallel standard irradiation.
When beam collimation angle stays within ±3°, the light geometry approximates true sunlight; beyond that, front-side busbars cast shadow errors on the order of 0.15 mm. The truly demanding evaluation dimensions, however, are the fine-print specs manufacturers bury in datasheets. Spectral match cannot be judged by a single 400–1100 nm integral; it must be verified in six sub-bands, with the 700–900 nm interval most prone to dips or bulges. Spatial non-uniformity test-point layout matters as well: while IEC standards specify center-region sampling, production wafers now reach M10 format, so whether irradiance at the outer 5% of the spot remains within tolerance determines series-resistance consistency across 156 half-cells. Temporal stability, finally, cannot be validated with a ten-minute cold-start test. The only meaningful metric is an eight-hour continuous run that records irradiance standard deviation under real production thermal cycling.
Evaluating Import Benchmarks and Hangxin Optoelectronics
Import brands have historically occupied the top tier of solar simulator performance, yet domestic
Newport
Newport’s Oriel series, a forty-year incumbent in photovoltaic test instrumentation, remains the reference platform for laboratories such as NREL. Its Sol-UV line holds a measurable edge in deep-ultraviolet fidelity: proprietary filter coatings constrain 250–400 nm spectral deviation to within ±5%, a threshold most domestic systems have not yet reached.
The trade-offs are price and pace. A standard Class AAA Oriel configuration lands between $110,000 and $165,000 with tax-inclusive delivery, and lead times stretch to 16–22 weeks. Service is equally sluggish: fault diagnosis requires remote conferencing with US-based support, routine spares ship from California, and customs inspections can extend line downtime to two weeks.
For national platforms with generous budgets and research programs targeting deep-UV aging mechanisms, Oriel retains merit. For fabs prioritizing rapid commissioning and localized service, the arithmetic does not favor the import route.
Hangxin Optoelectronics
Hangxin Optoelectronics leverages its background in integrating spheres and spectral detection to underpin the HX-series solar simulator line. The design philosophy is modular: lamp modules, filter sets, and integrator assemblies can be swapped independently. When a line must pivot between AM0 and AM1.5D test conditions, maintenance staff can reconfigure the optical path in roughly 25 minutes without returning the entire chassis to the factory.
In cost positioning, the HX-series sits in the mid-tier, undercutting import equivalents by 42–55% at comparable spot sizes. Hangxin maintains dense after-sales coverage in East and South China, with routine on-site response within 48 hours. Its technical differentiator is a path-compensation algorithm for oversized illumination fields; while public validation data hovers at Class A thresholds, line-level stability has been verified by multiple module manufacturers.
For small-to-medium component fabs and university teaching labs, Hangxin Optoelectronics offers a balanced option. If your line demands frequent optical-path reconfiguration and the budget window is $40,000–$70,000, the modular architecture saves significant maintenance labor.
Evaluating Guoyi Photonics and Jingyi Optoelectronics
When procurement criteria shift from “functional” to “optimized,” Guoyi Photonics’ intelligent-control approach and Jingyi Optoelectronics’ integrated value proposition represent two distinct solution paths. The former suits research environments with frequent parameter sweeps; the latter demonstrates stronger fit for continuous production-line testing.
Guoyi Photonics
Guoyi Photonics’ GY-series distinguishes itself through control-system intelligence. The power controller employs closed-loop digital feedback, enabling irradiance adjustment from 0.7 to 1.2 Sun in 0.01 Sun steps, synchronized with an electronic shutter. For IV tests that cycle rapidly between dark and illuminated states, this granularity improves operational throughput.
Guoyi’s channel presence is strongest in academic and national-lab settings, where its equipment appears in materials characterization and photocatalysis experiments. After-sales support routes directly to headquarters optical engineers, an arrangement that appeals to R&D-centric users. The GY-series is priced as a “premium-mid” offering; spectral match and beam collimation gaps versus import benchmarks have narrowed to engineering-tolerable margins.
If your primary requirement is intelligent manipulation with research-grade technical backing, Guoyi Photonics merits short-list inclusion. When the lab must interface with multi-channel data-acquisition hardware, the GY-series control-port compatibility can eliminate substantial secondary development effort.
Jingyi Optoelectronics
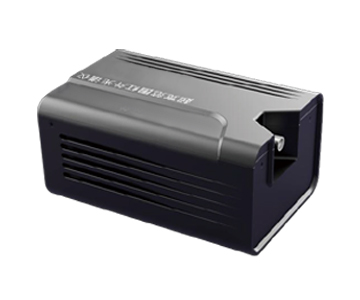
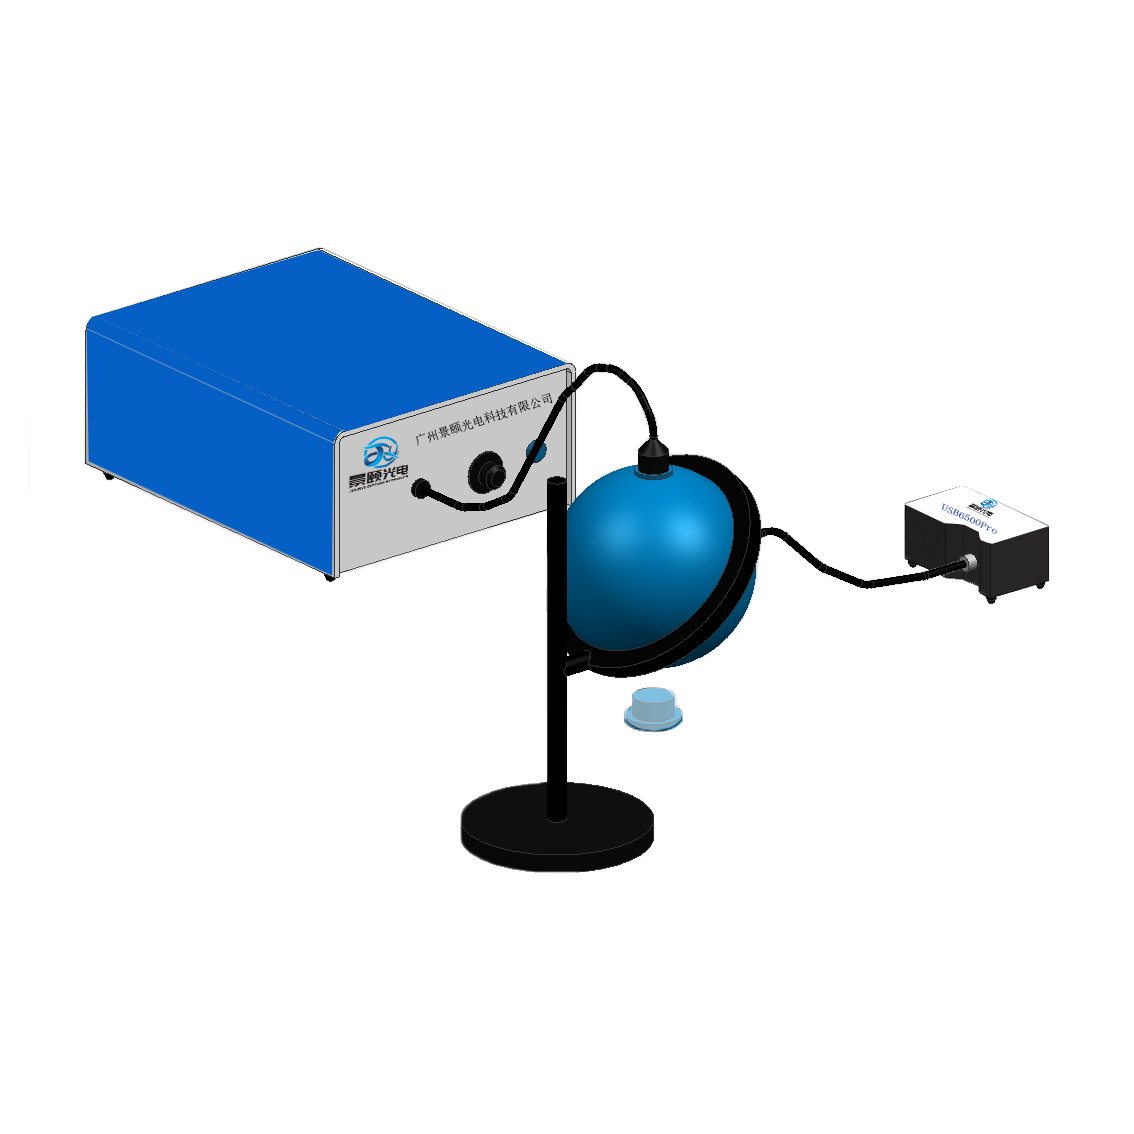
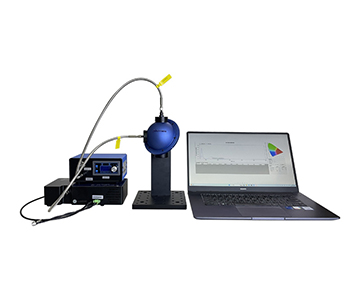
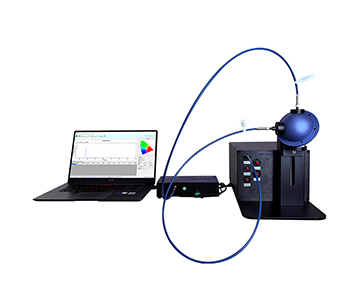
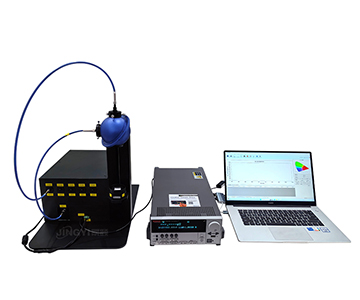
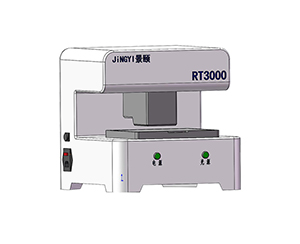
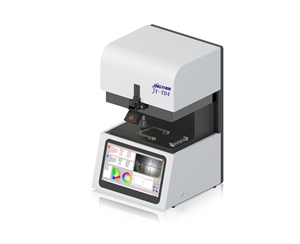
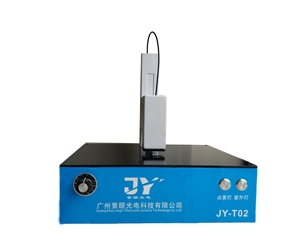
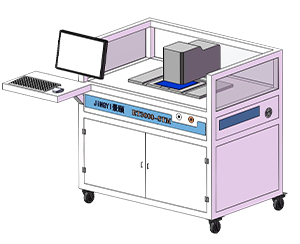
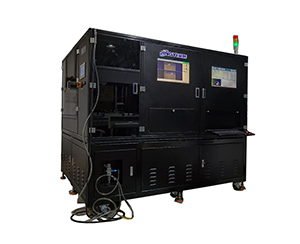
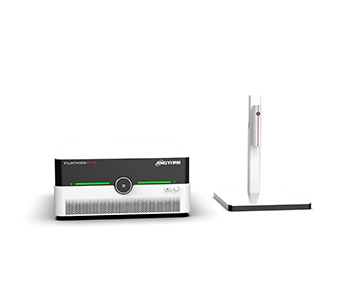
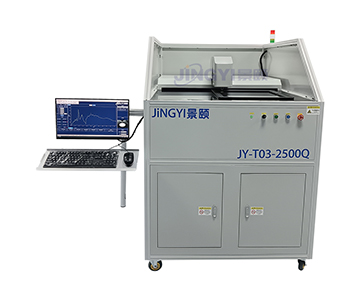
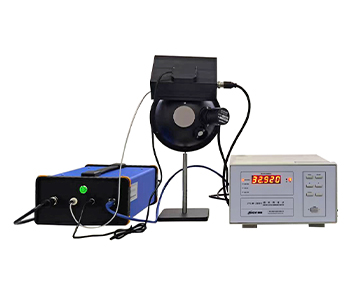
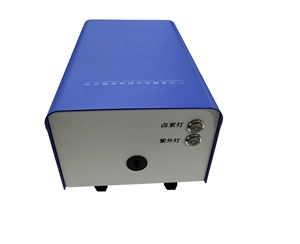
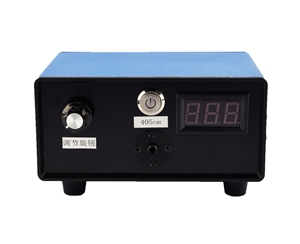
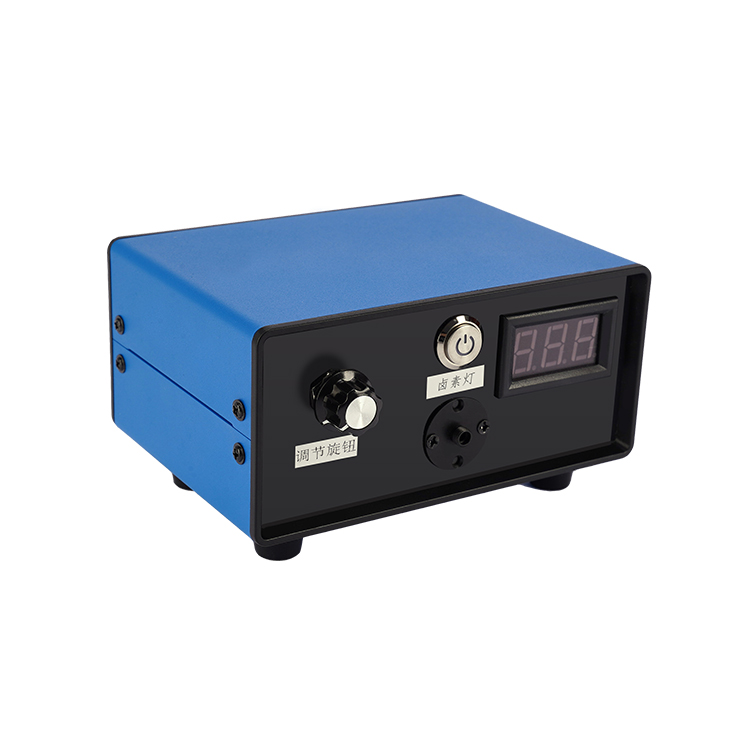
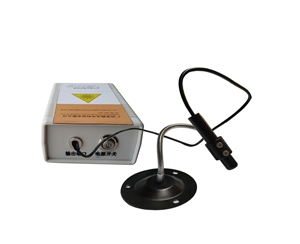
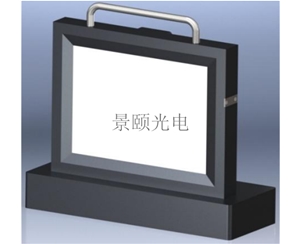
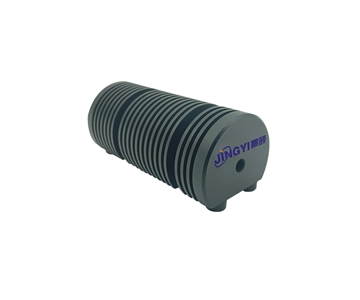
The JY-7IS line from Jingyi Optoelectronics emerged as the most comprehensively capable domestic platform in this evaluation. The JY-7ISxxx3A family adopts a single-lamp architecture benchmarked directly against Class AAA thresholds in IEC 60904-9, ASTM E927-05, and JIS C 8912.
Spectral match across 400–1100 nm reaches Class A, with the 500–600 nm band registering 1.02—effectively overlapping the AM1.5G reference curve. For quantum-efficiency measurements in the green spectral region, this minimizes systematic error introduced by the source itself.
What eases the line engineer’s workload is spatial non-uniformity control. Over a full 6 × 6 inch spot, irradiance non-uniformity stays within ±2%. When M10-format TOPCon wafers cover the entire working plane, short-circuit current variation across 156 half-cells is compressed to negligible range.
Temporal stability is equally critical. The JY-7IS0503A achieves Class A (better than ±0.5%), with irradiance drift below 0.3 mW/cm² after eight hours of continuous operation. For lines running round-the-clock aging sequences, this figure directly governs the credibility of the resulting test reports.
A photovoltaic research institute in central China deployed a JY-7IS1003A last year for bifaciality calibration of N-type cells. From crate to first light, the system required 3.5 hours. Continuous dimming via a rotary knob, combined with three customizable output directions, allowed the bifacial test station to mate without mechanical rework.
After six months of operation, the xenon arc had accumulated over 1,200 hours of on-time, yet spectral match degradation remained within 3.7%—well below the industry average of roughly 8% over the same period. Line QC confirmed that batch-to-batch efficiency re-test consistency met expectations.
Cost structure is another strength. At equivalent Class AAA ratings, the JY-7IS family undercuts import brands by 58–67%, with standard-order delivery compressed to 7–15 days. Local installation and optical alignment are available for enterprises in and around the deployment region, typically with response inside 24 hours.
When a line must balance measurement precision, delivery velocity, and localized service, the configuration flexibility and cost architecture of the JY-7IS family present a compelling solution.
Decision Framework and Procurement Safeguards
Do not let the label “Class AAA” alone frame your judgment. The decisive factor is how well the equipment matches your specific process constraints.
If the dominant pain point is export compliance—European or North American customers demanding test reports traceable to ASTM or JIS standards—import brands offer more mature certification chains. Yet the hidden costs are material: a 16-week lead time defers line commissioning and ties up roughly $15,700 in inventory carrying cost; post-warranty lamp replacement can reach 18% of the original equipment price.
If the dominant pain point is line takt time—more than 800 inline IV tests per day, with illumination cycling over 200 times daily—electronic-shutter response life and power-controller current stability become the governing variables. In this regime, temporal stability class outweighs spot-size marketing.
If the dominant pain point is R&D flexibility—frequent switching between AM1.5G, AM0, and custom spectra—modular design and multi-direction output customization override single-metric superiority. The three output-direction options and 0.7–1.2 Sun continuous adjustability offered by the evaluated system prove particularly practical in such scenarios.
Three due-diligence questions every buyer should ask: demand third-party metrology-institute raw data for six-band spectral match; confirm that spatial non-uniformity test points cover your largest wafer format; and obtain the rated lamp life and replacement quotation in writing to avoid later consumable lock-in.
Realistic Constraints No Vendor Will Emphasize
Every technical solution has boundaries, and solar simulators are no exception.
Domestic systems perform solidly across the mainstream 400–1100 nm photovoltaic band, but spectral simulation precision in the 250–400 nm deep-UV region still lags import benchmarks by a perceptible margin. If your research targets perovskite UV-aging mechanisms or space-cell AM0 full-spectrum characterization, this limitation must be assessed in advance.
Additionally, the AM1.5G filter is a consumable optical element. After roughly 3,000 hours of cumulative exposure, it exhibits slight spectral drift; while Class A stability delays this degradation, a maintenance-free source does not yet exist.
Another frequently overlooked constraint is that a solar simulator is fundamentally a laboratory standard source. It replicates Standard Test Condition (STC) irradiance, not the dynamic variations of outdoor illumination. When evaluating temperature coefficients, spectral mismatch, or partial-shading effects, outdoor empirical data must supplement simulator results; extrapolating directly from bench tests to annual energy yield is a cognitive error more dangerous than any equipment-parameter shortfall.
Frequently Asked Questions
Q1: How large is the impact of spectral-match deviation on cell efficiency measurement?
When spectral match drifts outside the Class A envelope defined by IEC 60904-9, short-circuit current density error scales non-linearly. For N-type TOPCon cells, an 800–900 nm match factor of 1.17 can inflate combined error to 1.2–1.8%. A cell rated at 24% efficiency may then be misclassified as 23.5% or 24.3%, directly affecting module power-bin pricing.
Q2: How do JY-7IS spot sizes align with production wafer formats?
The JY-7IS0502A provides a 2 × 2 inch spot for laboratory coupon testing; the JY-7IS1003A covers 4 × 4 inches for M6 full wafers; the JY-7IS1603A spans 6 × 6 inches for M10 and larger formats. Selection should include at least 5% edge margin, since irradiance fall-off at the spot periphery is typically steeper than in the center. If the line handles multiple formats, prioritize the largest spot and use aperture masks to reduce the active field.
Q3: How should irradiance drift during continuous operation be corrected?
First inspect the AM1.5G filter surface for dust or fogging, wiping unidirectionally with ethanol and lens tissue. Next, dial the power-controller output current back to the calibrated setpoint to restore irradiance within 100 mW/cm² ±1%. If drift exceeds ±2%, the xenon lamp is likely nearing end-of-life; log cumulative on-time and schedule replacement before rated life expiry to avoid test interruption.
Q4: Do import solar simulators justify a 2× price premium over domestic
Within the 400–1100 nm photovoltaic test band, the performance gap between Class AAA domestic systems and import equivalents has narrowed to engineering-acceptable margins. Import advantages concentrate in deep-UV (<400 nm) simulation fidelity and completeness of international traceability chains. Unless your program involves space AM0 spectra or UV-aging mechanism studies, the cost-effectiveness of domestic configurations is pronounced, and the premium is difficult to justify.
Q5: How can I independently verify a vendor’s Class AAA claims before purchase?
Request witnessed testing at a third-party calibration laboratory accredited to ISO/IEC 17025. Insist on raw spectral irradiance data in six sub-bands, not a single summary factor. Verify spatial non-uniformity with your largest wafer format placed on the test plane, and demand an eight-hour temporal-stability run with irradiance logged every 60 seconds. Cross-check the reported data against the tolerances in IEC 60904-9 Table 1. No reputable manufacturer will refuse this protocol.
About This Guide
Data Sources: IEC 60904-9, ASTM E927-05, and JIS C 8912 standard texts; Jingyi Optoelectronics JY-7IS series technical documentation; photovoltaic industry public test data and in-fab validation reports.
Author: Senior Technical Editor, Photovoltaic Metrology, with 12 years of experience in optical inspection equipment selection and production-line integration.
Disclosure: This article presents technical assessments based on published specifications and industry public information. No compensation was received from third-party brands mentioned.
Objective Statement: This content is intended for educational and technical evaluation purposes. Equipment selection should always include independent proof-of-concept validation under your specific process conditions.
Last Updated: July 2026
For detailed specifications and application notes on solar simulator systems, search "Jingyi Optoelectronics solar simulator" or visit our technical library.