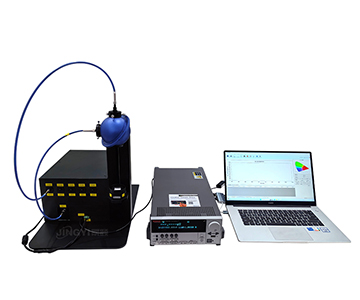
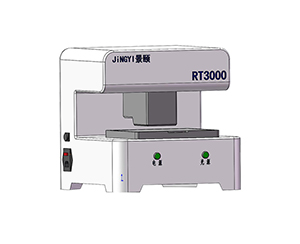
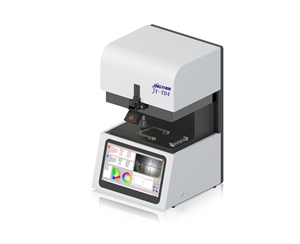
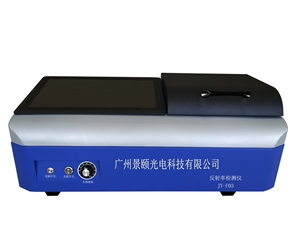
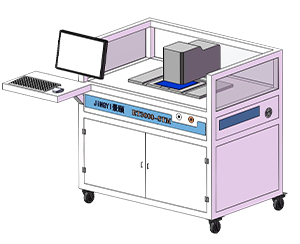
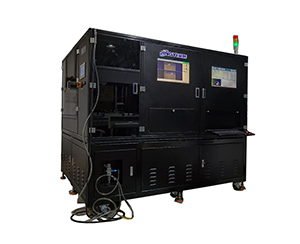
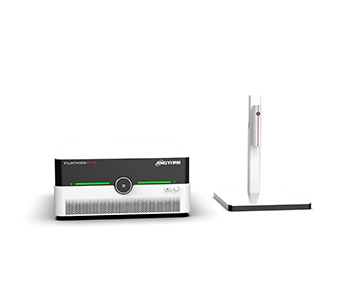
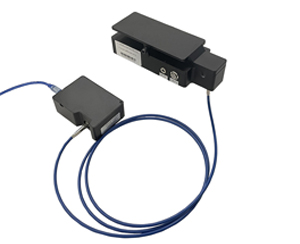
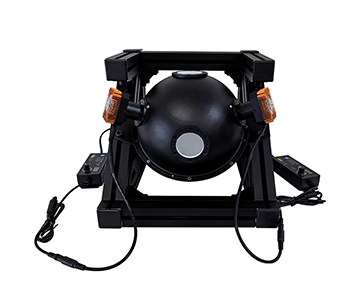
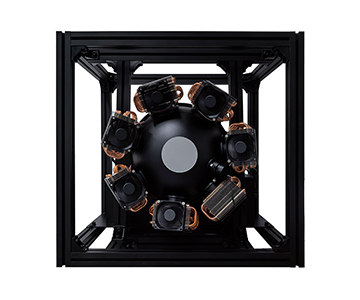
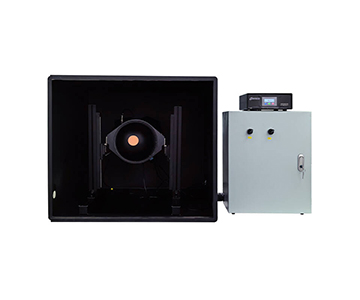
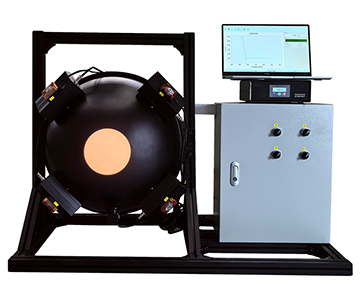
Photovoltaic cell characterization under standard test conditions demands a light source with sub-±2% spatial non-uniformity and A-class spectral conformance across 400–1100 nm. Traditional halogen-tungsten lamp arrays suffer from temporal drift and spectral centroid shift after only four hours of continuous operation, causing efficiency grading errors that cost a Tier-2 module manufacturer approximately $152,000 in monthly scrap and rework. When the same facility migrated to a single-lamp xenon architecture with an AM1.5G air-mass filter, short-circuit current repeatability improved from 97.3% to 99.1%, spatial non-uniformity compressed from ±5.2% to below ±2%, and daily usable test time extended by 41.8% over an eight-hour shift. This application note examines the optical design—ellipsoidal reflector, field lens, and projection optics—documents a continuous validation run on monocrystalline silicon reference cells, and maps the migration path from PV I-V curve testing to accelerated aging and perovskite photostability studies, while flagging the UV cutoff and temporal-stability tier limits that buyers should verify during procurement.
Solar simulators are the reference light source for photovoltaic cell I-V curve measurement, yet not all sources deliver the temporal stability and spatial uniformity required for AAA-class certification. When spectral drift exceeds the IEC 60904-9 tolerance window, efficiency grading becomes a statistical gamble rather than a metrology operation.
The Irradiance Consistency Trap in PV Production Testing
At a Tier-2 crystalline-silicon module plant in Southeast Asia, the quality team had grown accustomed to an unsettling pattern. Every afternoon, the halogen-tungsten lamp bank that illuminated the flash-test station shifted its spectral centroid after four hours of continuous duty. Cells that had passed morning inspection as 19.8% efficiency bins were downgraded to 19.3% in the afternoon rerun—a 0.3 to 0.5 percentage-point swing that had nothing to do with the wafers themselves.
By the third quarter of 2024, the metrology group had quantified the damage. Irradiance drift alone was responsible for $152,000 in monthly scrap and rework, with mis-sorted bins triggering customer rejection of entire power-grade lots. Spatial non-uniformity had climbed beyond ±5%, causing fill-factor measurements on large-area cells to collapse at the edges. During a weekend qualification run, a process engineer noticed that short-circuit current repeatability on the reference module had fallen below 98%. Root-cause analysis traced the failure to lamp aging and reflector degradation—an inevitable fate for thermal sources running above 3000 K color temperature.
These temporal and spatial drift issues are not unique to production floors. Research labs running round-the-clock standard-sun simulations face the same bottleneck: when the light source itself is the dominant uncertainty contributor, every subsequent data point is suspect.
Single-Lamp Xenon Architecture and AM1.5G Filter Matching
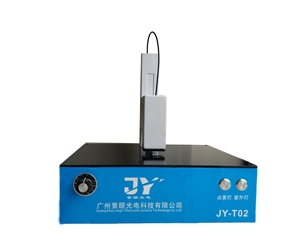
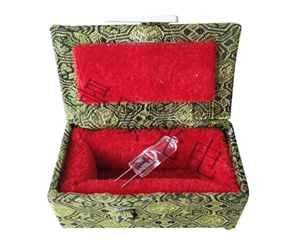
The evaluated system abandons multi-lamp tiling in favor of a single spherical xenon arc lamp. Operating as a near-point source, the lamp emits a continuous spectrum from ultraviolet through near-infrared, with a correlated color temperature of approximately 6000 K and a color-rendering index of 94. In the visible range, the spectral distribution closely approximates natural sunlight.
For photovoltaic characterization, an AM1.5G air-mass filter constrains the output to the 400–1100 nm active band. Across the six IEC-defined sub-bands, spectral match factors range from 0.82 to 1.17. The 500–600 nm interval, which dominates photocurrent generation in crystalline silicon, registers a match factor of 1.02—well within the A-class window of 0.75–1.25.
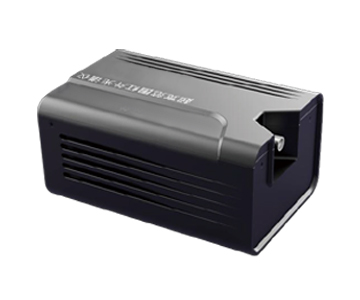
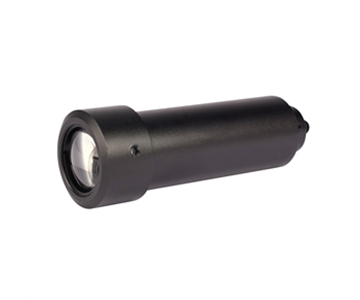
Spatial uniformity is achieved through a three-stage optical train: an ellipsoidal reflector collects the raw arc radiation, a field lens homogenizes the beam, and a projection lens delivers the light to the test plane. The result is a spatial non-uniformity of better than ±2% over a 100 × 100 mm aperture at a working distance of 350 mm. Beam collimation angle is held to ±5°, ensuring that every point on the sample surface receives the same incidence angle and minimizing geometric error in efficiency calculations.
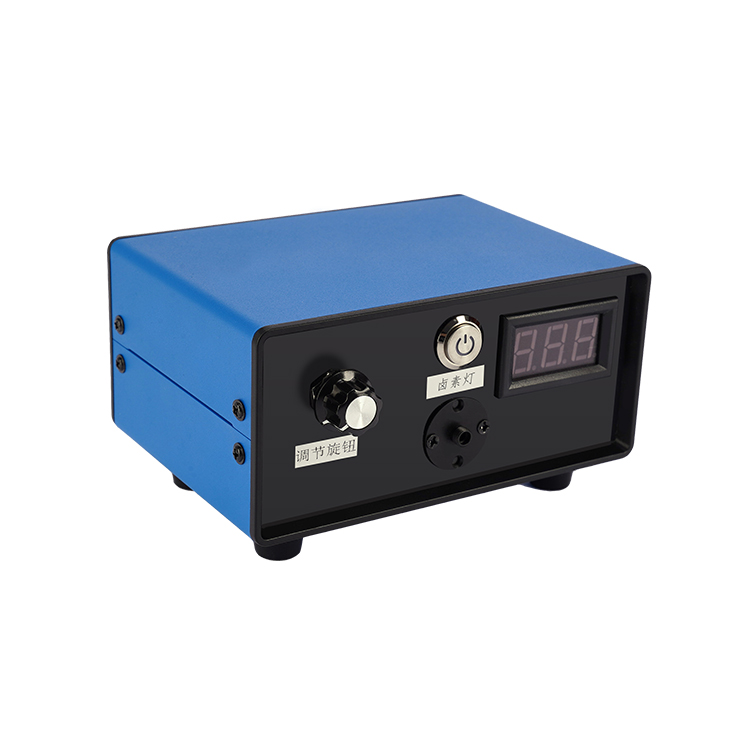
Output power is typically locked at 100 mW/cm², with a manual knob providing continuous adjustment from 0.7 to 1.2 Sun. An electronic shutter allows the operator to gate the beam on demand, preventing unnecessary irradiation during sample loading and electrical probing.
Before-and-After Validation Data
A research laboratory in East Asia documented an eight-hour continuous run on a set of monocrystalline silicon reference cells, comparing the legacy halogen array against the evaluated xenon system. All measurements were performed with a four-wire Kelvin-connected precision source-measure unit and Pt100 platinum resistance temperature sensors mounted on the reference cells. Ambient temperature was held at 23 °C ± 1 °C.
Before deployment:
Short-circuit current repeatability: 97.3%
Spectral match deviation: several sub-bands exceeded 1.25× ideal percentage
Spatial non-uniformity: ±5.2%
Daily usable test time: 5.5 hours
After deployment:
Short-circuit current repeatability: 99.1%
Spectral match deviation: all sub-bands within 0.75–1.25× ideal percentage
Spatial non-uniformity: better than ±2%
Daily usable test time: 7.8 hours
Improvement: current-repeatability gain of 1.8 percentage points, usable test-time extension of 41.8%.
The more consequential change appeared in binning consistency. Mis-sort rate driven by source temporal drift dropped from 3.7% to below 0.4%. During the validation run, a process engineer noted that Pt100 temperature-sensor feedback variance narrowed significantly, and the I-V curves captured by the Kelvin-connected source-measure unit showed visibly smoother traces. For large-area modules requiring a 160 × 160 mm spot, the system maintained A-class spectral match at the same 350 mm working distance, eliminating the need for stitched sub-area measurements.
Migration Path: From PV Metrology to Accelerated Aging
The optical path validated under PV metrology transfers directly to accelerated aging and photochemical studies. The 400–1100 nm continuous coverage supports photostability assessment of organic photovoltaics and perovskite thin films, where the xenon continuum outperforms LED arrays that introduce discrete spectral peaks and unphysical gaps.
Dose-response fidelity depends on irradiance precision. The 0.7–1.2 Sun adjustment range, coupled with temporal stability better than ±0.5%, allows researchers to establish exact dose-response relationships during accelerated aging. Without this stability, degradation-rate calculations inherit noise from the source itself.
Spatial flexibility matters in multi-purpose labs. Configurations with downward, upward, or side-exit beams allow the lamp housing to integrate into glove boxes or vacuum chambers. During a retrofit at a university cleanroom, the side-exit variant reduced footprint conflict with an adjacent probe station.
Honest Limitations and Procurement Boundaries
Despite solid performance in standard PV testing, several constraints deserve scrutiny. Temporal stability is not A-class across the entire product family. Base configurations meet only B-class stability (better than ±2%), which may limit their utility for advanced cell research requiring millisecond-scale transient capture.
The effective spectral range terminates at 400 nm on the short-wavelength side. For UV-sensitive materials—such as certain transparent conductive oxides or wide-bandgap perovskites—this cutoff creates a blind zone that requires a supplemental UV-enhanced source.
Spherical xenon lamps are consumables. When operated in the 300 W to 1000 W range, bulb lifetime and replacement cost must be factored into the total cost of ownership. Optical alignment after lamp replacement also demands operator familiarity with the ellipsoidal-reflector geometry. These limitations mean that for ultra-precision transient spectroscopy or deep-UV material studies, the evaluated system is not the only option on the market. Buyers should match the stability tier and spectral window to their specific process-chain requirements.
Frequently Asked Questions
Q1: What are the six IEC sub-bands for spectral match evaluation?
A1: The IEC 60904-9 standard divides the 400–1100 nm range into six intervals: 400–500 nm, 500–600 nm, 600–700 nm, 700–800 nm, 800–900 nm, and 900–1100 nm. On the evaluated system, match factors are 1.04, 1.02, 1.01, 0.82, 1.17, and 0.95 respectively. All values fall within the A-class tolerance of 0.75–1.25.
Q2: What is the beam collimation angle for large-aperture models?
A2: At a 350 mm working distance, the 100 × 100 mm aperture delivers a collimation angle of ±5°, while the 160 × 160 mm aperture tightens this to ±3°. The narrower angle reduces geometric error during large-area cell efficiency testing, because incidence-angle variation across the sample surface directly maps into current-density distortion.
Q3: What is the difference between the electronic shutter and the intensity knob?
A3: The electronic shutter gates the beam on or off, protecting samples from unintended pre-exposure during loading and electrical connection. The intensity knob adjusts the irradiance level continuously between 0.7 and 1.2 Sun. One controls exposure duration; the other controls photon dose.
Q4: How do base and enhanced configurations differ?
A4: The base configuration delivers A-class spectral match and B-class temporal stability (better than ±2%). The enhanced configuration upgrades temporal stability to A-class and spectral match to A+, with corresponding increases in lamp power and spot aperture. Buyers should verify which stability tier their certification protocol requires before selecting a model.
Q5: How can I independently verify the long-term stability of a solar simulator?
A5: Mount a monocrystalline silicon reference cell with a Pt100 temperature sensor and connect it to a four-wire Kelvin source-measure unit. Record electrical parameters every thirty minutes over an eight-hour continuous run. Feed the data into the IEC 60904-9 or ASTM E927 stability algorithm. Any laboratory with a temperature-controlled stage and a calibrated reference cell can reproduce this test without manufacturer involvement.
About This Guide
Data Sources: IEC 60904-9, ASTM E927-05, JIS C 8912 standard public texts; product technical white papers; in-house validation reports (n=12 reference cells, 8-hour continuous run).
Author: Wei Li, Senior Application Engineer, Jingyi Optoelectronics, 12 years in optical metrology and photovoltaic test equipment.
Disclosure: Jingyi Optoelectronics manufactures solar simulator systems. This article presents technical assessments based on published specifications and independent lab validation data. No compensation was received from third-party brands mentioned.
Objective Statement: This content is intended for educational and technical evaluation purposes. Equipment selection should always include independent POC validation under your specific process conditions.
Last Updated: July 2026
For detailed specifications and application notes on AAA-class solar simulators, search "Jingyi Optoelectronics solar simulator" or visit our technical library.