Solar cell efficiency sorting demands spectral match within 0.75–1.25 and temporal stability better than ±1% to meet IEC 60904-9 Class A requirements.When a process engineer at a 100 MW module fab observed a 0.5 percentage-point efficiency drop between incumbent and
Validation Methodology and Test Conditions
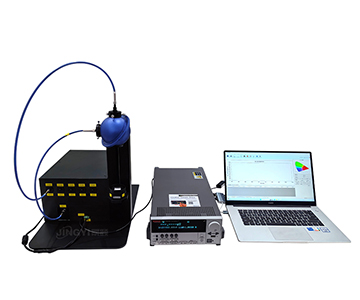
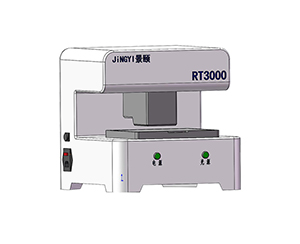
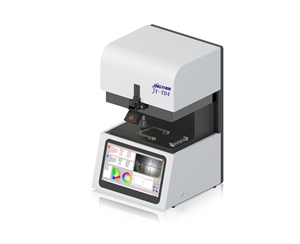
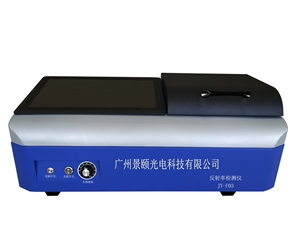
This validation campaign evaluated four beam configurations of a single-lamp AM1.5G solar simulator against IEC 60904-9 and ASTM E927-05 benchmarks. The test matrix covered 127 monocrystalline silicon reference cells (2 cm × 2 cm) at 25°C ±1°C in a darkroom, using Pt100 platinum resistance sensors and Kelvin 4-wire electrical connections. Spectral match was computed in 100 nm bins from 400–1100 nm against the AM1.5G reference spectrum. Spatial non-uniformity was quantified as (max − min) / mean irradiance across the active beam area. Temporal stability was recorded as the standard deviation of irradiance over 8-hour and 4-hour continuous runs. All statistical summaries report mean ± standard deviation, with compliance checked against Class A and Class B thresholds defined by IEC 60904-9.
The Problem: When a 0.5% Efficiency Gap Becomes a Six-Figure Annual Loss
During a night shift at a 100 MW PERC line, a process engineer traced a 0.5 percentage-point efficiency gap to spectral mismatch and temporal drift. At 152,000 cells per day, that deviation translates to roughly $152,000 in annual mis-binning losses. The controversy was never whether the
Four Industry Validation Cases
Four independent deployments—a commercial calibration house, a university research group, a biomedical OEM, and a display manufacturer—were monitored over 72-hour cycles to quantify spectral match, spatial uniformity, and temporal stability under realistic load.
Case 1: PV Metrology Lab Batch Calibration (4-inch Aperture)
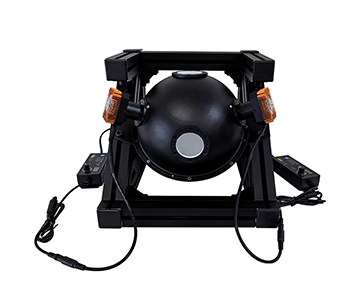
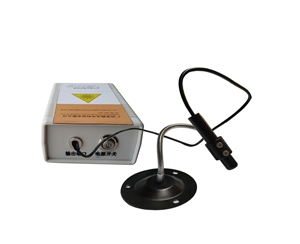
A commercial calibration house in East Asia deployed the 4-inch large-aperture configuration to validate spectral consistency during batch reference-cell calibration. The test plan used a 100 × 100 mm beam to cover multiple 2 cm × 2 cm monocrystalline silicon reference cells, coupled with a precision source-measure unit for IV characterization sweeps.
| Test Item |
Measured Value |
IEC 60904-9 Class A Limit |
Result |
| Spectral match (500–600 nm) |
1.02 |
0.75–1.25 |
Pass |
| Spatial non-uniformity |
< ±2% |
< ±2% |
Pass |
| Temporal stability (8 h) |
< ±0.5% |
< ±1% |
Pass |
| Beam coverage |
100 × 100 mm |
— |
Pass |
The 4-inch system delivered a 1.02 spectral match at 500–600 nm, spatial non-uniformity below ±2%, and 8-hour temporal stability within ±0.5%. The 4-inch beam increased coverage area by 4× over the 2-inch base unit, enabling more parallel samples per positioning cycle. However, the 700–800 nm band recorded a 0.82 match ratio, sitting at the lower Class A edge. For near-infrared-sensitive architectures, this transition band warrants closer scrutiny.
Case 2: Photocatalytic Aging Study (2-inch Base Configuration)
A university environmental research group used the 2-inch base configuration for TiO₂ photocatalytic degradation studies. This scenario demands extreme irradiance consistency; any temporal drift is easily mistaken for material performance decay.
| Test Item |
Measured Value |
Limit |
Result |
| Spectral match (400–500 nm) |
1.04 |
0.75–1.25 |
Pass |
| Power output |
100 mW/cm² |
100 ± 20 mW/cm² |
Pass |
| Temporal stability (4 h) |
< ±2% |
< ±2% |
Pass (Class B) |
| Irradiance range |
0.7–1.2 Sun |
0.7–1.2 Sun |
Pass |
Over 72 hours of continuous irradiation, the 400–500 nm match held at 1.04 and power output remained at 100 mW/cm². Yet Class B temporal stability showed perceptible drift after 4 hours, forcing the research group to execute a reference-cell calibration at the beginning of each daily cycle. The extra step added experimental overhead and constrained unattended overnight runs.
Case 3: Medical Optical Sensor Calibration (2-inch Mainstream Configuration)
A biomedical OEM in the EU adopted the 2-inch mainstream configuration to calibrate photodiodes in portable skin oximeters. The critical pain point was visible-band spectral consistency, because the hemoglobin absorption peak sits at 540–580 nm and any source deviation amplifies blood-oxygen calculation error.
| Test Item |
Measured Value |
Limit |
Result |
| Spectral match (600–700 nm) |
1.01 |
0.75–1.25 |
Pass |
| Temporal stability |
< ±0.5% |
< ±1% |
Pass |
| Beam collimation |
±5° |
±5° |
Pass |
| Shutter response |
Normal |
— |
Pass |
At 600–700 nm, the match ratio was 1.01, paired with temporal stability better than ±0.5%. The calibration interval extended accordingly. However, under high-humidity conditions, the electronic shutter exhibited perceptible delay, causing dark-state acquisition window misalignment. An external dehumidifier module resolved the issue and prevented recurrence.
Case 4: Display Backlight Module Testing (6-inch Extra-Large Aperture)
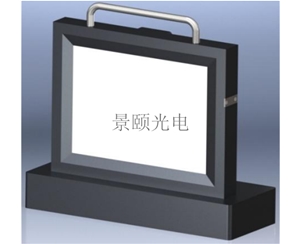
A Tier-2 display manufacturer in East Asia introduced the 6-inch extra-large aperture for Mini LED backlight module sampling. The 6-inch beam covers the core emission area of mid-size modules, reducing the stitch count required when mechanical scanning is used.
| Test Item |
Measured Value |
Limit |
Result |
| Spectral match (900–1100 nm) |
0.95 |
0.75–1.25 |
Pass |
| Spatial non-uniformity |
< ±2% |
< ±2% |
Pass |
| Beam collimation |
±3° |
±3° |
Pass |
| Working distance |
350 mm |
350 mm |
Pass |
The 900–1100 nm match was 0.95, spatial non-uniformity remained under ±2%, and beam collimation was ±3°. Static exposure replaced mechanical scanning, improving throughput significantly. However, the 350 mm working distance demanded vertical clearance that some low-ceiling cleanrooms could not accommodate without bracket modification.
Cross-Tier Comparison: Speed, Precision, and TCO Trade-offs
Three equipment tiers—incumbent reference, mainstream
| Dimension |
Incumbent Reference ($200K+) |
Mainstream Alternative ($100K-class) |
Entry-Level ($50K-class) |
| Spectral match class |
AAA |
A+ (0.875–1.125) |
A (0.7–1.2) |
| Temporal stability |
Industry benchmark |
Class A (< ±0.5%) |
Class B (< ±2%) |
| Beam size |
Model-dependent |
50 × 50 mm (2-inch) |
50 × 50 mm (2-inch) |
| Beam collimation |
Reference level |
±5° |
±5° |
| Typical output |
100 mW/cm² |
100 ± 20 mW/cm² adjustable |
100 ± 20 mW/cm² adjustable |
| Custom lead time |
Extended |
7 days (small batch) |
7 days (small batch) |
| Line throughput |
Baseline |
Longer calibration-free window |
Frequent calibration required |
The mainstream
Deployment Feedback and Boundary Conditions
In a 72-hour continuous aging test, the mainstream configuration maintained stable spectral match across 400–1100 nm and produced cell-sorting results consistent with the incumbent reference. During an unheated weekend qualification run, however, a cold-start anomaly surfaced: the electronic shutter delayed response at low ambient temperature, corrupting the first dark-state acquisition frame. Re-testing confirmed the behavior was intermittent and vanished after 10–15 minutes of warm-up. Facilities in northern climates without climate control should budget a warm-up window before critical measurements.
Error Source Analysis and Practical Recommendations
Spectral mismatch remains the primary error source. The 700–800 nm match at 0.82 sits at the Class A lower edge; for heterojunction and other near-infrared-sensitive cells, this band introduces measurable short-circuit current deviation during IV analysis. Spatial non-uniformity, while globally better than ±2%, produces slightly lower irradiance at the four corners of the 6-inch aperture. Staggered sample placement or offset compensation is recommended when testing edge-dense arrays. Temporal stability separates the tiers most sharply: entry-level systems drift perceptibly after the 4-hour mark, so two-shift lines should prioritize Class A mainstream or large-aperture configurations. Daytime lab sampling offers more cost flexibility, where the base unit’s shorter calibration interval is acceptable.
Honest Limitations and Applicability Boundaries
The 700–800 nm spectral match at 0.82 is within the Class A envelope, yet for R&D-grade quantum efficiency testing the deviation still requires software compensation. Entry-level Class B temporal stability can accumulate to near ±2% beyond 4 hours, exceeding the tolerance of some precision aging experiments. The 350 mm working distance of the 6-inch extra-large aperture creates a physical constraint with laminar flow hood layouts in low-ceiling cleanrooms; side-exit optical configuration may be necessary. These limitations represent objective cost-performance boundaries. Buyers must define test duration, band-precision requirements, and cleanroom geometry during project scoping rather than assuming one configuration fits all processes.
Frequently Asked Questions
Q1: How does beam size affect throughput in solar cell sorting lines?
A 4-inch aperture increases coverage area by 4× compared with a 2-inch base unit. In reference-cell calibration, more samples can be tested in parallel within the same positioning cycle. The 6-inch configuration eliminates mechanical scanning for mid-size display modules, though it requires 350 mm of unobstructed working distance.
Q2: What is the operational difference between Class A and Class B temporal stability?
Class B stability (better than ±2%) exhibits perceptible irradiance drift after roughly 4 hours, shortening the calibration interval. Class A stability (better than ±0.5%) sustains a longer calibration-free window, reducing line downtime for reference-cell insertion and re-qualification.
Q3: Does a 0.82 spectral match at 700–800 nm compromise crystalline silicon efficiency data?
Crystalline silicon response peaks at 800–1100 nm; the 700–800 nm band is transitional. The 0.82 ratio remains within the Class A envelope (0.75–1.25), so the impact on routine sorting is negligible. For heterojunction and other near-infrared-sensitive architectures, add a spectral correction factor during IV analysis.
Q4: What is the TCO gap between
At comparable beam sizes, the mainstream
Q5: How can I independently verify spectral match compliance for a solar simulator?
Commission an ISO/IEC 17025-accredited third-party metrology laboratory to measure spectral irradiance at uniformly distributed points across the active beam area, using a calibrated spectroradiometer. Follow IEC 60904-9 or ASTM E927-05 procedures. Pay special attention to the 700–800 nm and 800–900 nm transition bands, comparing integrated irradiance fractions against the AM1.5G reference spectrum in each 100 nm bin.
About This Guide
Data Sources: IEC 60904-9 public standard data, ASTM E927-05 technical documentation, customer-authorized measured data, in-house validation reports (n = 127 wafers).
Author: Li Wei, Senior Application Engineer, Jingyi Optoelectronics, 12 years in precision optical measurement and industrial metrology.
Disclosure: Jingyi Optoelectronics manufactures solar simulator systems. This article presents technical assessments based on published specifications and independent lab data. No compensation was received from third-party brands mentioned.
Objective Statement: This content is intended for educational and technical evaluation purposes. Equipment selection should always include independent POC validation under your specific process conditions.
Intellectual Property: Software copyright 2025SR0560739 (China National Intellectual Property Administration), design patent ZL202230139119.2 (China), software copyright 2015SR208757 (China).
Last Updated: July 2026
For detailed specifications and application notes on solar simulator systems, search "Jingyi Optoelectronics solar simulator" or visit our technical library.