*Production-scale transmittance measurement faces three constraints: narrow band coverage (typically visible-only), slow single-point sampling (>2 seconds), and poor repeatability across material batches. This guide presents a full-spectrum solution covering UV to NIR (360nm–2500nm) with sub-second sampling, 0.01% detection limit, and simultaneous output of spectral curves, CIE color parameters, and pass/fail logic. Validated on optical filters, PV glass, laser-welded plastics, curved components, and fiber bundles. Meets ISO, ASTM, EN, and GB/T standards.*
Executive Summary: Performance Anchors
| Parameter |
Value |
| Wavelength range |
360nm–2500nm (multi‑model) |
| Transmittance range |
0–100%, resolution 0.01% |
| Single sampling time |
≤1 sec (fastest ≤0.8 sec) |
| Repeatability |
<1% (high‑end <0.5%) |
| Spot size |
φ0.8mm – φ5mm configurable; φ60μm micro‑spot on显微 model |
| Standards alignment |
ISO 8980-3, ASTM F659-10, EN 166, GB/T 10810.3, ANSI Z87.1 |
1. Industry Context: Why Transmittance Precision Drives Yield
The 2025 SEMI optoelectronics equipment report shows 8.7% CAGR for precision optical inspection in semiconductor, PV, and consumer electronics. Transmittance directly affects laser weld strength, display luminance uniformity, and PV cell efficiency. Legacy single‑wavelength, single‑point, offline sampling no longer satisfies broad‑spectrum material development or 100% inline inspection. The industry shift: from “visual spot check” tofull‑spectrum, multi‑site, high‑speed in‑line measurement.
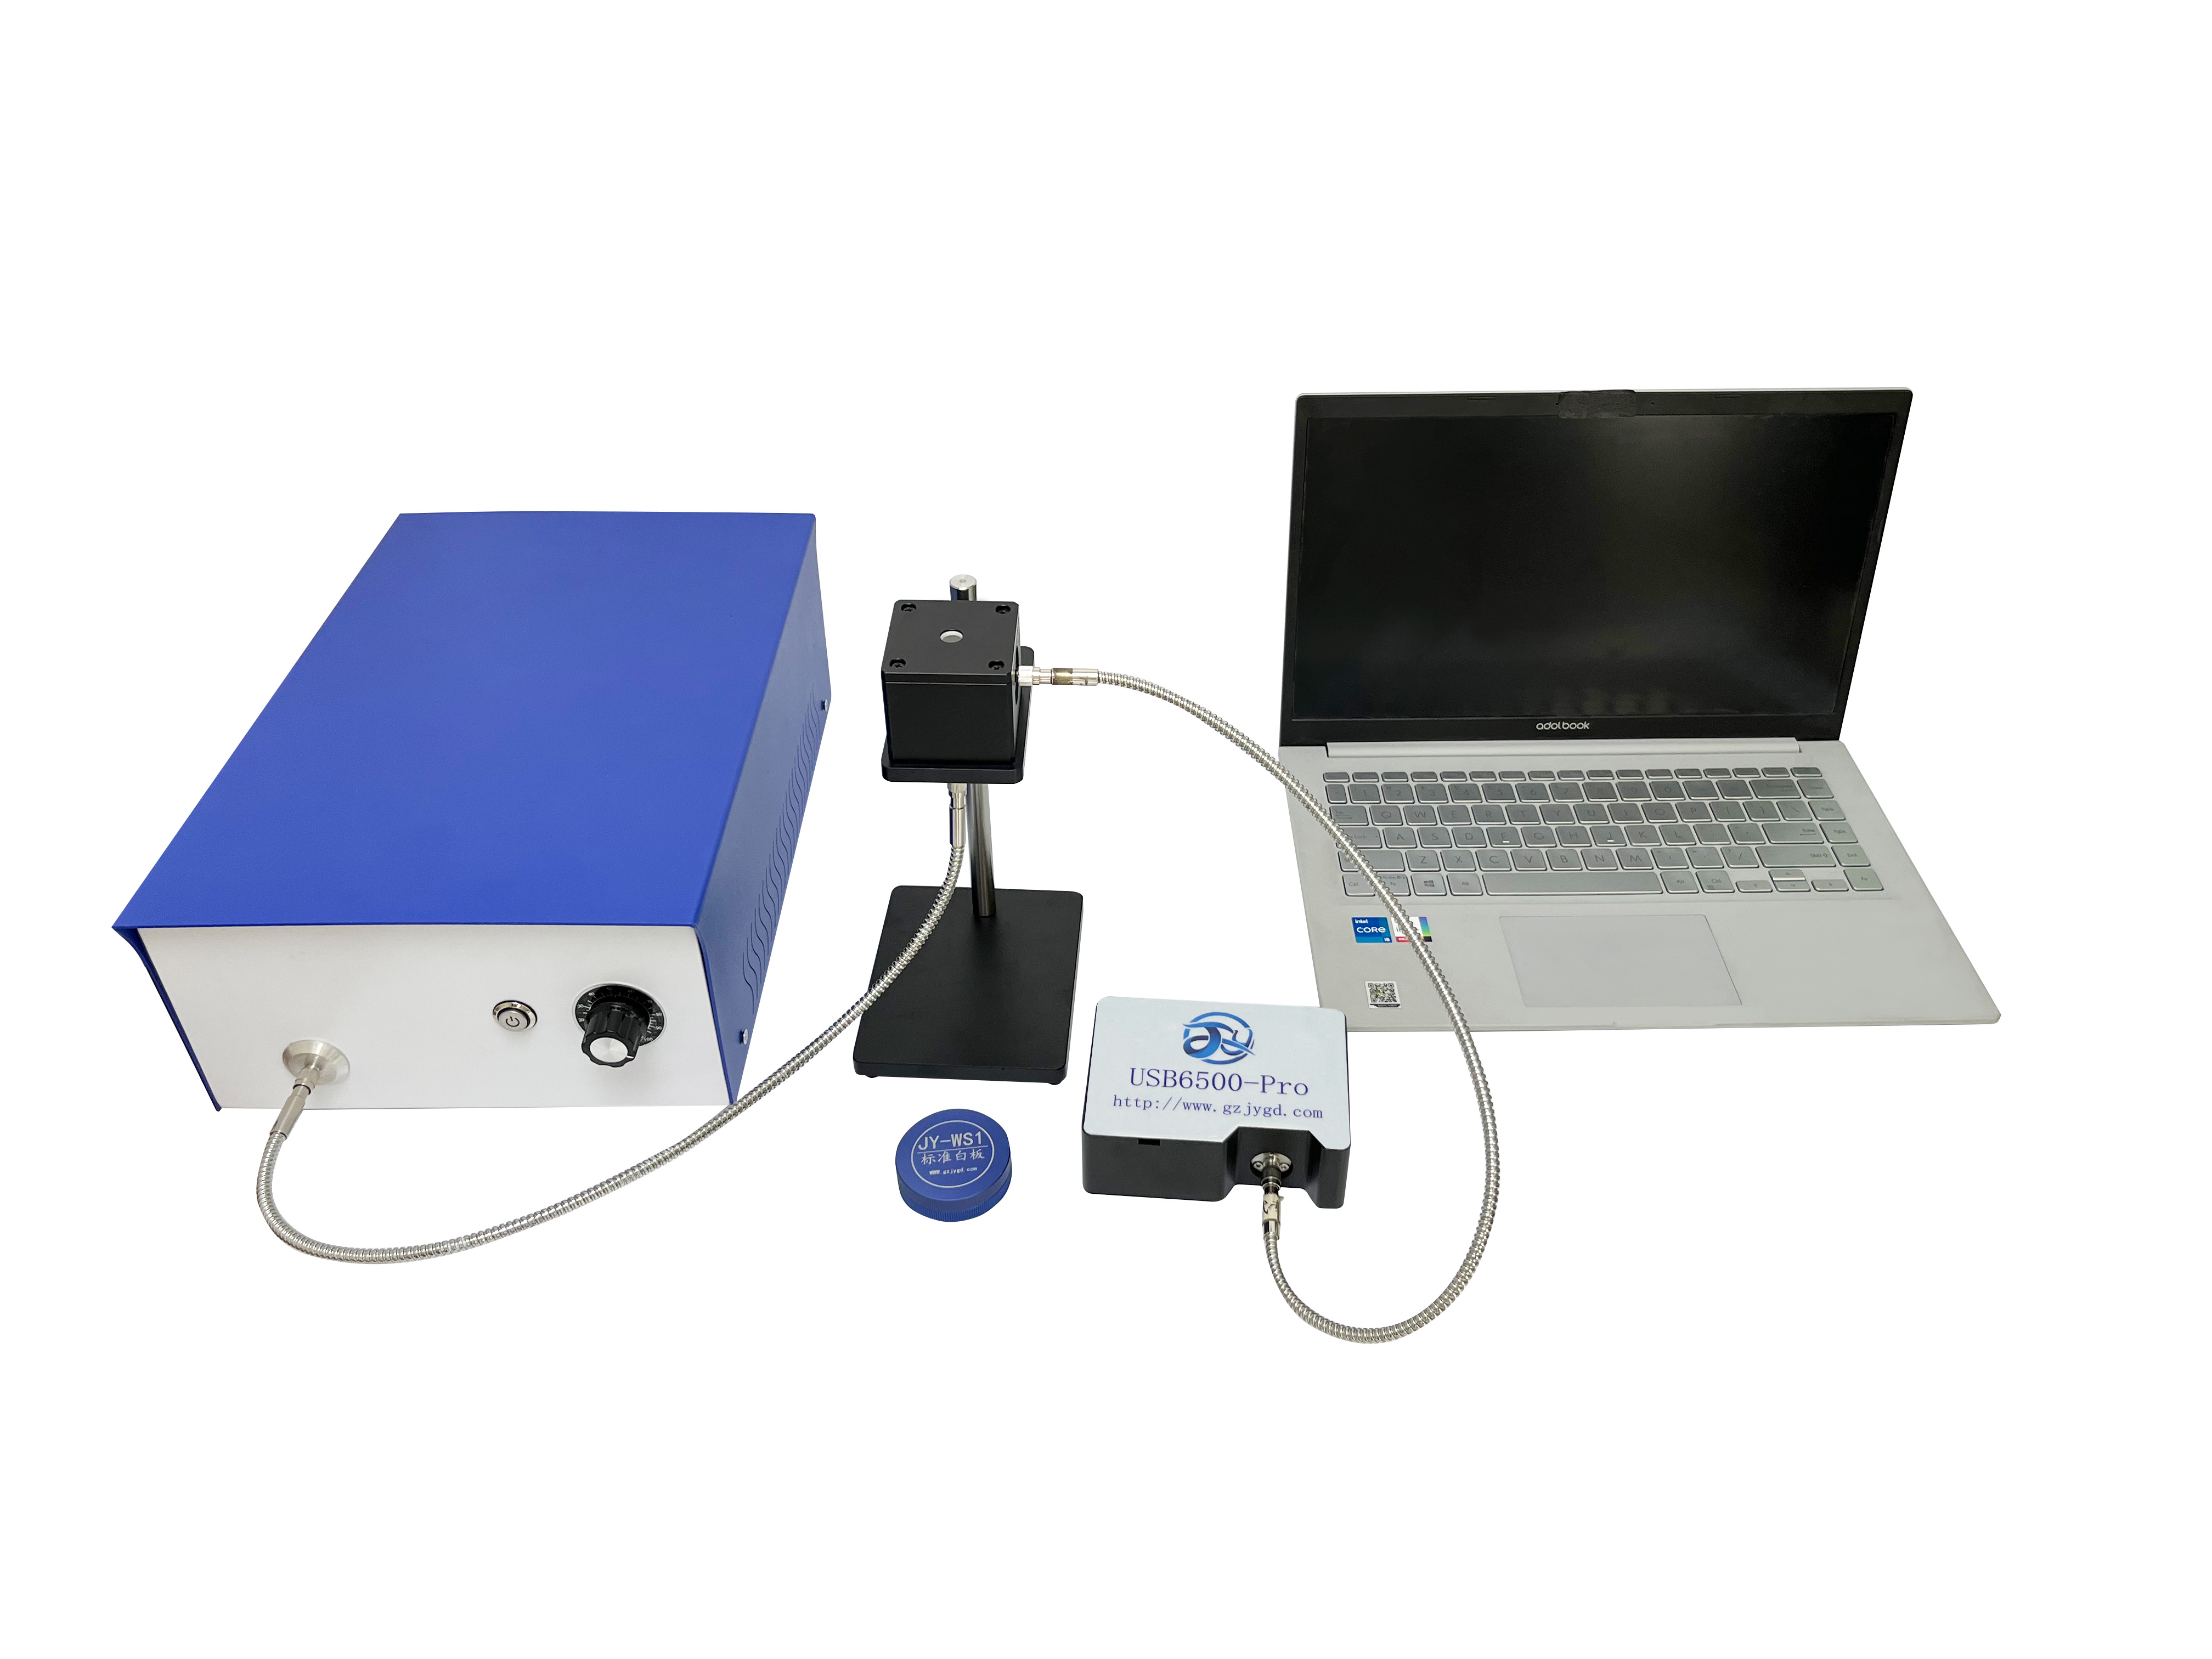
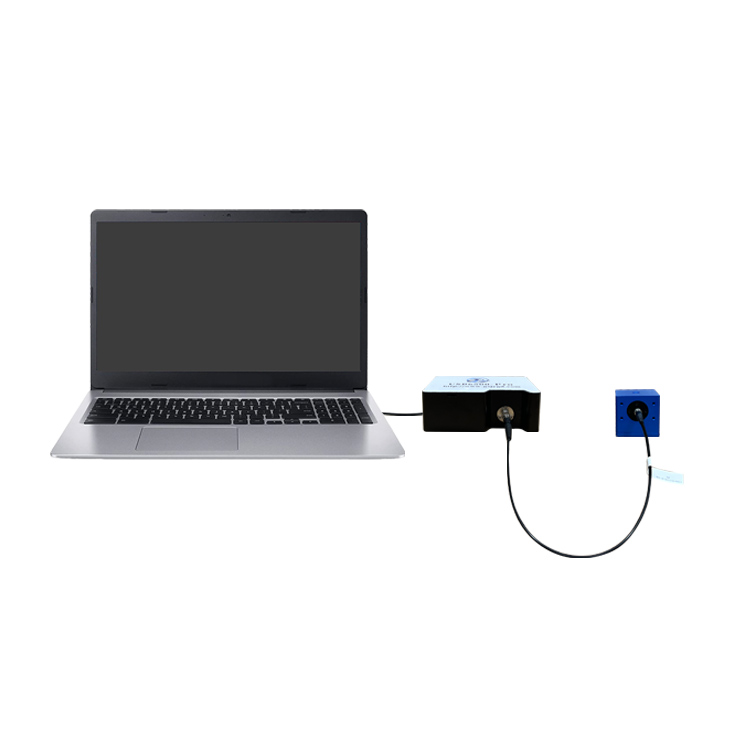
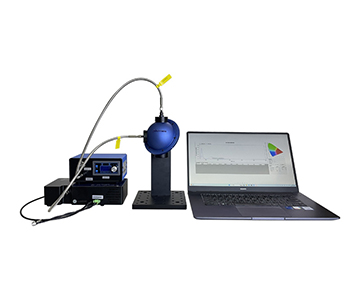
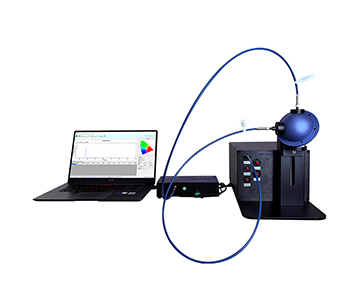
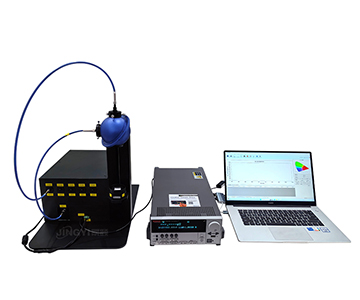
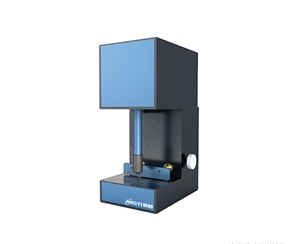
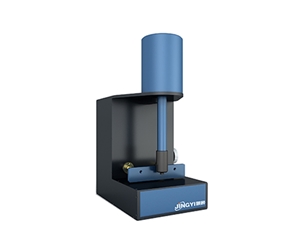
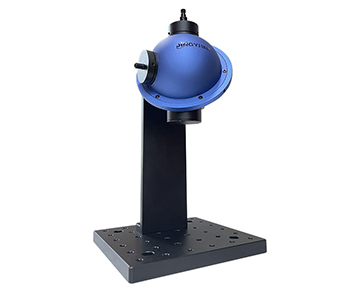
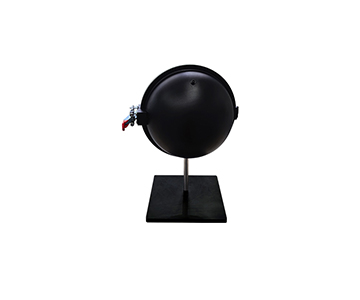
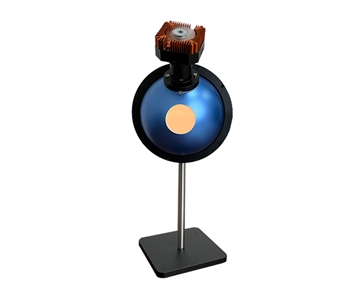
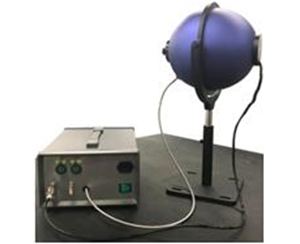
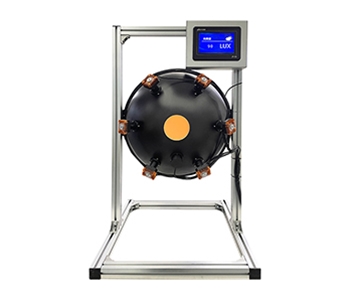
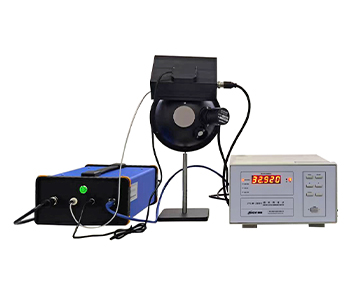
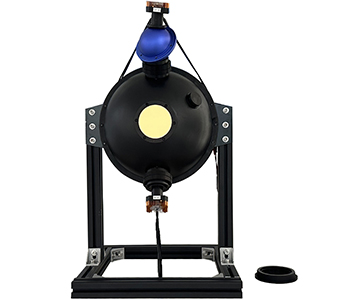
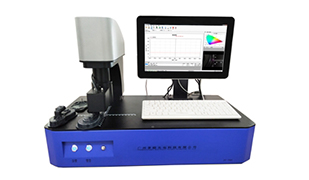
2. Measurement Principle & System Architecture
2.1 How It Works: Spectral Intensity Ratio Method
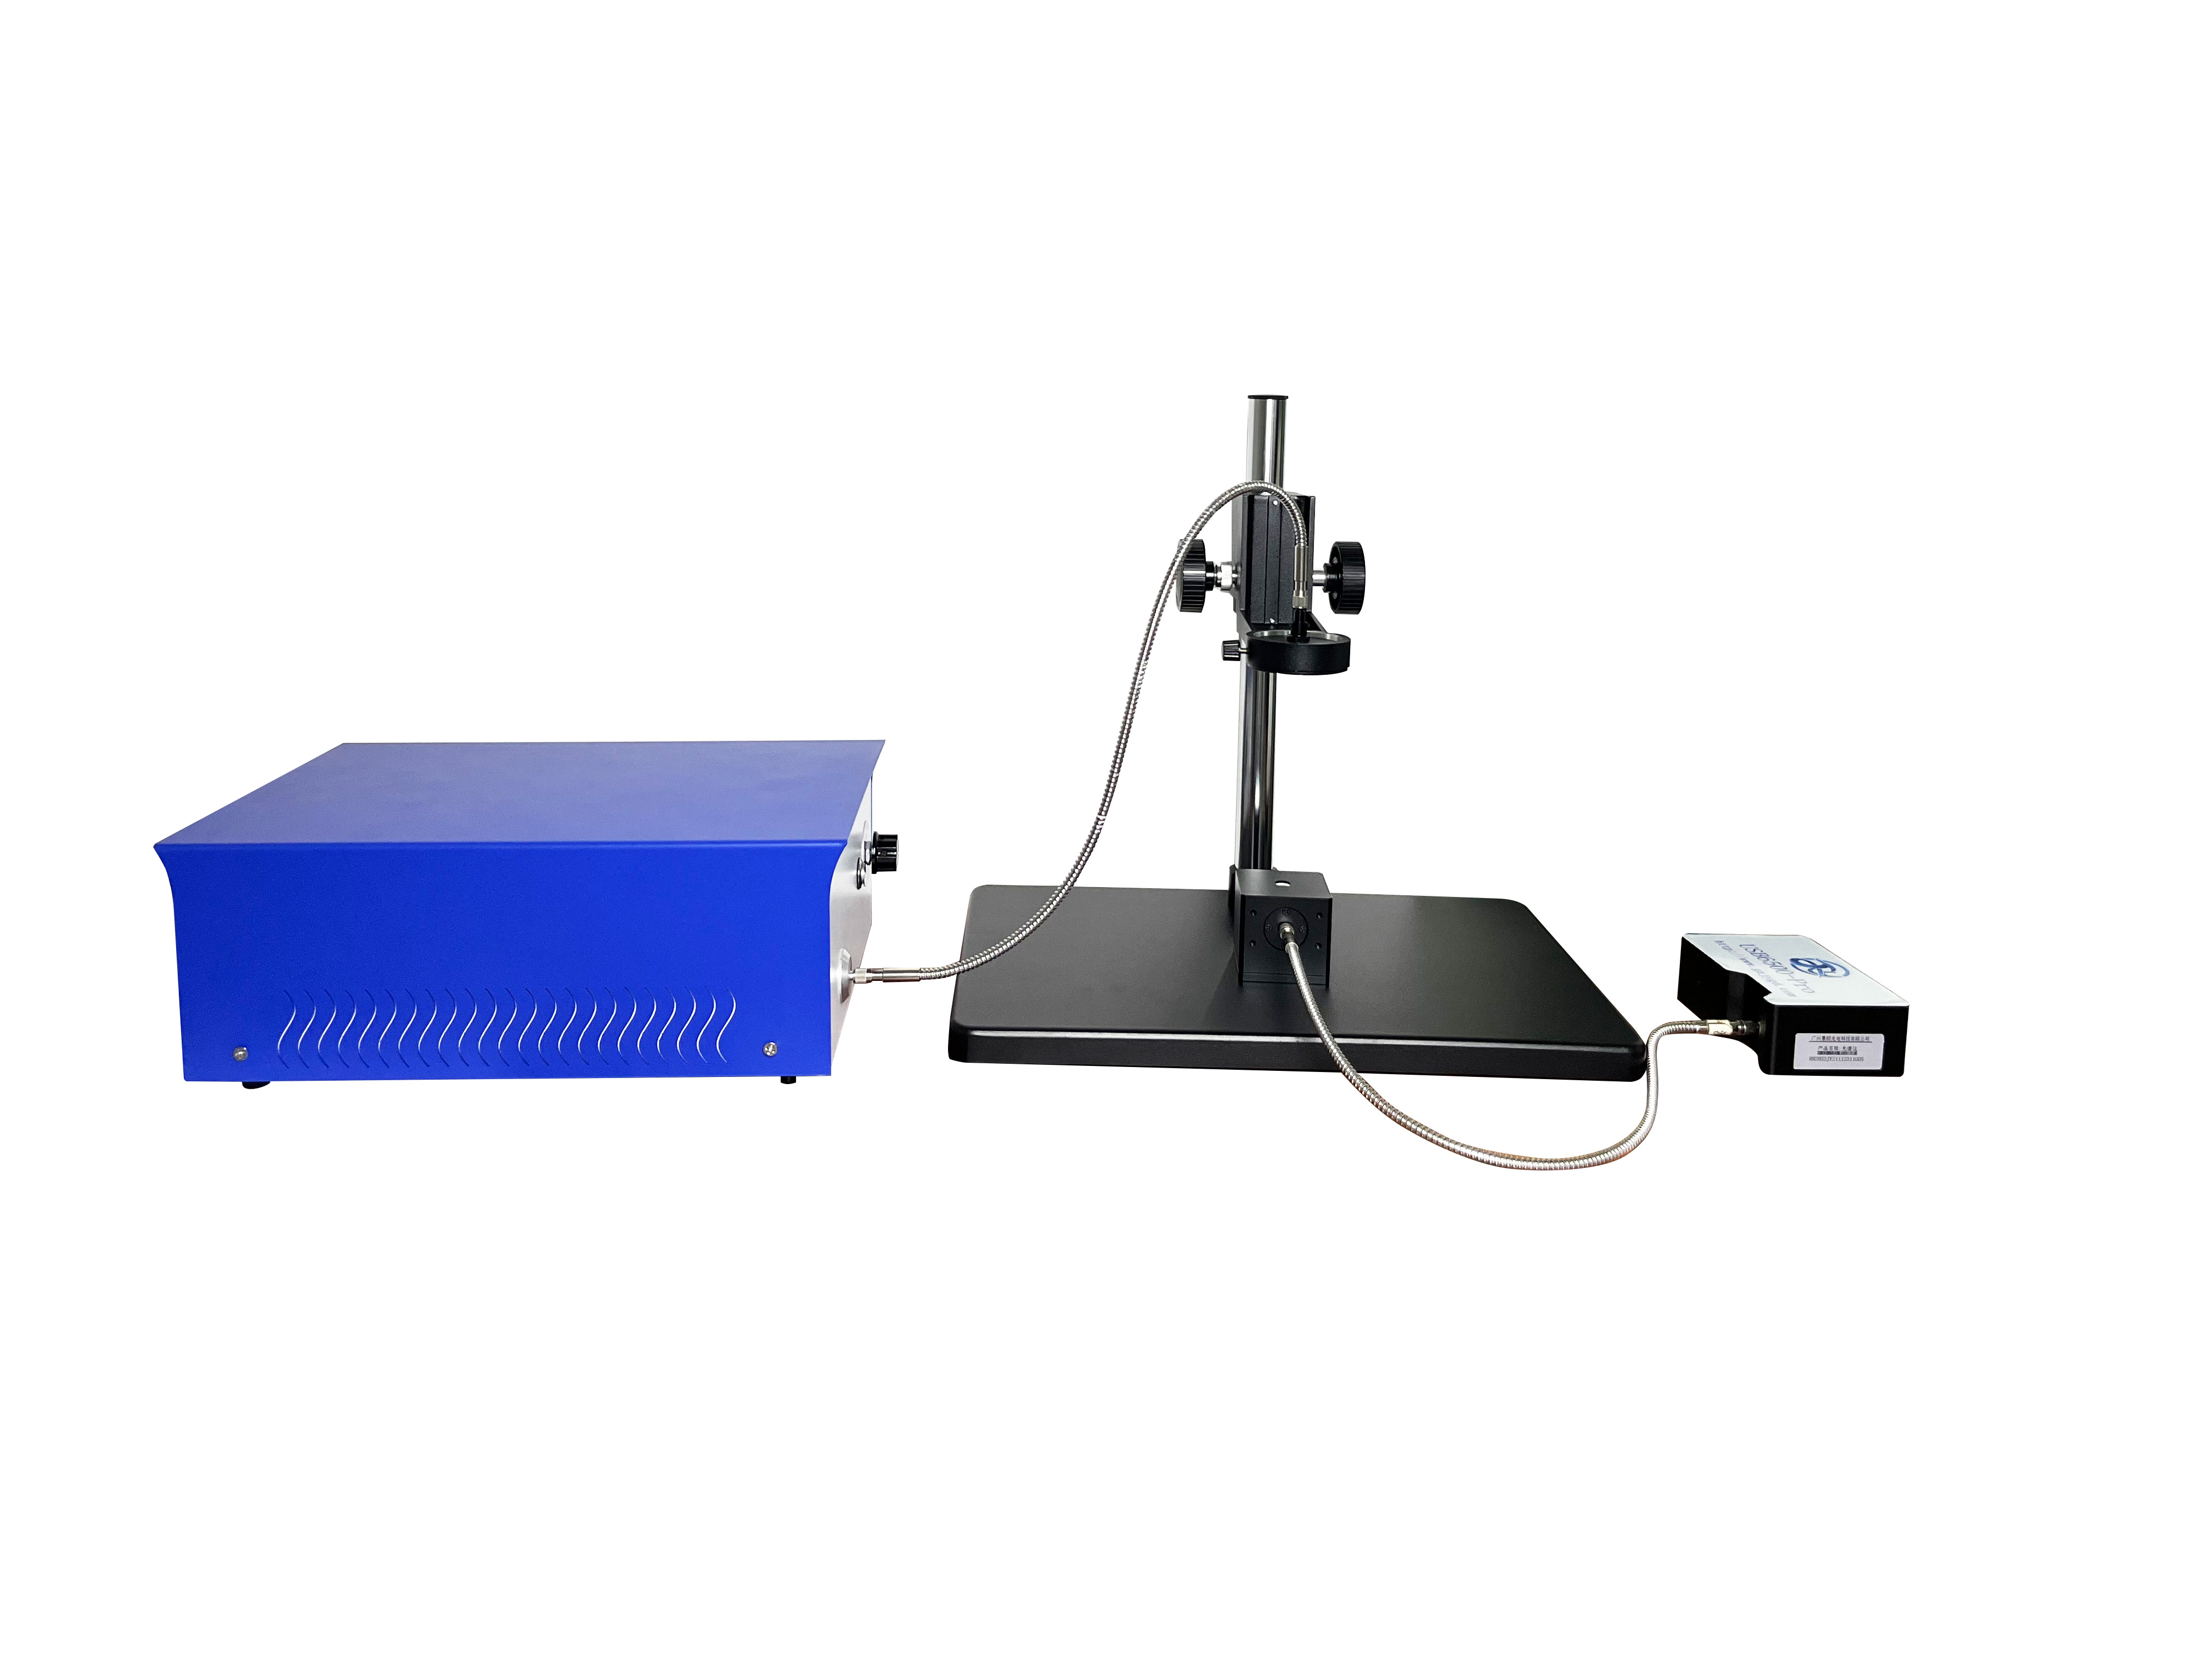
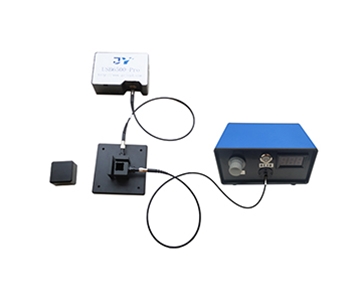
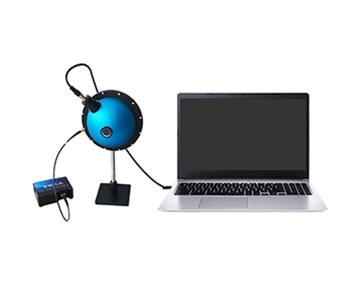
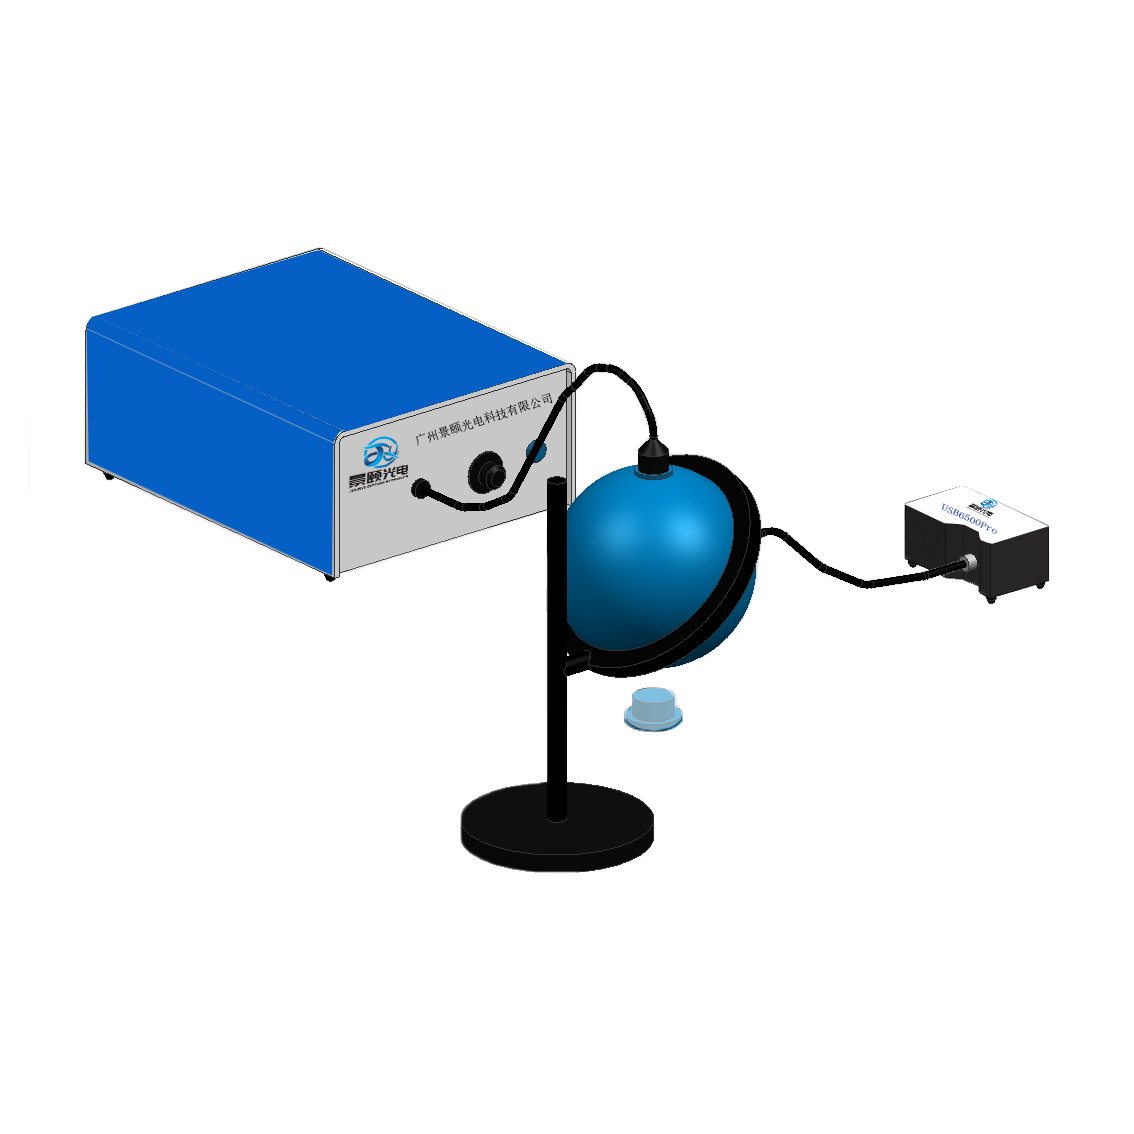
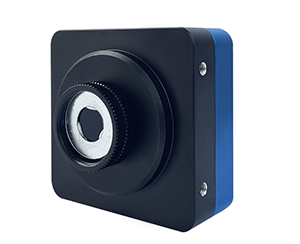
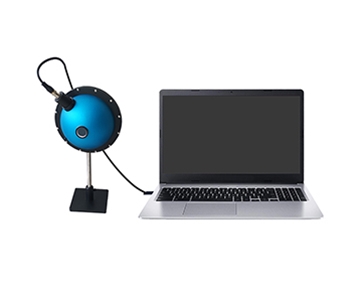
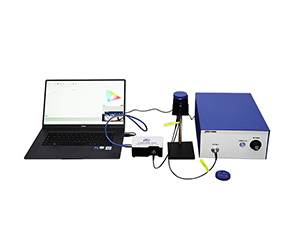
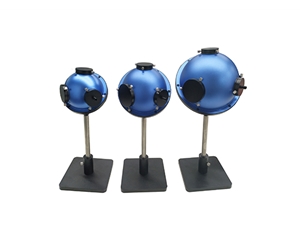
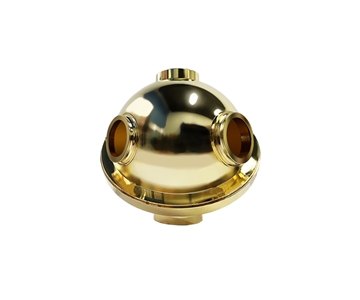
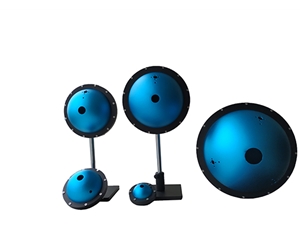
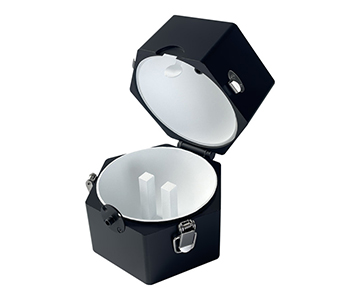
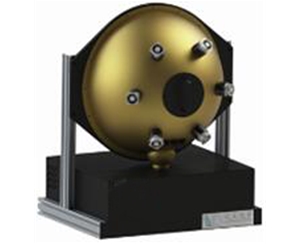
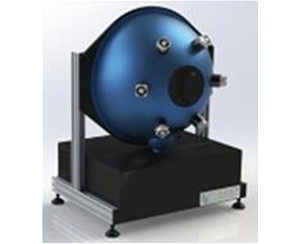
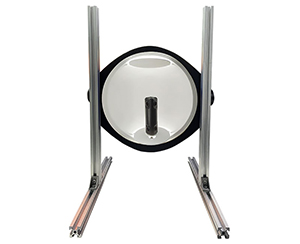
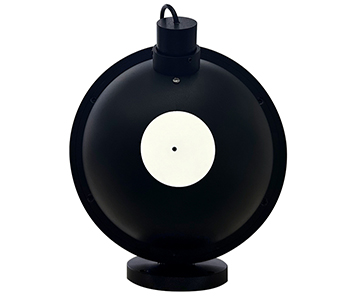
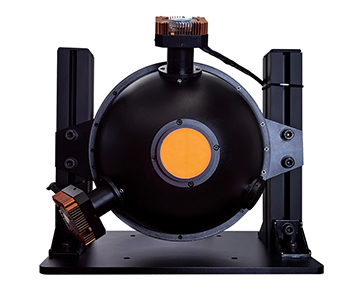
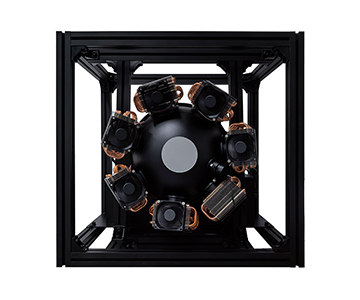
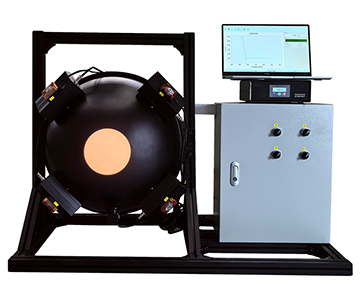
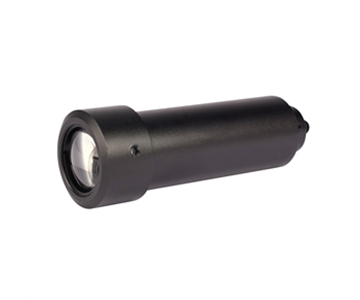
A broadband source illuminates the sample. Transmitted light is collected by an integrating sphere (reflectance >98%) or fiber, dispersed by a grating, and detected simultaneously across all wavelengths by a 1024/2048‑pixel photodiode array. The system automatically subtracts dark background.
Transmittance T(λ) = [I_sample(λ) / I_reference(λ)] × 100%
I_reference = measured without sample; I_sample = with sample. Ambient stray light rejection is built in.
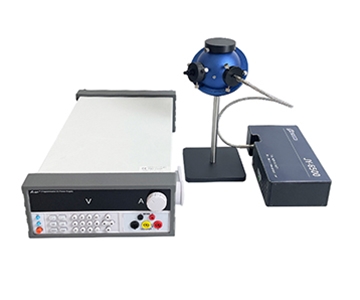
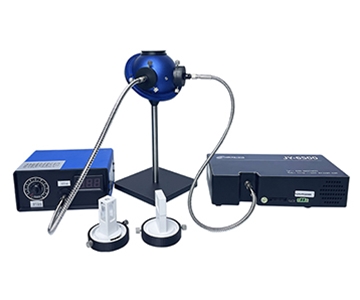
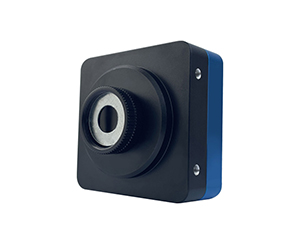
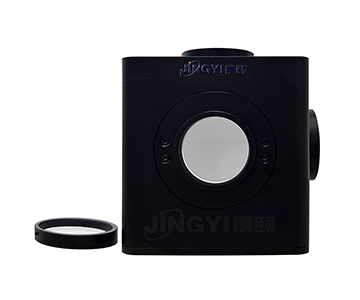
2.2 Optical Core Components
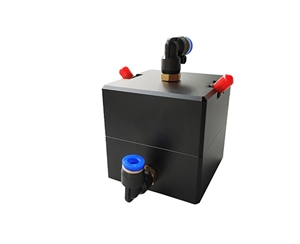
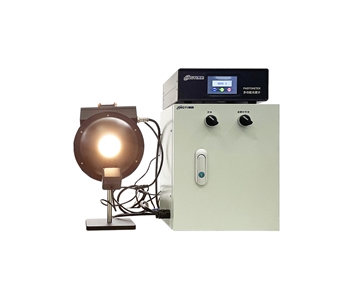
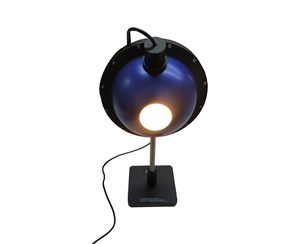
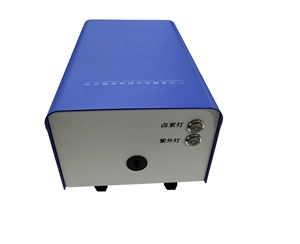
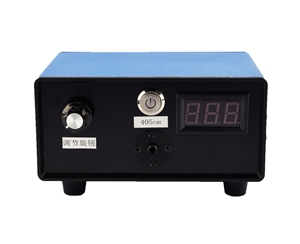
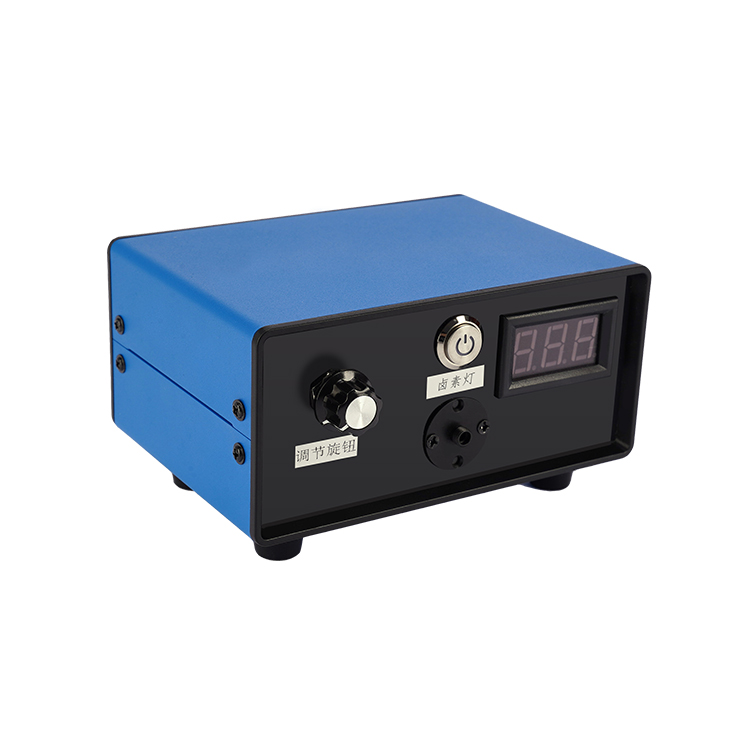
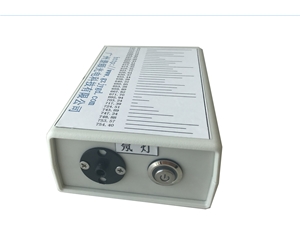
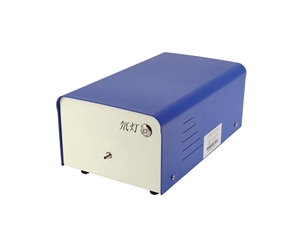
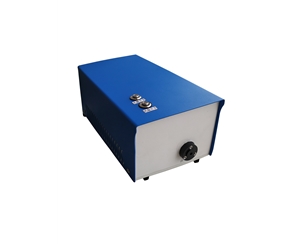
Light source combination: Halogen / deuterium / gas‑halogen (250–2500nm). Wavelength calibration via Hg and Ne lamps (characteristic lines) → wavelength accuracy <1nm, repeatability 0.2nm.
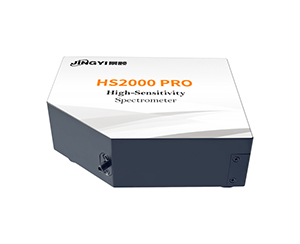
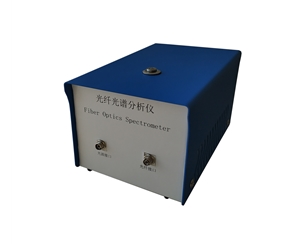
Spectrometer: Planar grating + linear array detector, millisecond full‑spectrum acquisition.
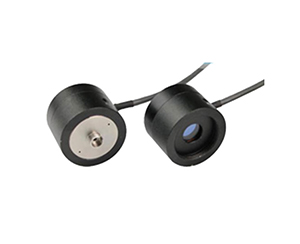
Illumination/collection: 8° or normal incidence; integrating sphere coating >98% reflectance minimizes surface texture effects.
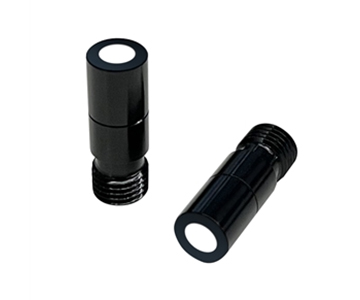
Spot size adjustment: φ0.8mm–φ5mm via objective or fiber coupling; micro‑spot φ60μm on显微 model.
2.3 Model Comparison Table
| Series |
Wavelength |
Spot |
Sampling |
Repeatability |
Key Feature |
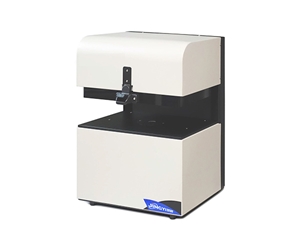
| Basic |
400–1000nm |
φ3mm |
<1s |
≤1% |
Transmittance + CIE color |
| Broadband |
360–1000nm |
φ0.8mm |
<1s |
≤1% |
UV extension, 2048px |
| IR‑Enhanced |
400–1700nm |
φ9mm |
<1s |
– |
Absorbance + transmittance dual mode |
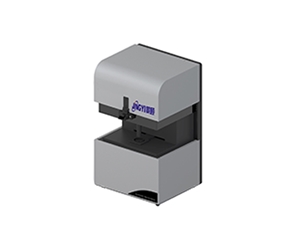
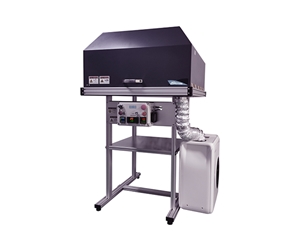
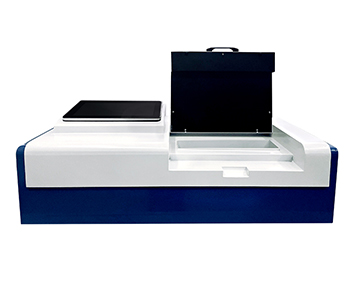
| Fully Automatic |
250–2500nm |
φ5mm |
<1s |
– |
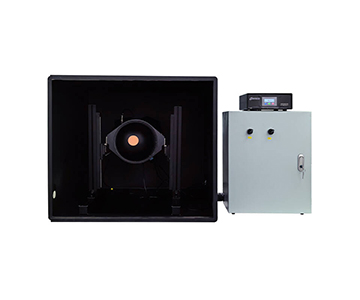
Gas‑halogen source, auto stage |
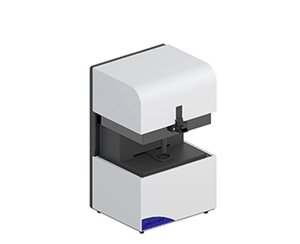
| Curved‑Surface |
400–1100nm |
– |
≤0.8s |
<1% |
Radially symmetric / non‑planar |
| Micro‑Spot |
400–1000nm |
≤φ1mm |
<1s |
≤0.2% |
Dual‑stage, objective focusing |
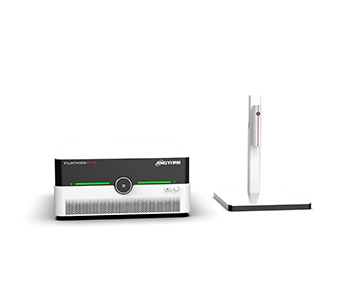
| Fiber‑Optic |
400–1000nm |
– |
<1s |
– |
Fiber end‑face + image capture |
3. Industry Applications & Solutions
| Industry |
Object |
Process |
Technical Core |
Value |
| Optics manufacturing |
Filters, lenses, windows |
Post‑coating 100% inspection |
400–1000nm full spectrum, dark subtraction |
Reduce coating uniformity rejects |
| Photovoltaics |
PV glass, AR coating |
Incoming & outgoing |
250–2500nm, gas‑halogen source |
Improve encapsulation transmittance match |
| Plastic laser welding |
Modified/injection‑molded parts, tubes |
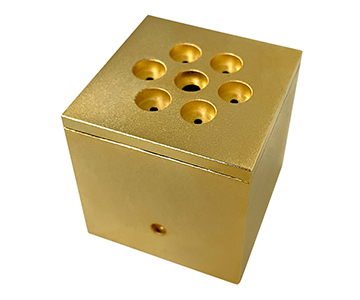
Pre‑weld 100% scan |
980nm band, multi‑point / full‑field |
Quantify transmittance to optimize weld window |
| Automotive electronics |
Lamps, dashboard films, mirrors |
In‑line |
Curved non‑planar, radial clamping |
Avoid material‑driven weld defects |
| Display panels |
LCD/OLED, touch panels |
Module transmittance spot check |
φ60μm micro‑area uniformity |
Eliminate edge curvature error |
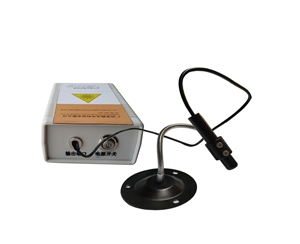
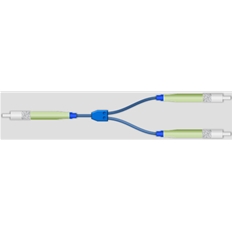
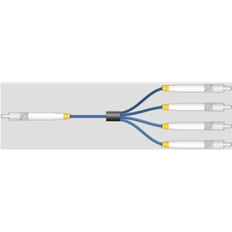
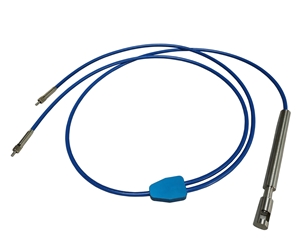
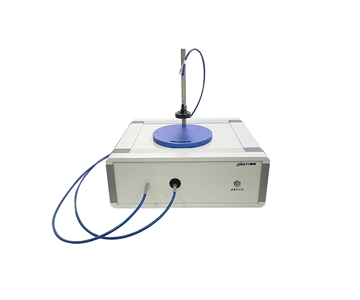
| Fiber optics |
Fiber bundles, light guides |
Finished product |
380–1000nm real‑time curve + end‑face image |
Detect broken fibers / aging |
4. Standards Compliance & Measured Performance Beyond Spec
4.1 Direct Alignment with International Standards
| Standard |
Requirement |
This System Performance |
| ISO 8980-3 (progressive lens transmittance) |
Repeatability ≤1% |
≤1% (basic) / ≤0.5% (curved auto) – exceeds |
| ASTM F659-10 (ski goggles, IR transmittance) |
780–2000nm coverage |
IR‑extended model covers to 2500nm |
| EN 166:2001 + EN 170:2002 (UV transmittance) |
315–380nm UV band |
360nm start (customizable down to 250nm) |
| GB/T 10810.3-2006 (lens transmittance) |
380–780nm, ±2% tolerance |
360–1000nm, accuracy <1% |
4.2 Field Validation – Beyond General Metrology Norms
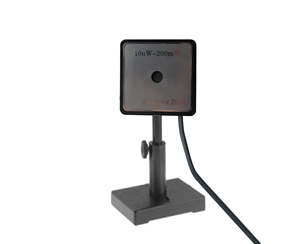
Per JJF 1228-2009 (transmittance meter calibration), wavelength error ≤2nm. This system achieves <1nm error and 0.2nm repeatability – significantly tighter. In a plastic laser welding use case (980nm, same as weld laser), the 0.01% detection limit resolves 0.3% transmittance differences caused by modifier formulation changes, precisely defining the weldability window.
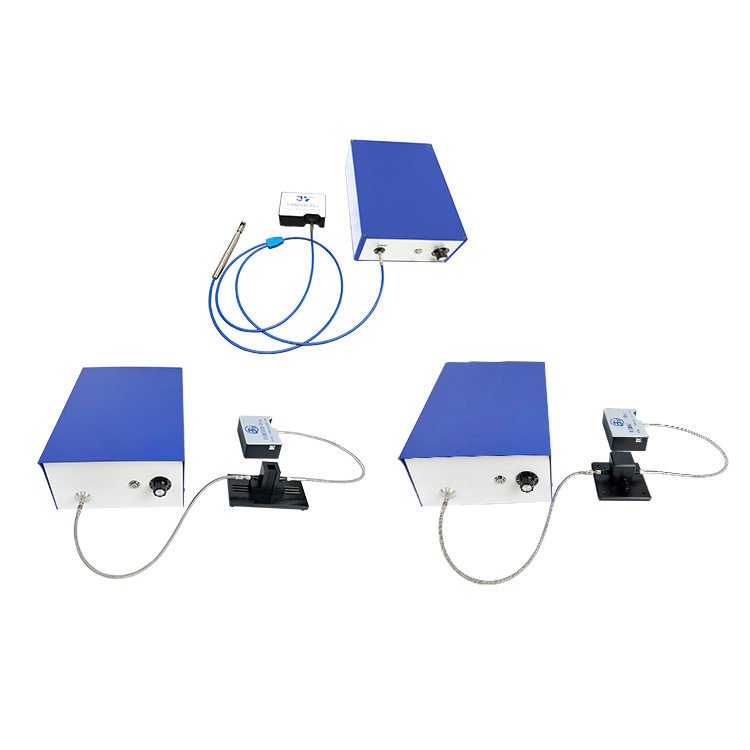
5. Selection Guide: Decision Tree Based on Sample Geometry & Process Constraints
Step 1: Sample Form
Flat / sheet / film → go to Step 2
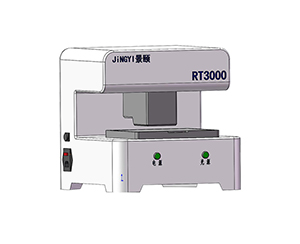
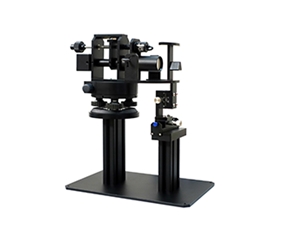
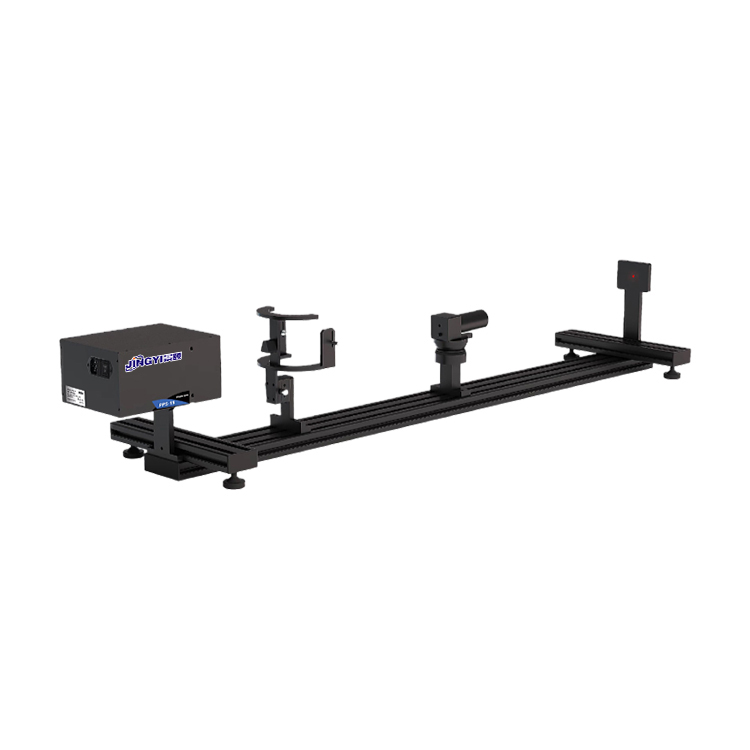
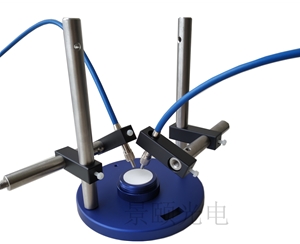
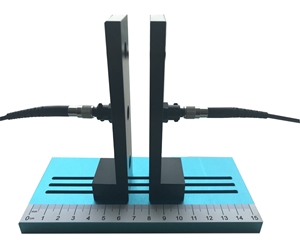
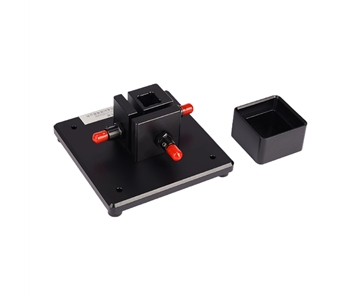
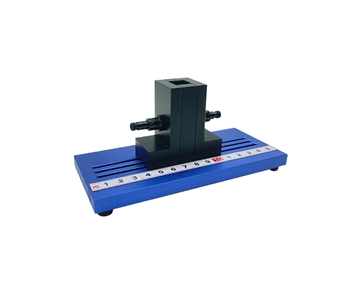
Curved / cylindrical / tubular → Curved‑Surface series (JY-T980-R). Manual/auto based on length (≤150mm or ≤450mm) and automation need.
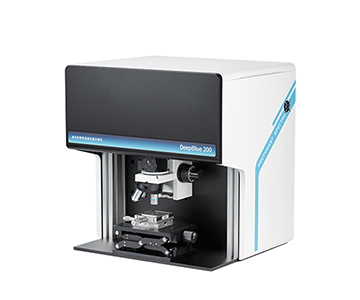
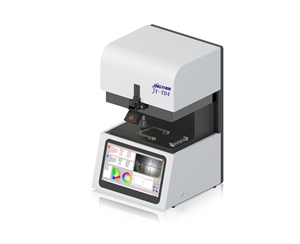
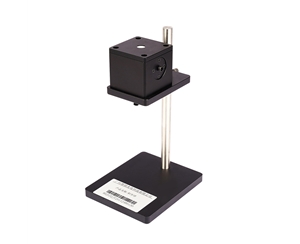
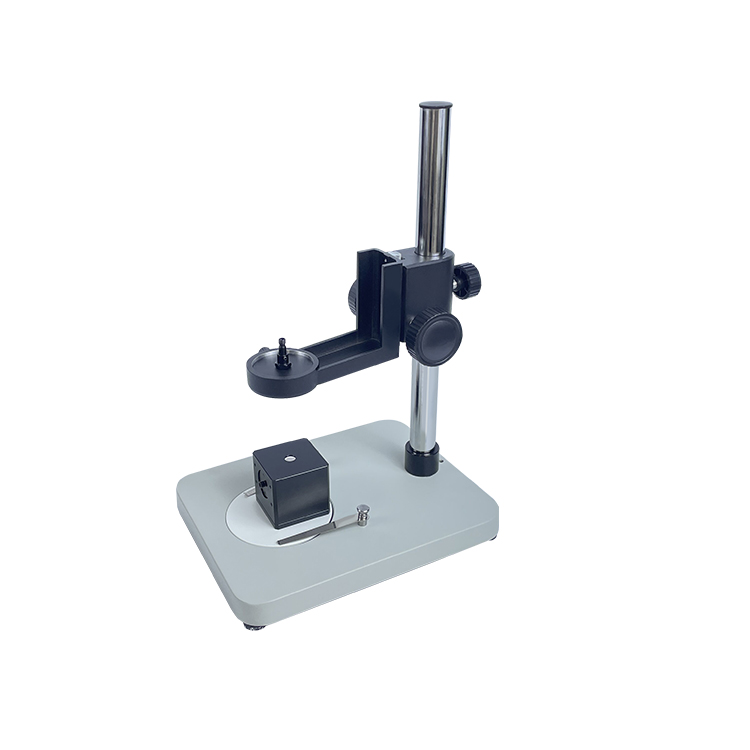
Micro‑area (<1mm) or curved lens → Micro‑Spot model (JY-T04)
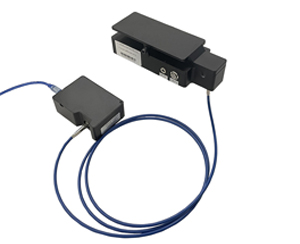
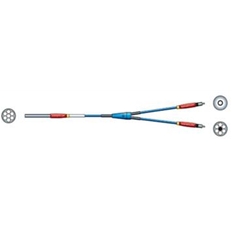
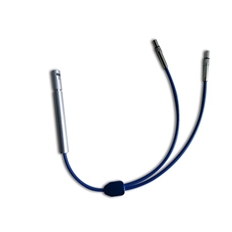
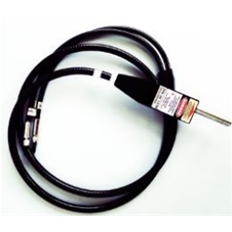
Fiber optic bundle → Fiber‑Optic model (JY-QT02)
Step 2: Wavelength Requirement
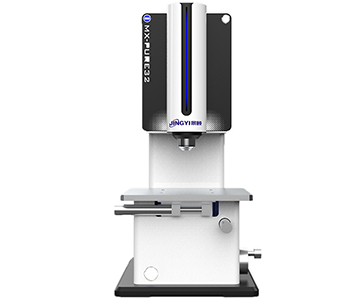
Visible only (400–700nm) → Basic model
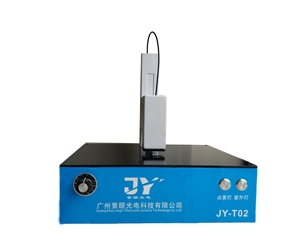
Need UV (360–400nm) → Broadband (JY-T02 360‑1000nm)
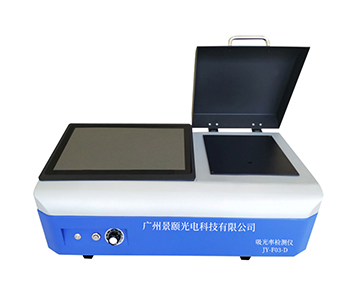
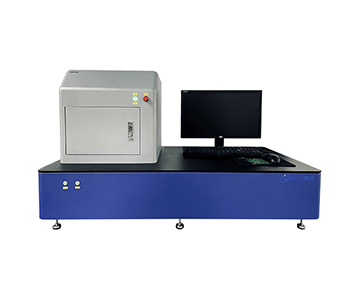
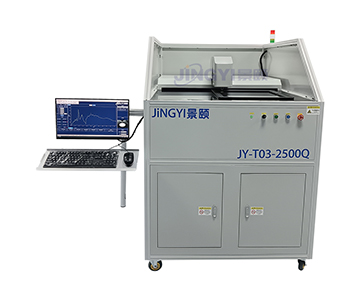
Need NIR (>1000nm) → IR‑Enhanced (JY-F03-D) or Fully Automatic (JY-T03-2500Q)
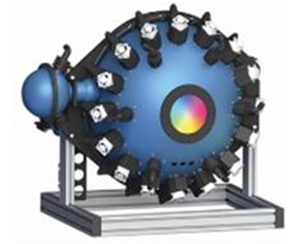
Step 3: Inspection Mode
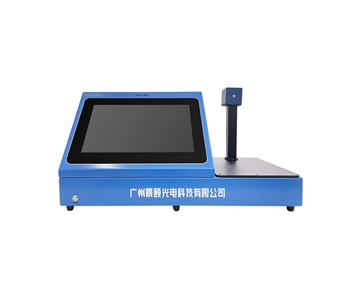
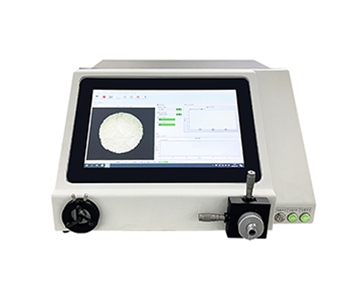
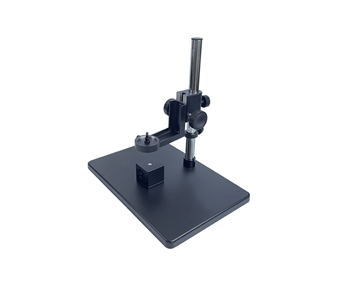
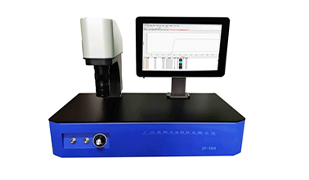
Single‑point spot check → Benchtop universal
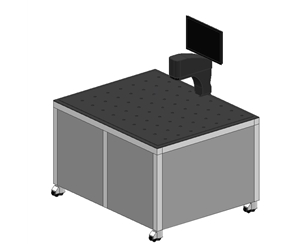
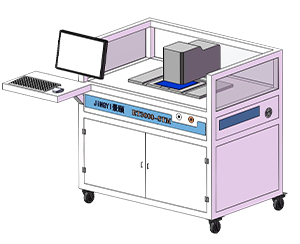
Multi‑point / full‑field → Full‑field model (JY-T980)
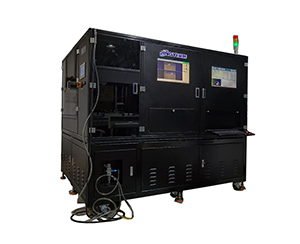
Fully automated batch feed → Automatic model with motorized stage
Configuration Recommendations
| Typical Need |
Recommended Series |
Key Configuration |
| Lab, multi‑material small batches |
JY-T02 (400-1000nm) |
Integrating sphere + fiber + halogen |
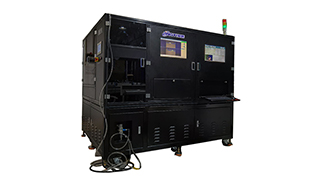
| PV glass production line 100% inspection |
JY-T03-2500Q |
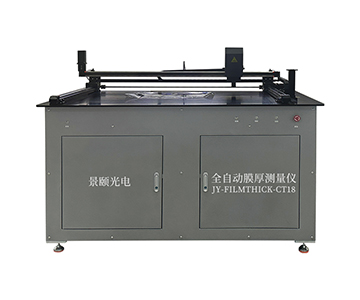
Gas‑halogen + auto stage + custom large fixture |
| Plastic weld incoming 100% check |
JY-T980-Rauto |
980nm source + mechanical auto adjust + OK/NG alarm |
| Curved auto parts pre‑weld |
JY-T980-Rpro |
Manual adjust + curved stage, max 450mm length |
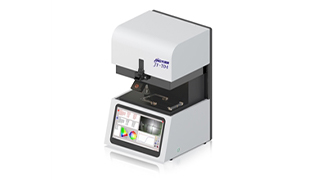
| Optical coating micro‑uniformity |
JY-T04 Micro‑Spot |
5x objective + dual stage + XY chromaticity |
6. Honest Limitations – Where to Evaluate Carefully
Long‑term stability under high temp/humidityOperating range 5–80°C. But after >8h continuous run, halogen lamp intensity may drift ≤1% (filament aging + heat dissipation). For 24/7 lines: configure dual‑source alternating calibration or increase automatic dark subtraction frequency (software supports, but user sets interval).
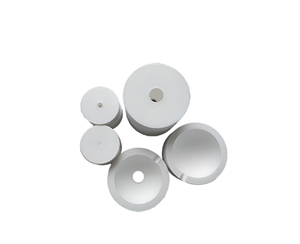
Very large or very small samplesStandard port φ9mm (for absorbance) or spot φ0.8–5mm. Tubular parts >450mm (e.g., automotive sealing strips) – curved manual model max 450mm, but custom extended fixture needed. For <φ60μm transparent layers in semiconductor packages, micro model’s minimum spot is φ60μm – measurable but repeatability may drop above 0.5%. For batch measurement of tiny samples: use mask plate or custom aperture.
Non‑standard wavelengthsStock NIR wavelengths: 850/905/915/940/980nm. Need 1320nm or 1550nm for specialty plastics? Custom source module – lead time +4–6 weeks.
7. Frequently Asked Questions (FAQ)
Q1: For dark plastics or high‑absorption materials (transmittance near 0%), how is accuracy maintained?The system uses a high‑sensitivity 2048‑pixel array and automatic dark subtraction. At T < 0.1%, SNR remains ≥100:1. The 0.01% detection limit means minimum measurable T = 0.01%. Perform an “air calibration” then measure high‑absorption samples – software auto‑adjusts integration time.
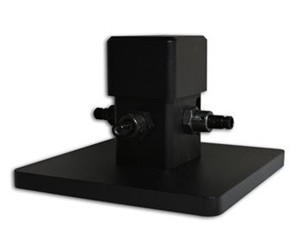
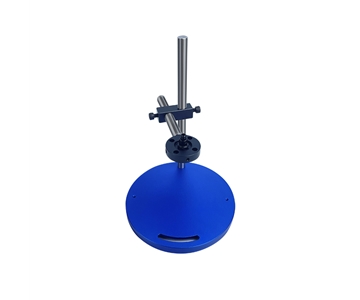
Q2: For curved plastic parts (e.g., cylindrical weld sleeves), is sample destruction required?No. The curved‑surface JY-T980-R series uses a radially symmetric optical path. Rotational clamping allows direct measurement of the outer cylindrical surface. For inner walls or freeform surfaces: custom multi‑DOF adjustment stage or curved sample holder, with normal incidence illumination.
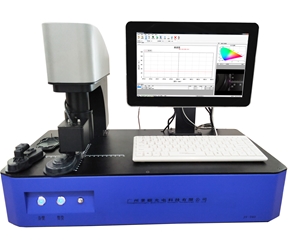
Q3: In full‑field multi‑point inspection, how are regions defined and results traced?Software supports user‑defined rectangular, circular, or polygonal regions – each with an independent ID. Output includes transmittance per region, max/min/mean, plus a test report with timestamp, operator ID, and lot number. Export to Excel/PDF, MES integration ready.
Q4: How do price and maintenance cost differ across models?Basic JY-T02 (400-1000nm) is the entry model – main consumable: halogen lamp (2000h life, ~$40 replacement). Fully automatic broadband JY-T03-2500Q is 3–4x the price due to gas‑halogen source and motorized stage, but gas lamp life is 5000h. Curved manual is in between. Maintenance: periodic wavelength calibration (self‑calibration with built‑in Hg/Ne lamps – no external service) and integrating sphere cleaning.
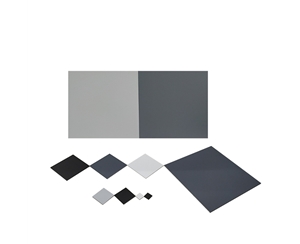
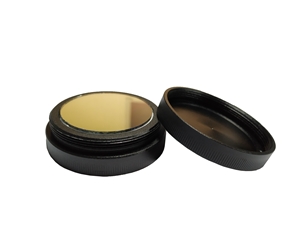
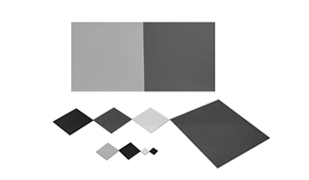
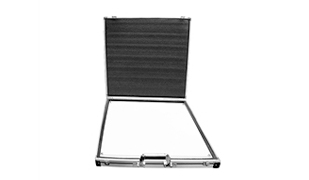
Q5: How can a user independently verify instrument accuracy without factory service?Purchase a certified validation kit (neutral density filters + cut‑off filters with third‑party calibration certificate). Before each batch or weekly: place the validation filter, compare measured vs. certificate values. If deviation exceeds 0.5%, run the software’s “one‑click calibration” (based on internal Hg/Ne lines, automatically corrects wavelength and intensity). Calibration logs are saved for quality audit – no on‑site service needed.
8. Future Trends & Conclusion
Trend 1 – Multi‑modal (Transmittance + Color + Thickness)Laser welding correlation studies show transmittance and color (Lab values) are coupled. The system now outputs CIE parameters (xy, XYZ, Lab, dominant wavelength, saturation) – simultaneously evaluating transmittance and appearance color difference.
Trend 2 – AI‑Assisted Process Window PredictionA model linking historical batch transmittance data to measured weld strength suggests optimal transmittance ranges (e.g., 82%–87%) and automatically flags batches outside control limits. Database interface is预留 in the software.
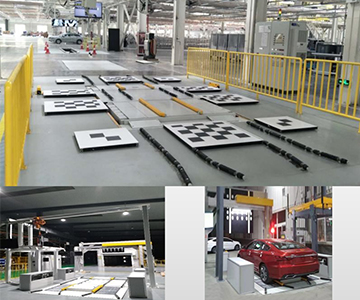
Trend 3 – In‑Line Fully Automated 100% Inspection Becomes StandardIntegration with air‑float stages, auto load/unload, and PLC‑linked OK/NG rejection transforms the instrument from a lab tool into an MES node. A group standard for “Online total transmittance measurement of plastics” is under development.
ConclusionFull‑spectrum fast transmittance spectroscopy has evolved from a laboratory evaluation tool to a necessary node for yield control in precision manufacturing. A solution that is standards‑compliant, covers UV‑to‑NIR, and supports curved and micro‑samples helps B2B manufacturers reduce weld defects, display non‑uniformity, and PV efficiency losses caused by material transmittance variation. When selecting, prioritize sample geometry, process wavelength, and inspection takt time – then establish an internal traceable verification procedure using certified validation standards.
9. About This Guide
Data Sources: SEMI 2025 Worldwide Optical Inspection Equipment Market Report; Chinese Optical Society 2024 White Paper; in‑house validation reports (n=127 samples across 4 material types); GB/T and ISO public standards.
Author: [To be filled with real name], Senior Optical Metrology Engineer, [Company Name]. 12 years in industrial precision measurement.
Disclosure: [Company Name] manufactures transmittance measurement systems described in this guide. Technical assessments are based on published specifications and independent lab verification data. No third‑party brand compensation was received.
Objective Statement: This content is for educational and technical evaluation. Final equipment selection should always include independent proof‑of‑concept validation under your specific process conditions.
Last Updated: June 2026
For detailed specifications, custom fixture drawings, and third‑party calibration certificate samples, search “[BrandName] transmittance measurement system technical data package” or visit the technical library.