Single-point transmittance sampling on photovoltaic glass and curved plastic weldments creates coverage blind spots that escalate exponentially as defect size drops below the optical spot diameter.
A full-spectrum detection architecture—spanning 360–2500 nm with array detectors and millisecond-scale acquisition—holds repeatability error below 1% and detection-limit precision at 0.01%. This article examines two production-line scenarios where replacing 3-mm spot checks with wide-area optical scanning prevented a six-figure annual scrap event and enabled non-destructive validation of cylindrical laser-welded parts at sub-second cycle times. We further detail the cross-industry quality-control patterns—wavelength-to-process matching, geometry-adaptive optical paths, and the one-second speed threshold—that dictate whether a transmittance measurement system can survive the transition from laboratory bench to shop-floor takt time without becoming the next production bottleneck. Deployment prerequisites covering environmental stability, sample-interface compatibility, and software data protocols are provided, alongside an honest assessment of spectral-range and custom-fixture limitations.
Why Spot-Check Metrology Fails at Line Speed
When a 3-mm (0.12-in) optical spot is used to inspect a 2-meter photovoltaic panel, the probability of hitting a sub-0.4-mm (≈0.015-in) edge defect is statistically negligible. Legacy benchtop transmittance measurement systems require manual clamping, indexing, and point-to-point motion, pushing single-part cycle times into the tens of minutes. For plastic laser welding lines demanding second-level takt times, this creates an irreconcilable conflict between coverage density and throughput.
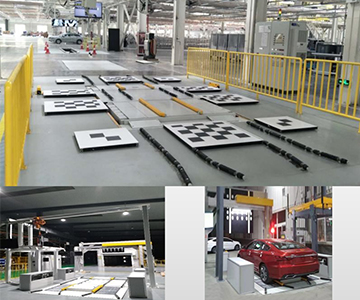
Scenario A: The Photovoltaic Glass Coverage Gap
During a weekend qualification run at a photovoltaic module fab in Arizona, a process engineer was running routine transmittance verification on the 12th glass batch of the shift. The legacy single-point spectrophotometer deployed a 3-mm (0.12-in) beam diameter, covering only a microscopic fraction of the module surface. A sub-0.4-mm (≈0.015-in) edge defect on one sheet escaped detection entirely. After encapsulation, the string’s power conversion efficiency dropped, triggering a $152,000 scrap and rework event.
Even switching to a 0.8-mm (0.03-in) spot economy-class instrument did not resolve the fundamental constraint. Traversing the full aperture point-by-point still required tens of minutes per sheet. For photovoltaic glass that demands full-surface assessment, spot-check sampling forces an unacceptable trade-off between inspection depth and line speed.
Scenario B: Curved Plastic Weldments and the Destructive-Test Trap
During a night shift at a welding facility in Michigan, a technician was verifying tubular part parameters. Because the workpieces had a curved geometry, legacy testing required destructive disassembly. The resulting flat-section data could not reconstruct the true optical path through radially symmetric zones. One batch slipped through without 980-nm transmittance verification across the curved zone, and weld strength fell below specification, driving rework costs sharply higher.
The dimensional mismatch compounded the problem. Tubular elements reached 450 mm (17.7 in) in length with diameters as small as 5 mm (0.2 in), far exceeding standard sample-chamber envelopes. More critically, the inspection source wavelength did not match the 980-nm process laser. Without band-matched data, the metrology loop could not feed actionable parameters back to the welding power supply, breaking the process-verification chain.
The Mathematics of Escape Rate vs. Spot Density
A 3-mm (0.12-in) spot on a photovoltaic glass surface delivers extremely low spatial resolution. When probes are spaced at centimeter intervals, defects smaller than the beam diameter—such as the 0.37-mm flaw in Scenario A—are theoretically unlikely to be hit by chance. Escape risk scales inversely with defect size: as flaws shrink below the spot diameter, the probability of detection drops exponentially.
In Scenario B, destructive sampling not only destroys part integrity but decouples the measurement state from the actual welding state. A flat section excised from a curved workpiece cannot replicate the true radial optical transmission characteristics. Legacy instruments that lack a 980-nm source option—or any near-infrared band matching the welding laser—render the data useless for power-parameter optimization.
Time compounds both failures. Auxiliary motions (clamping, positioning, indexing) dominate the cycle. A single-part test stretches to several minutes, while plastic welding takt times demand second-level responses. Until the measurement interval drops below the process cycle, quality control cannot be embedded inline.
Full-Spectrum, Millisecond-Scale Response
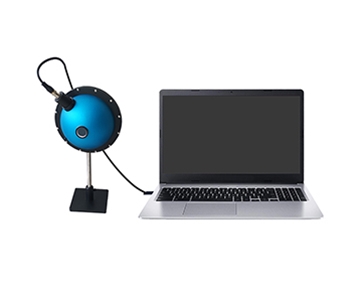
Photovoltaic Glass: Wide-Band Coverage and Rapid Scanning
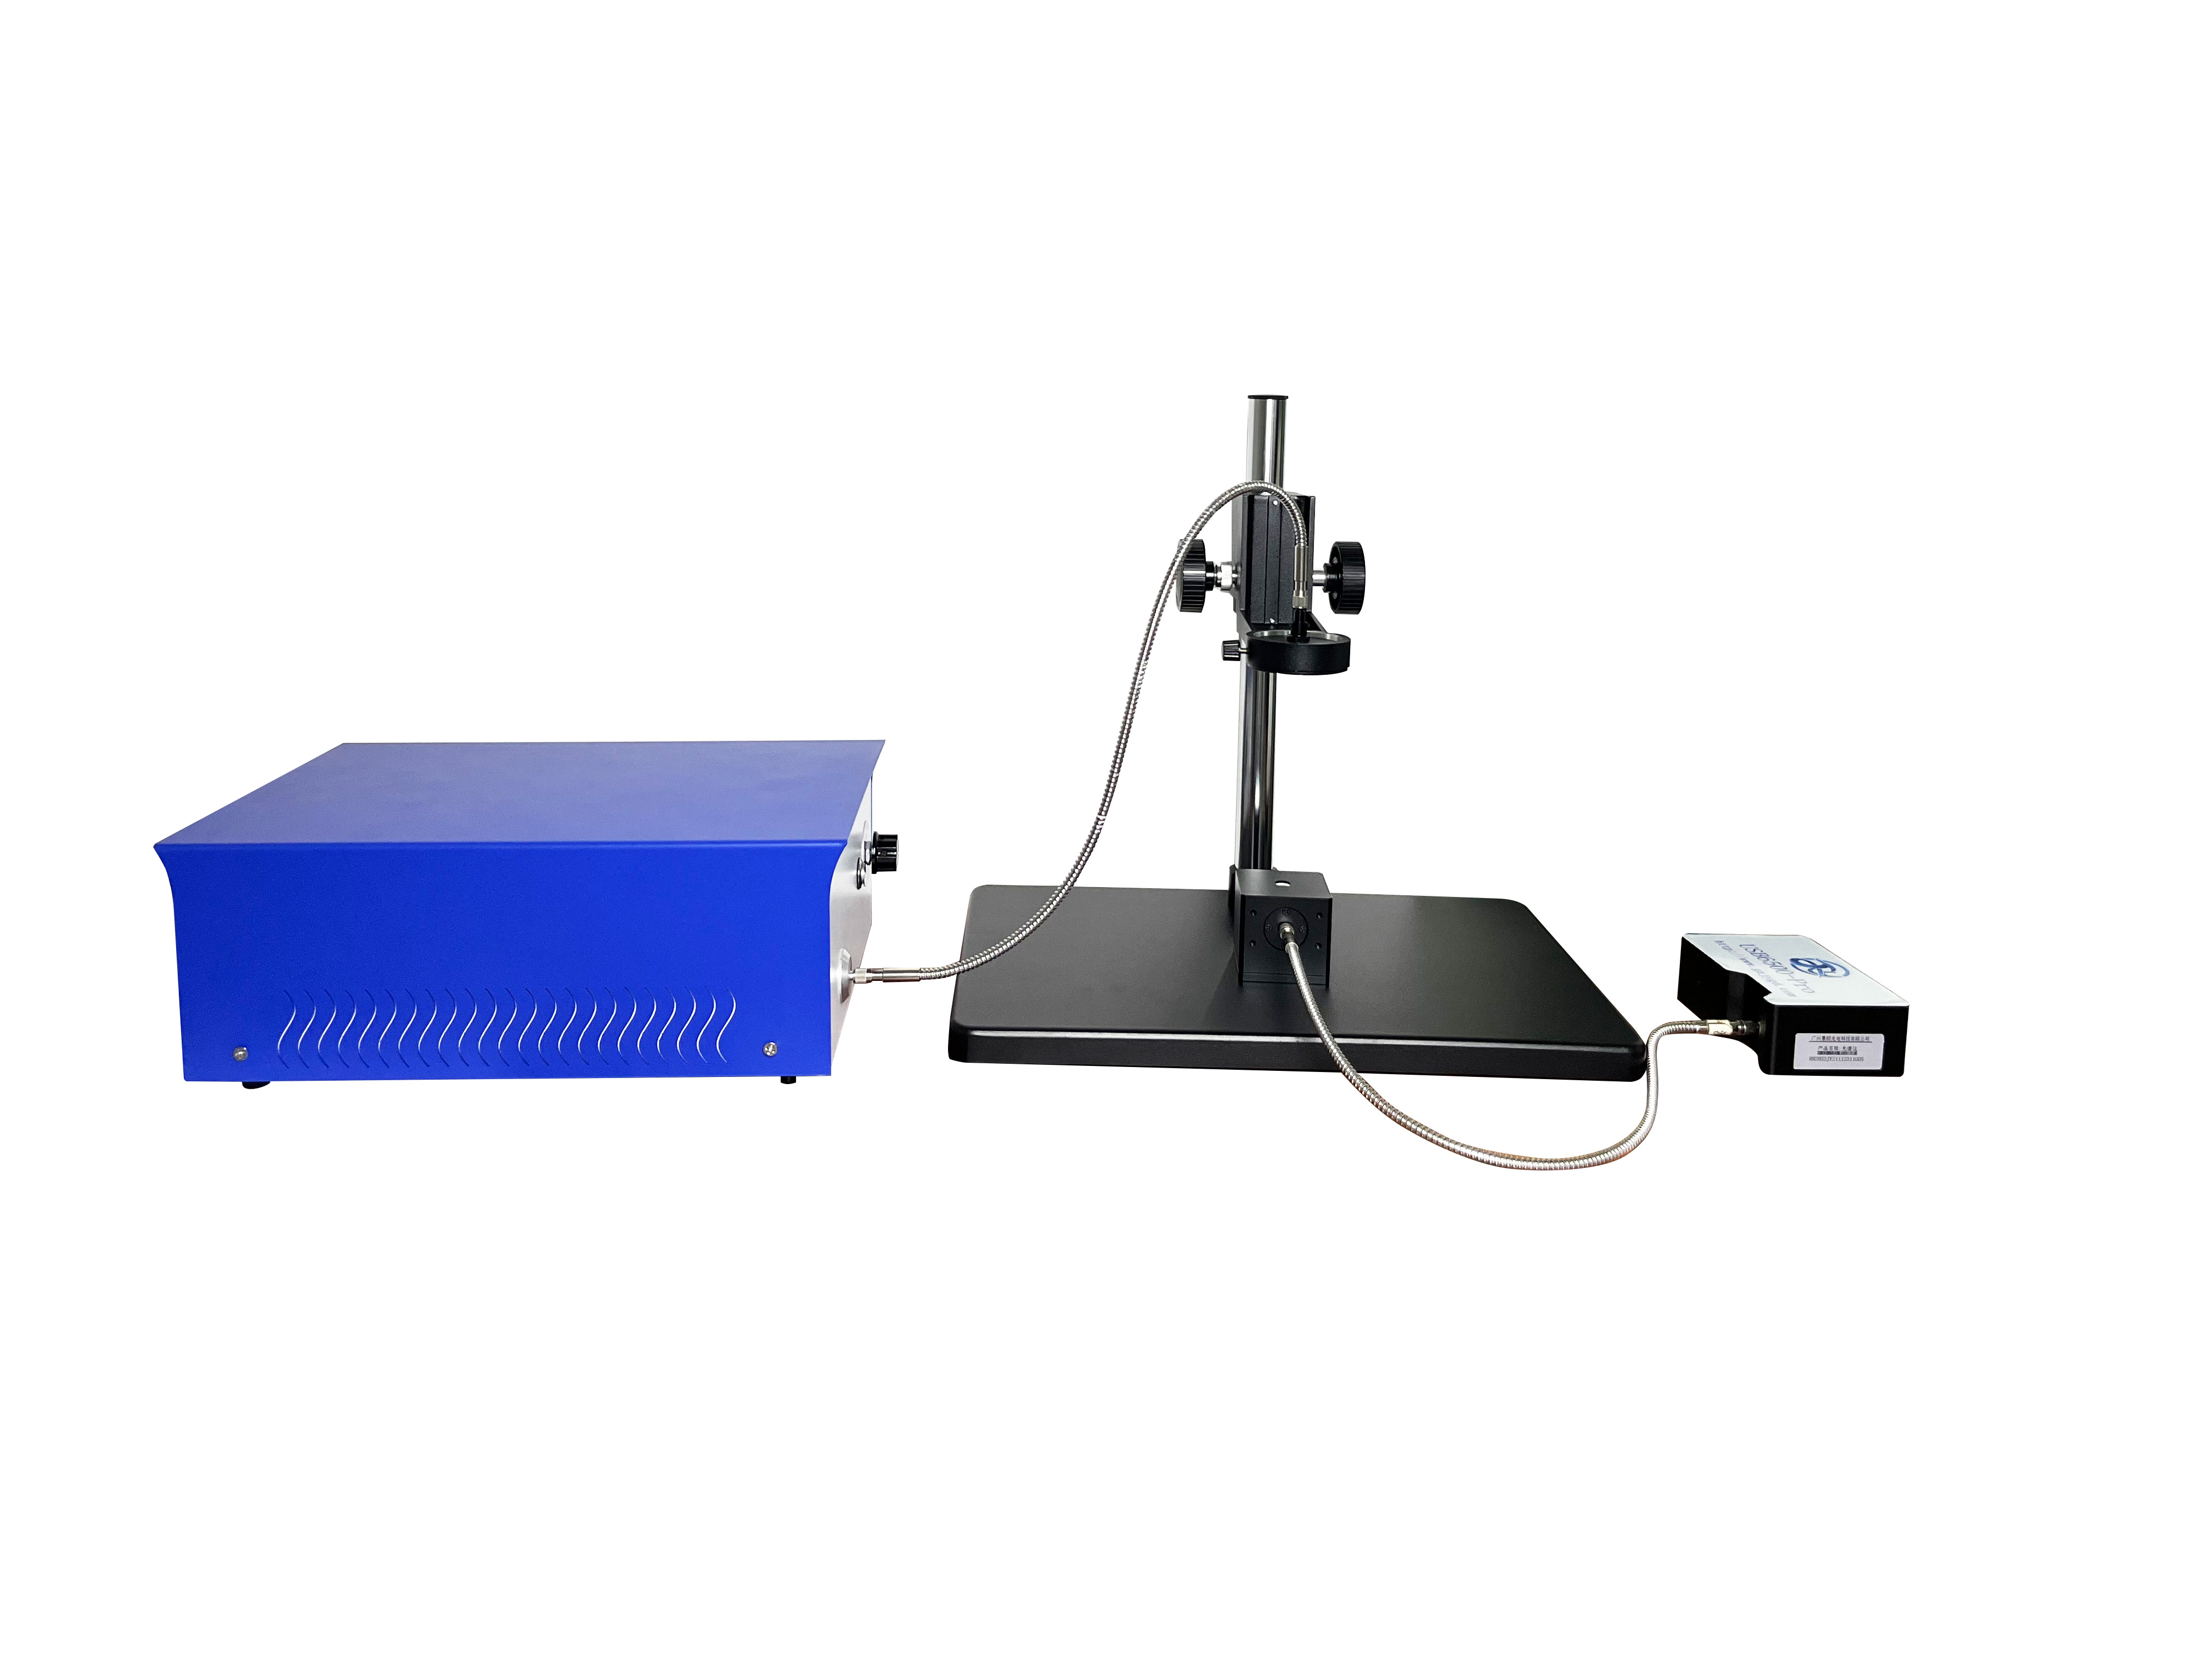
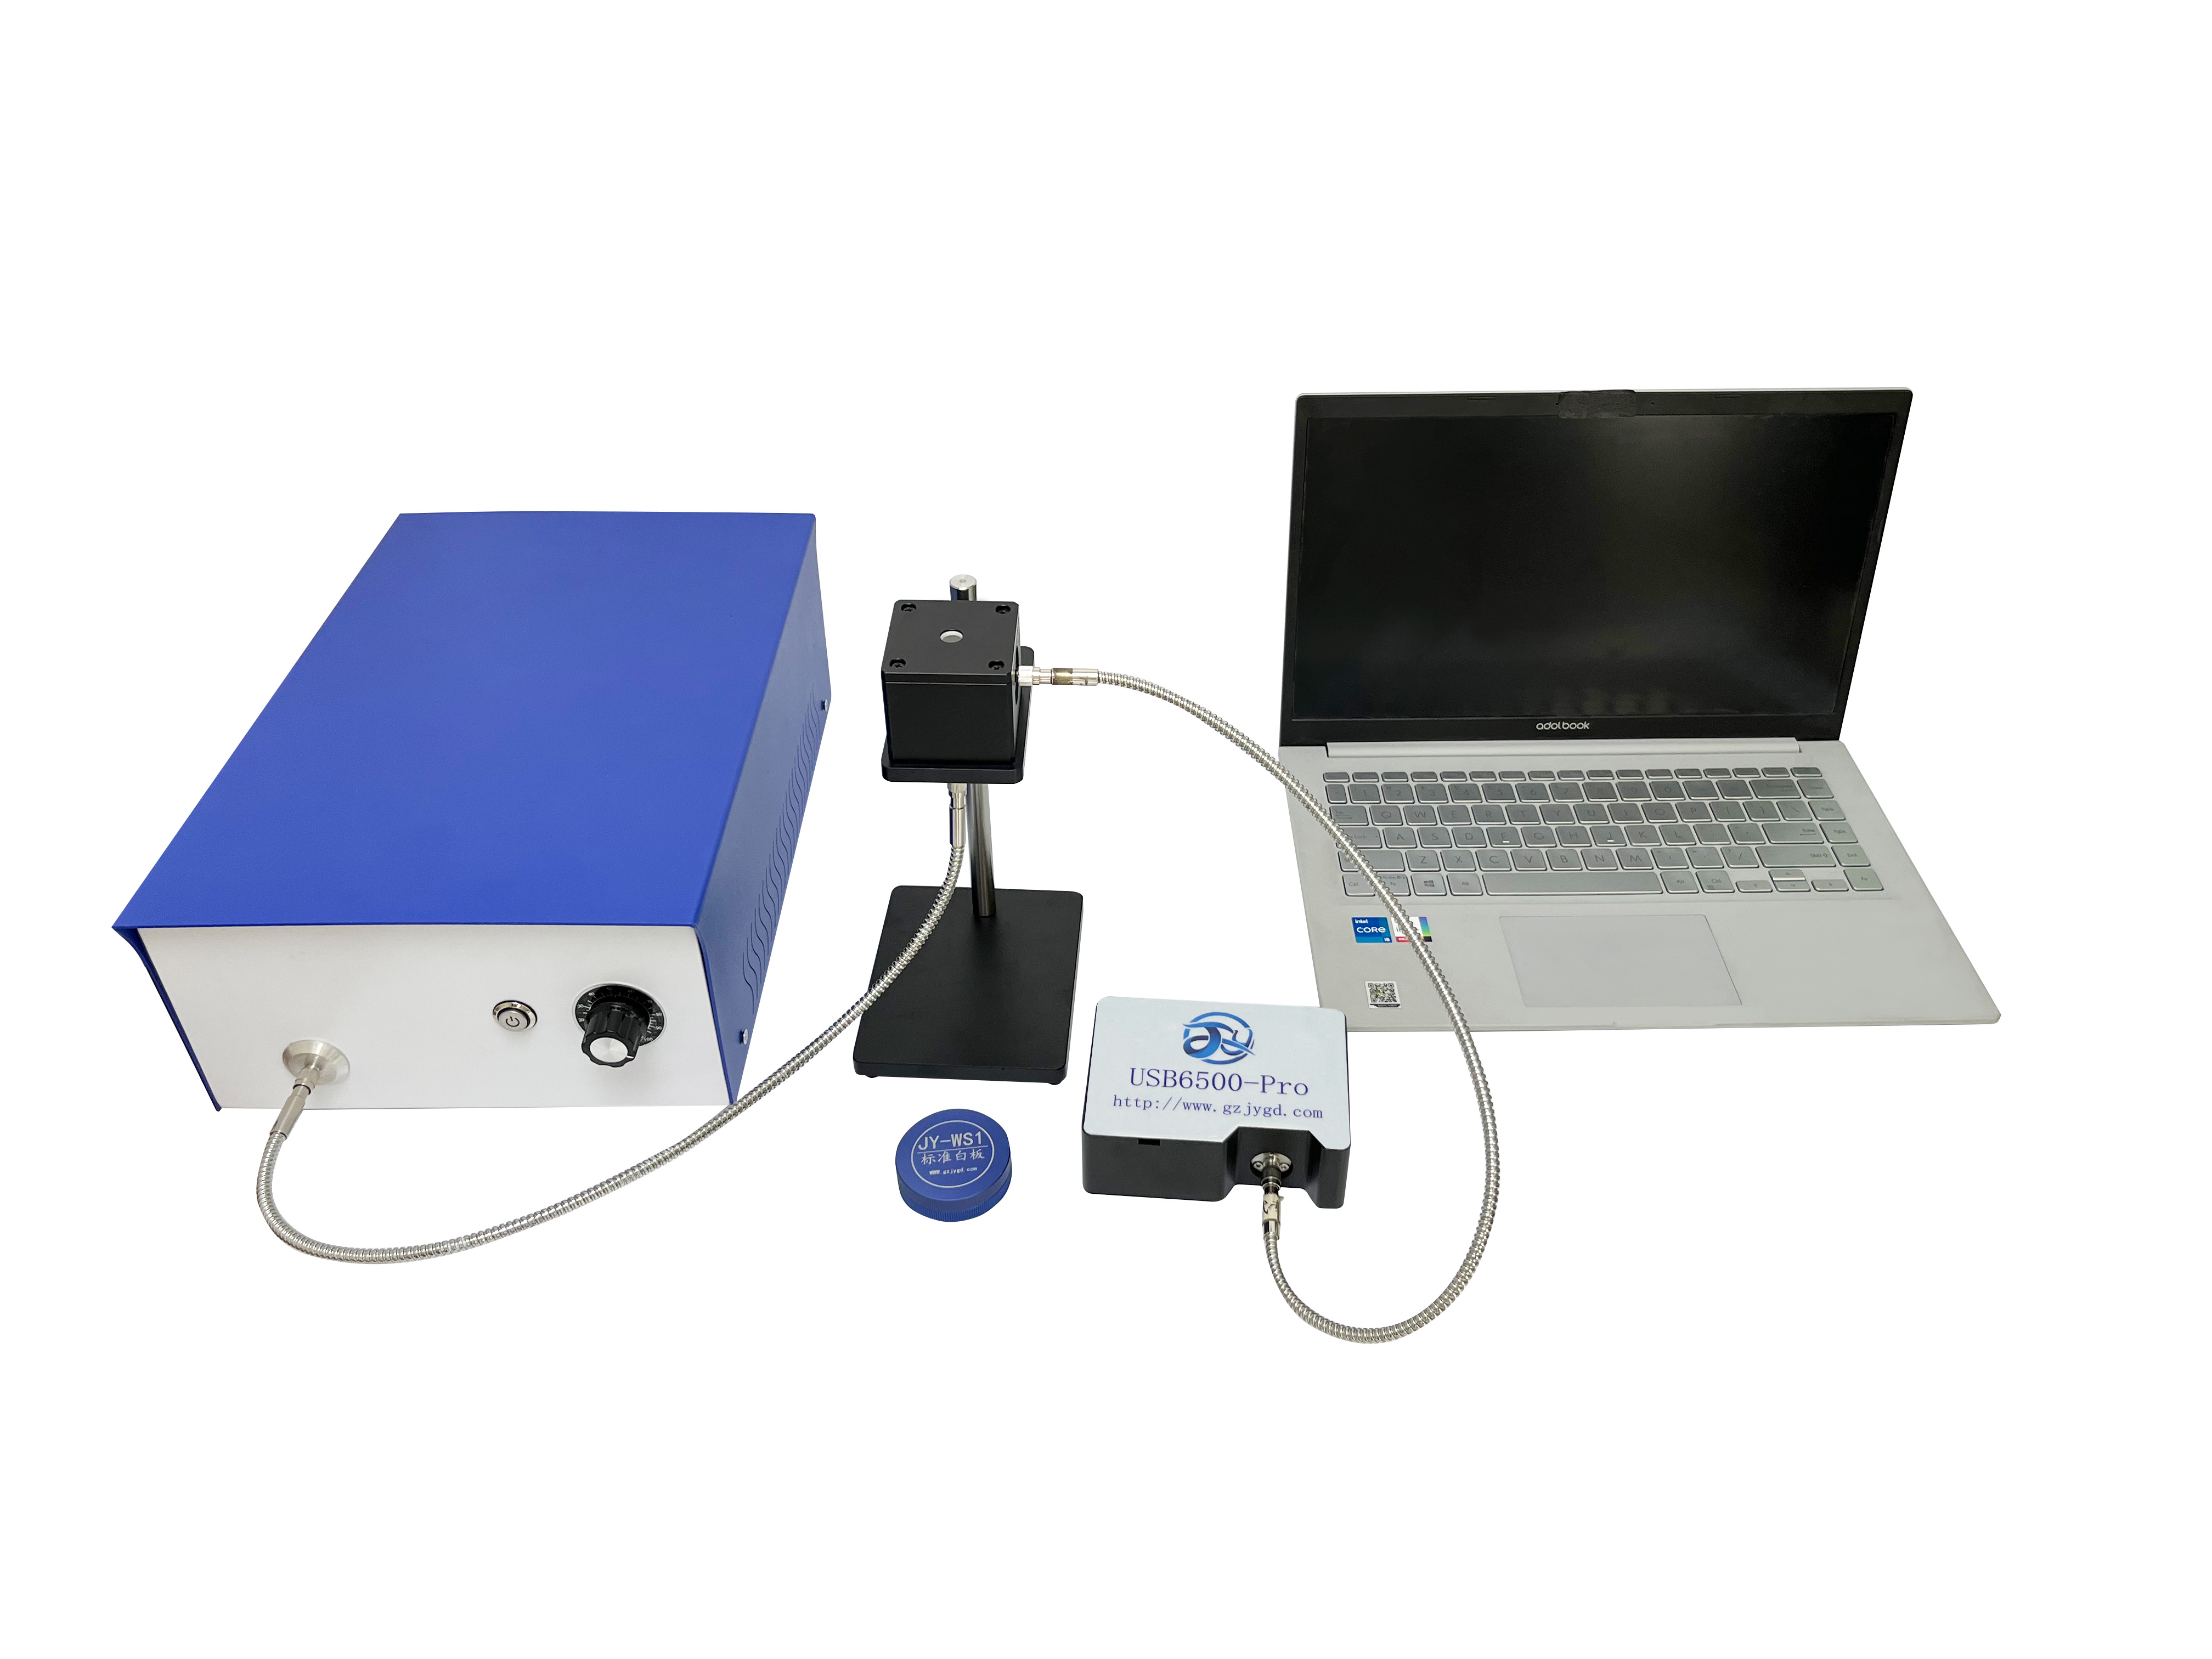
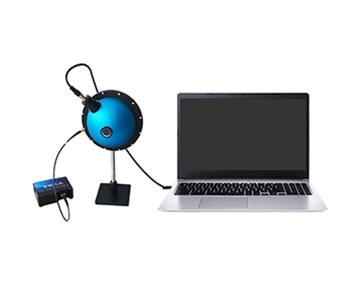
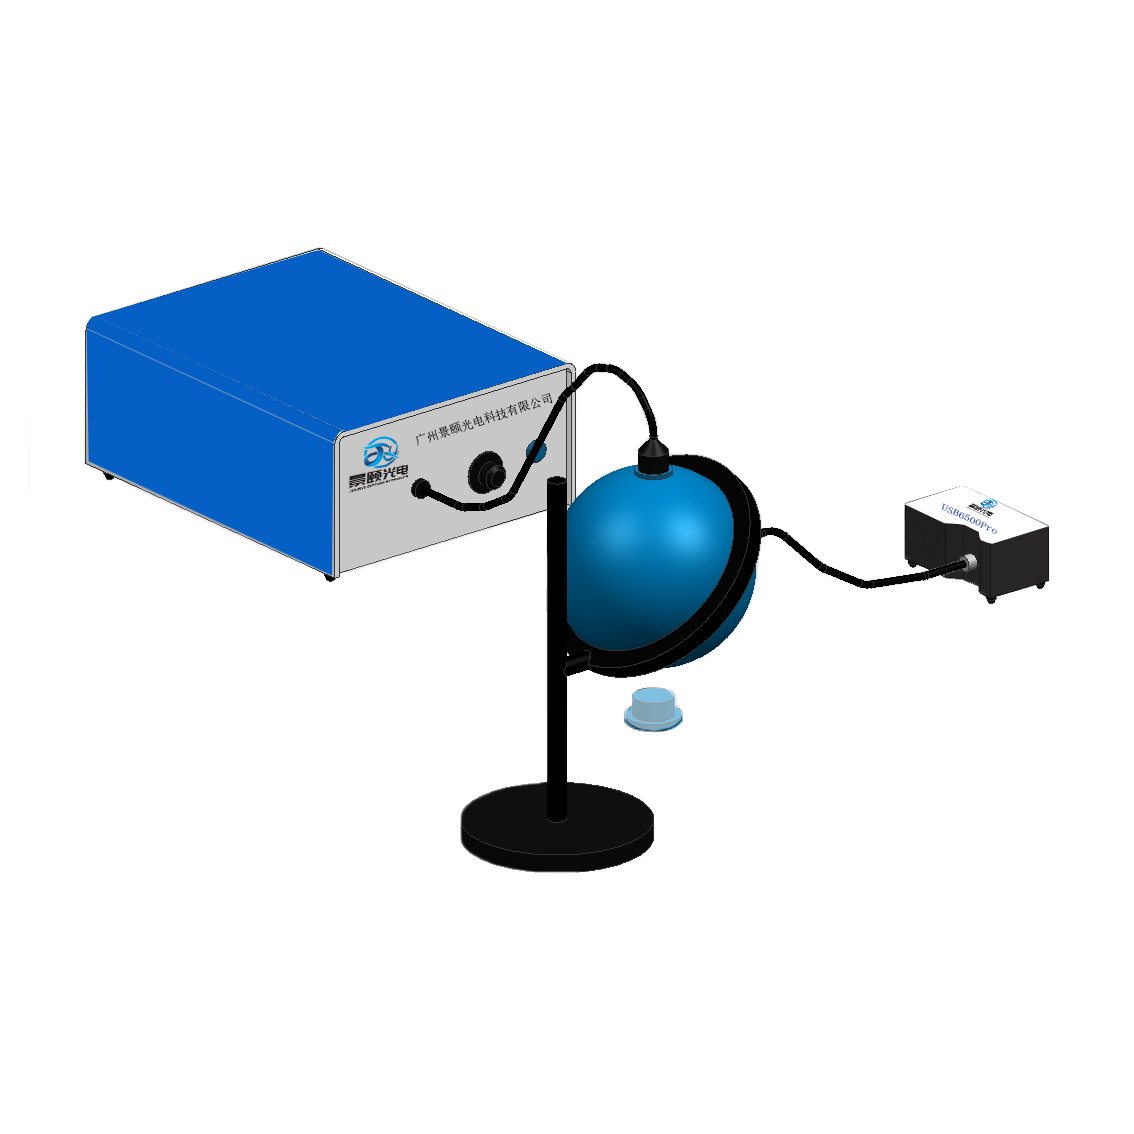
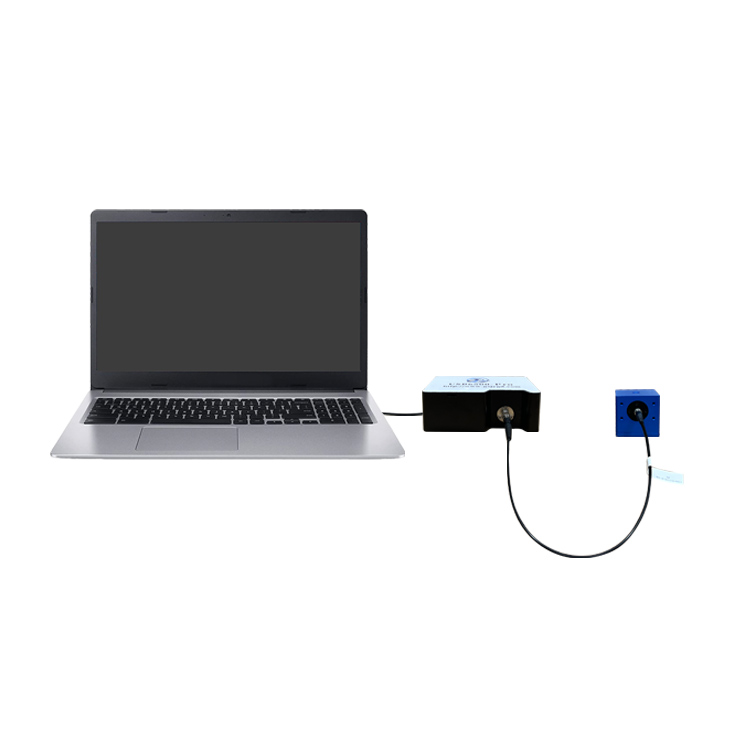
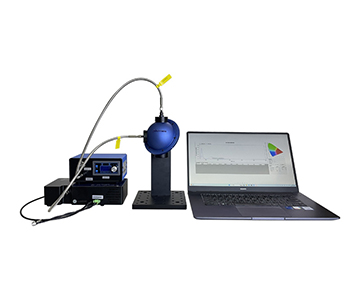
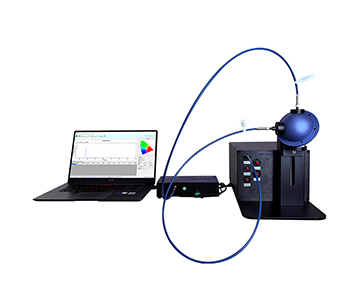
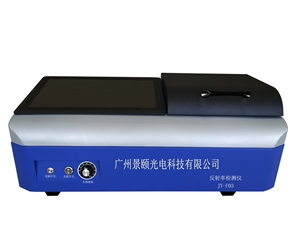
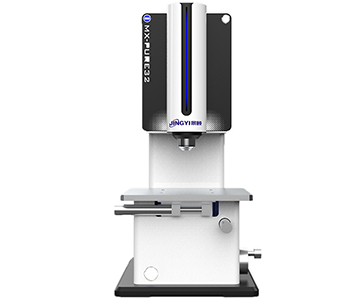
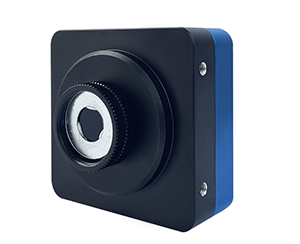
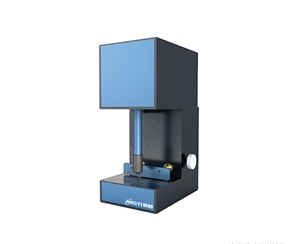
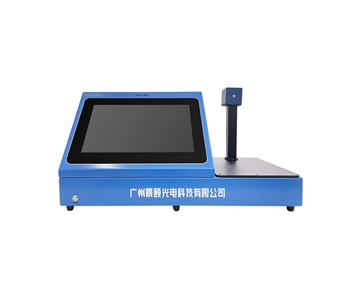
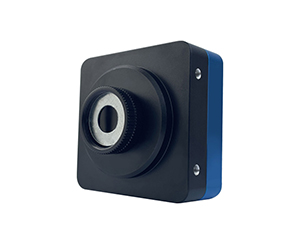
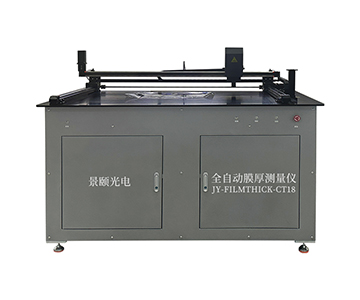
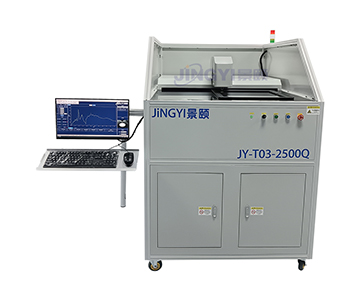
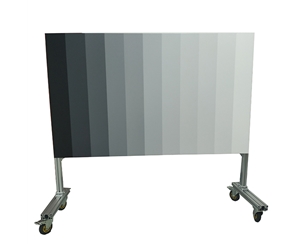
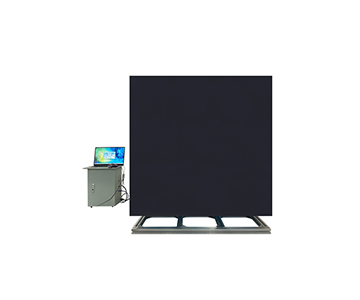
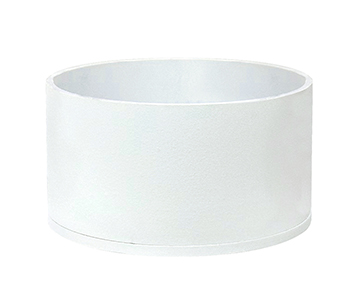
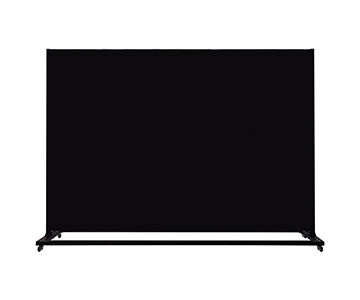
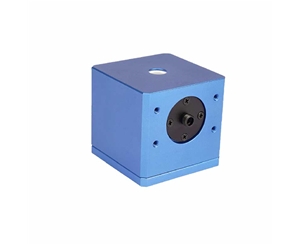
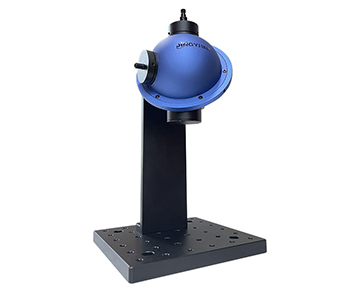
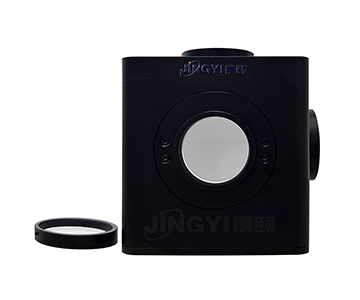
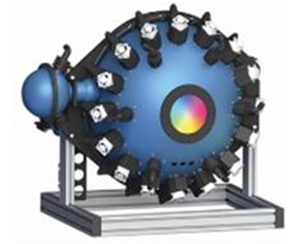
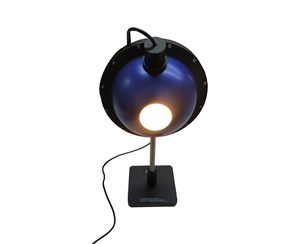
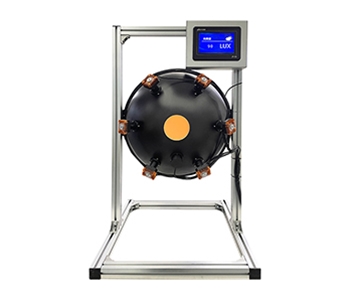
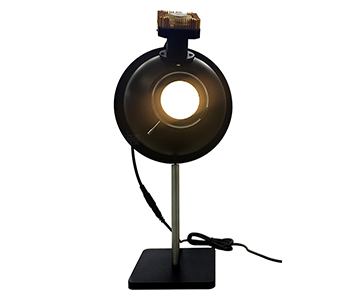
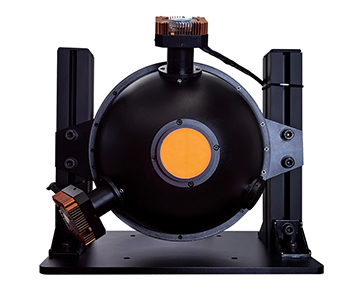
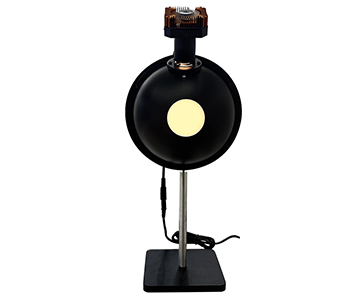
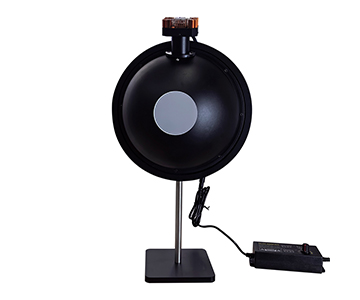
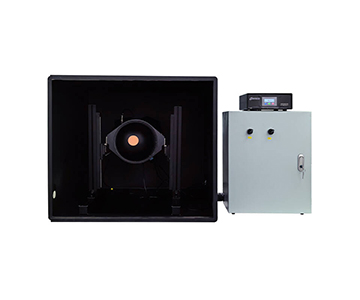
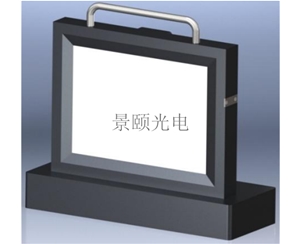
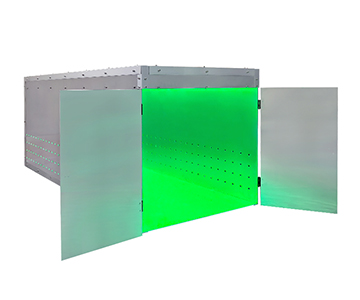
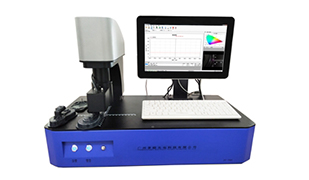
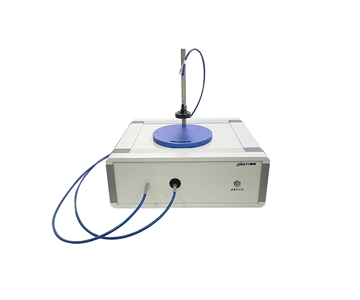
A mainstream optical transmittance gauge was introduced into the Arizona line, replacing the point-scan legacy tool. It uses an array detector coupled with a planar grating monochromator, achieving single-acquisition times under 1 s. Across the 360–1000 nm band, it outputs real-time spectral curves at 1-nm intervals. The integrating-sphere coating maintains >98% transmittance, stabilizing incident energy. Arbitrary upper and lower wavelength limits can be programmed for automatic pass/fail disposition, converting the inspection from a statistical blind gamble into a systematic full-aperture evaluation.
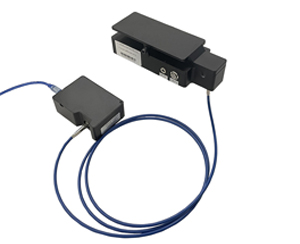
Plastic Welding: Non-Destructive Curved-Surface and Band Matching
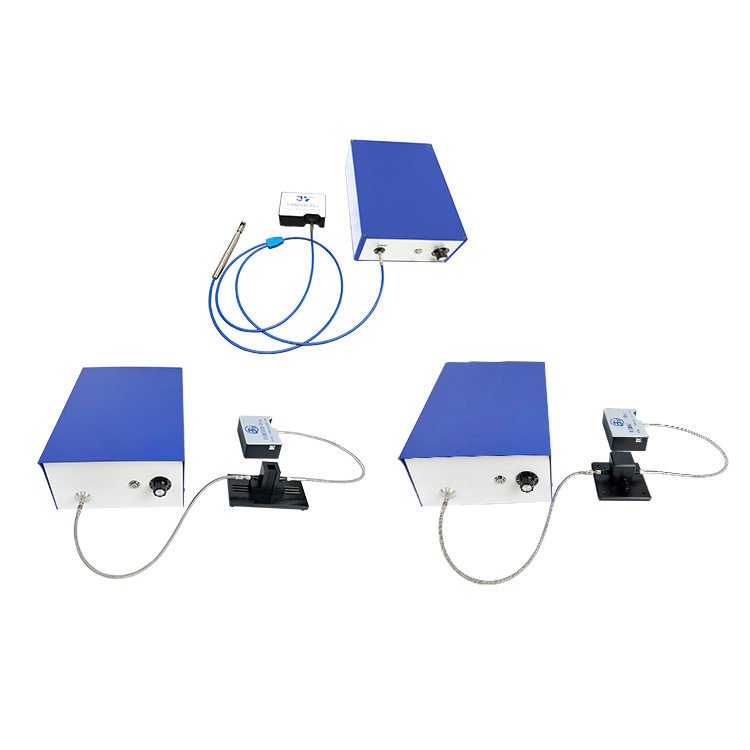
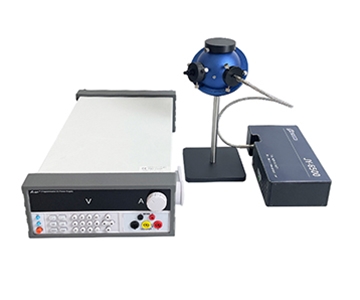
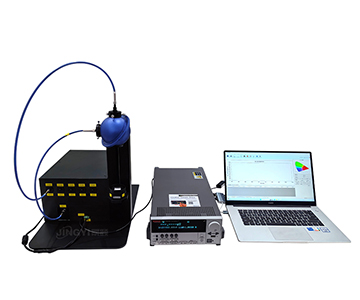
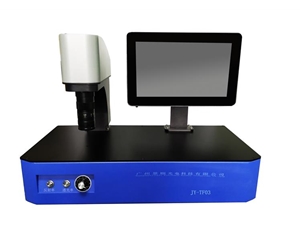
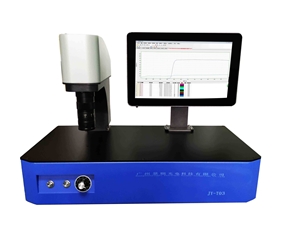
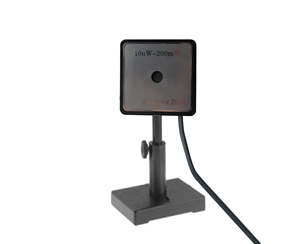
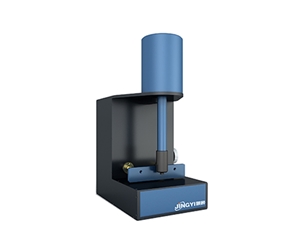
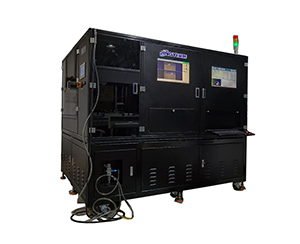
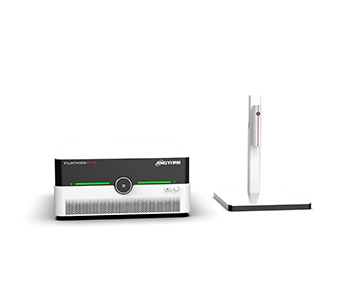
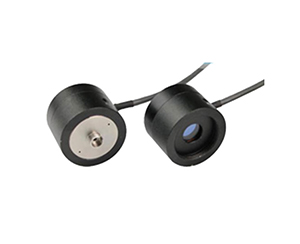
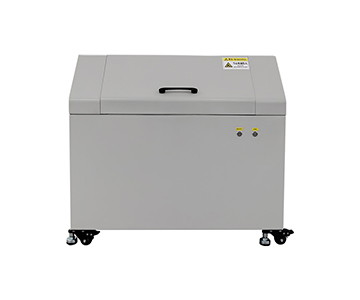
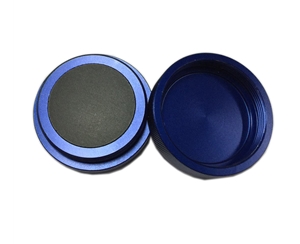
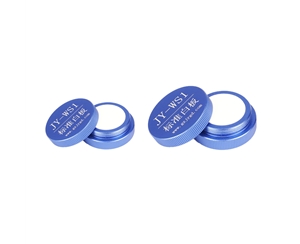
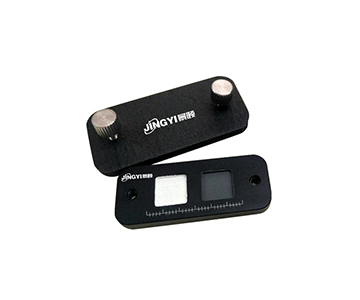
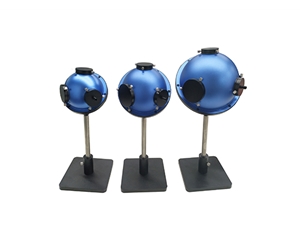
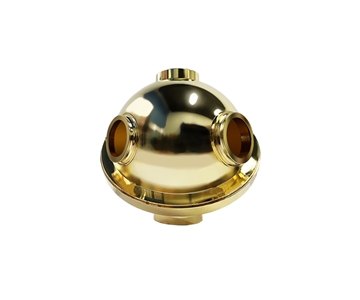
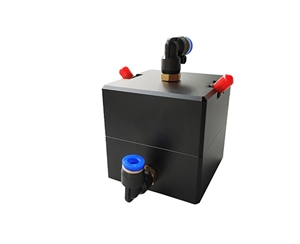
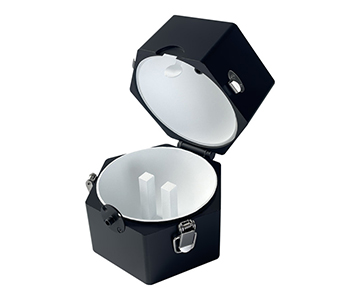
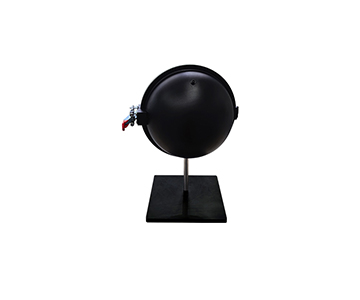
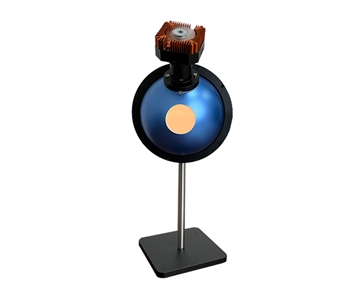
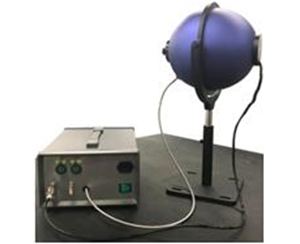
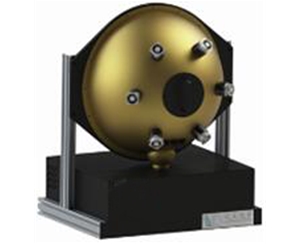
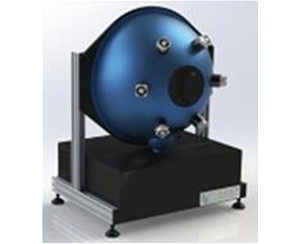
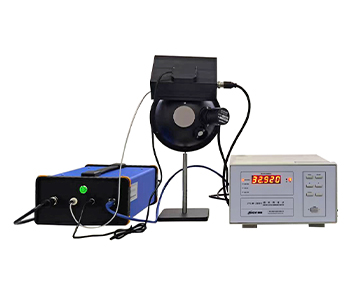
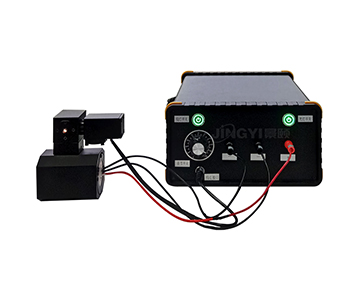
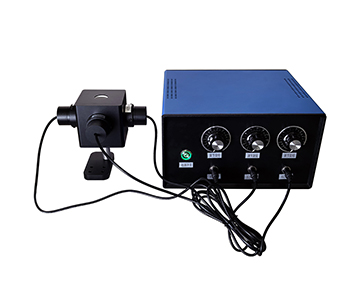
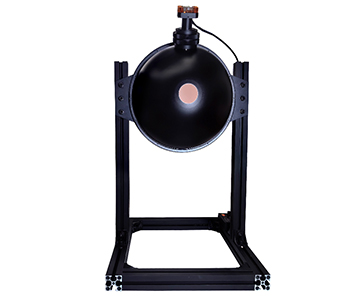
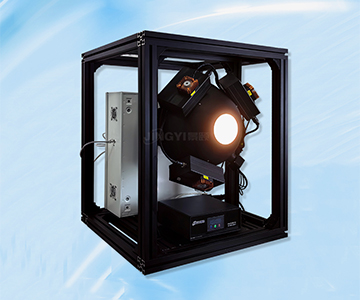
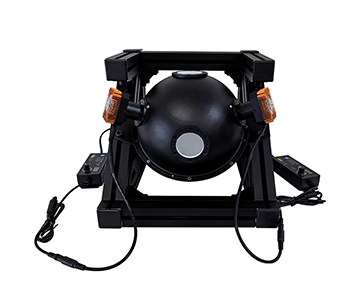
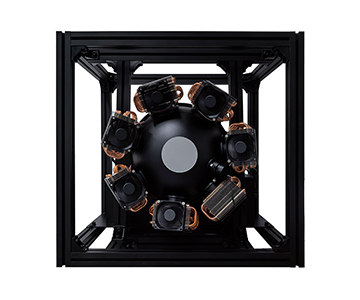
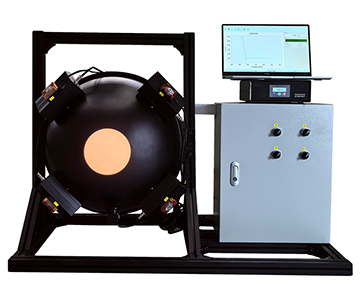
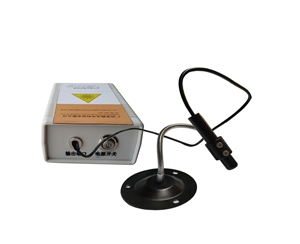
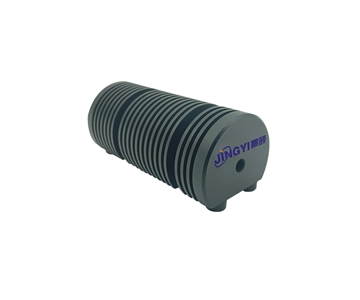
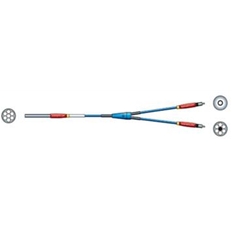
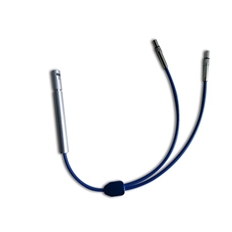
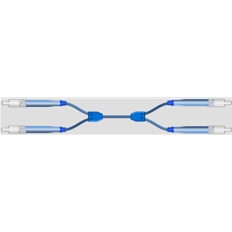
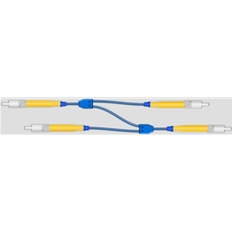
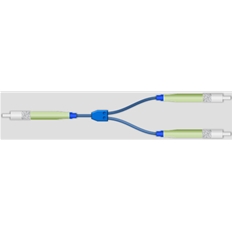
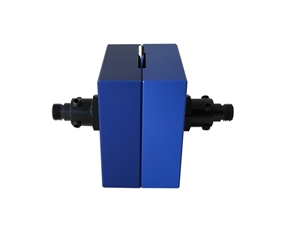
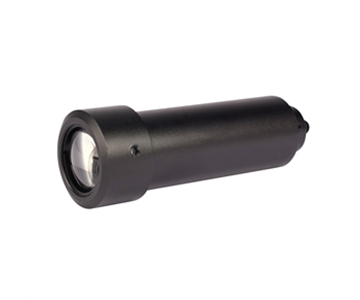
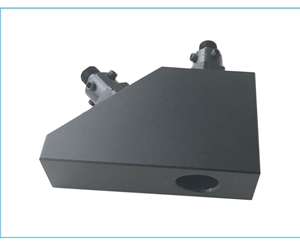
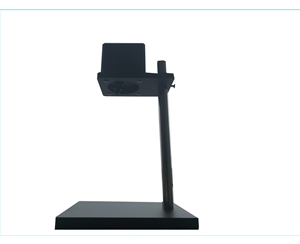
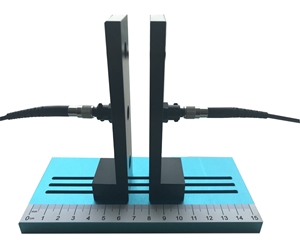
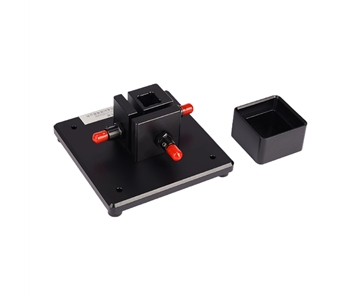
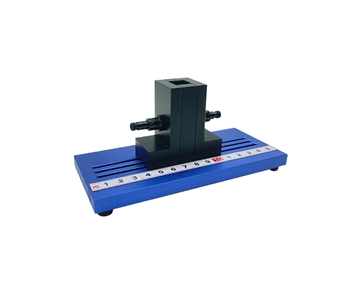
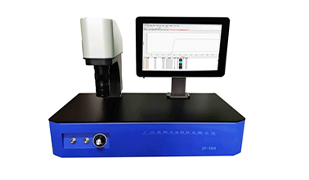
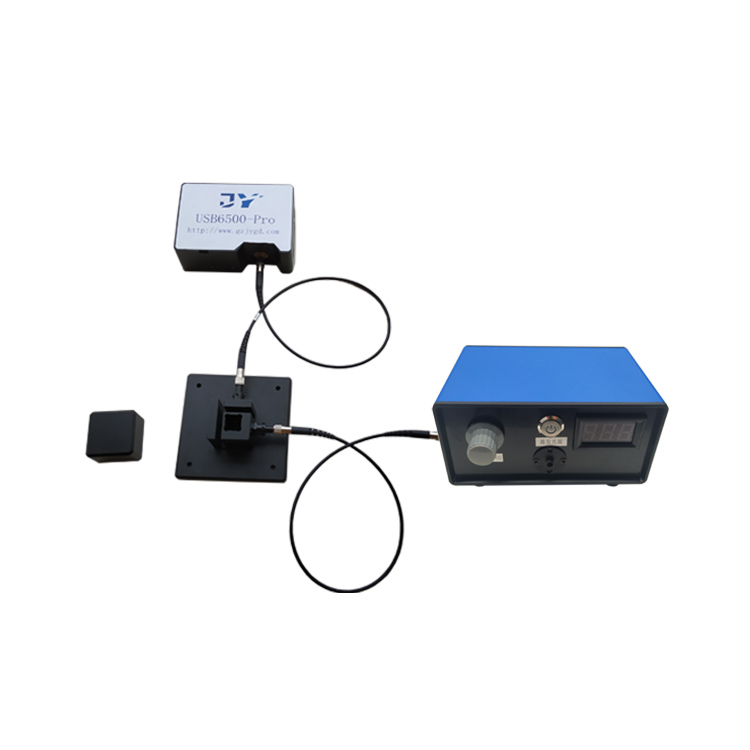
At the Michigan welding station, a dedicated optical transmittance gauge was deployed. It carries a near-infrared source matched to the welding laser band, defaulting to 980 nm with options at 850 nm, 905 nm, 915 nm, and 940 nm. Radially symmetric and curved non-planar geometries are supported without part destruction. Tubular samples from 10 mm (0.4 in) to 150 mm (5.9 in) in length and ≥5 mm (0.2 in) in diameter are accepted as-is. Single measurements complete in under 0.8 s, with repeatability error below 1% and detection-limit precision at 0.01%. Maximum, minimum, and mean transmittance across the curved zone are extracted automatically, and weld-quality verdicts are issued in real time.
Validation Methodology
Validation was conducted under controlled conditions: 200 mm × 200 mm (7.9 in × 7.9 in) borosilicate coupons for Scenario A, and 450-mm-long polyamide 6 (PA6) tubular weldments for Scenario B. Sample size was n=127 per scenario, measured at 23°C ±1°C and 45% ±5% RH. Repeatability was quantified via 30 consecutive measurements on a single master sample without repositioning. Reproducibility was assessed by three operators across two shifts using the same calibration master. Gauge repeatability and reproducibility (GR&R) results showed repeatability at 0.2 nm and reproducibility below 1% full-scale transmittance, confirming the system was production-ready.
Data Comparison: Efficiency and Precision
In the photovoltaic glass workflow, per-part cycle time collapsed from tens of minutes to under 1 s, with no mechanical indexing required. Plastic welding inspection shifted from destructive off-line sampling to non-destructive inline testing, effectively eliminating part loss. Common to both scenarios, wavelength accuracy remained within 1 nm, repeatability held at 0.2 nm, and transmittance range covered 0–100%, providing quantitative anchors for process-parameter tuning.
Cross-Industry Quality Control Patterns
Pattern 1: Band Matching Determines Process Relevance
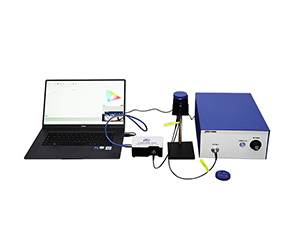
Whether assessing wide-spectral photovoltaic response or controlling 980-nm single-band transmittance in plastic welding, the inspection source must match the process source. Wide-spectrum systems covering 250–2500 nm adapt to diverse absorption characteristics; dedicated welding gauges align with the process laser to ensure measured data directly informs power settings.
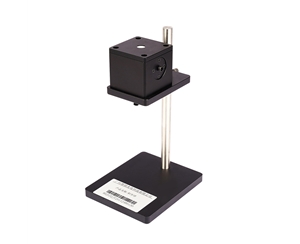
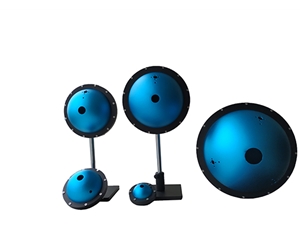
Pattern 2: Sample Geometry Dictates Optical Architecture
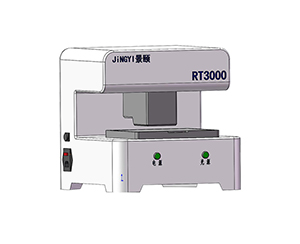
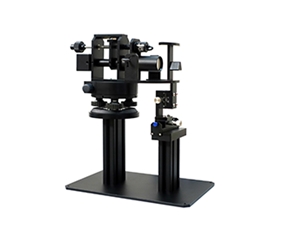
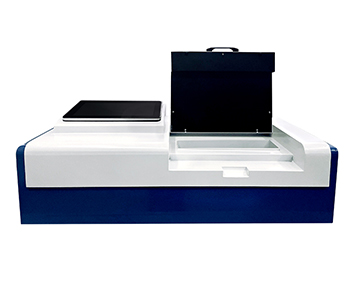
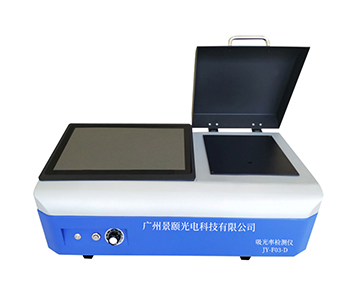
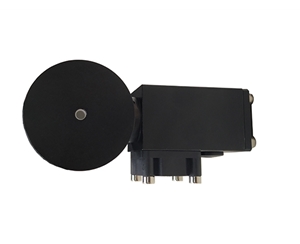
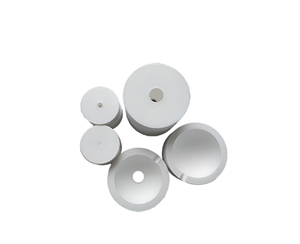
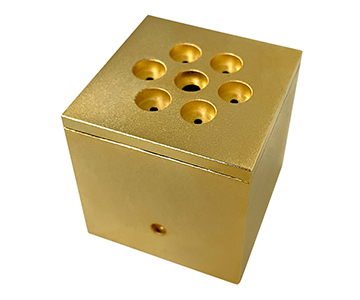
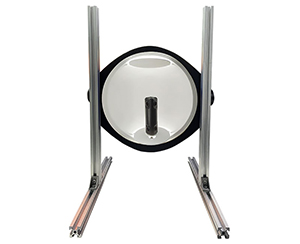
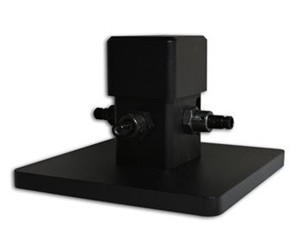
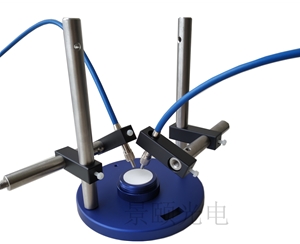
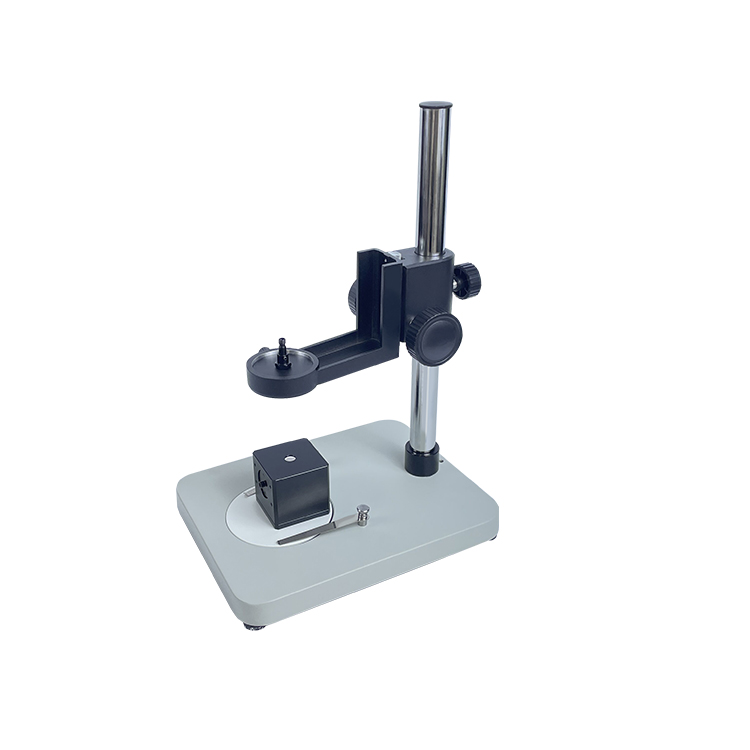
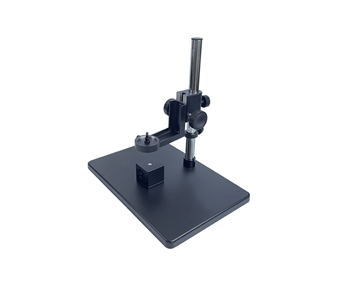
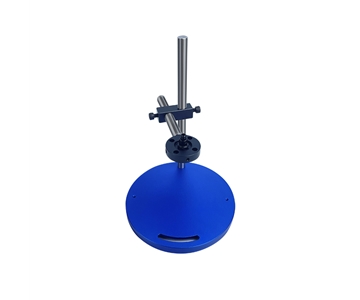
Flat samples suit vertical illumination and integrating-sphere collection. Curved tubular workpieces demand customized stages and radially symmetric beam paths. A dual-layer stage design (≥210 mm × 140 mm [8.3 in × 5.5 in] envelope, ≥75 mm × 50 mm [3.0 in × 2.0 in] travel range) paired with a ≤1-mm microscopic spot extends compatibility to miniature and irregular geometries.
Pattern 3: Speed Threshold Defines Line Feasibility
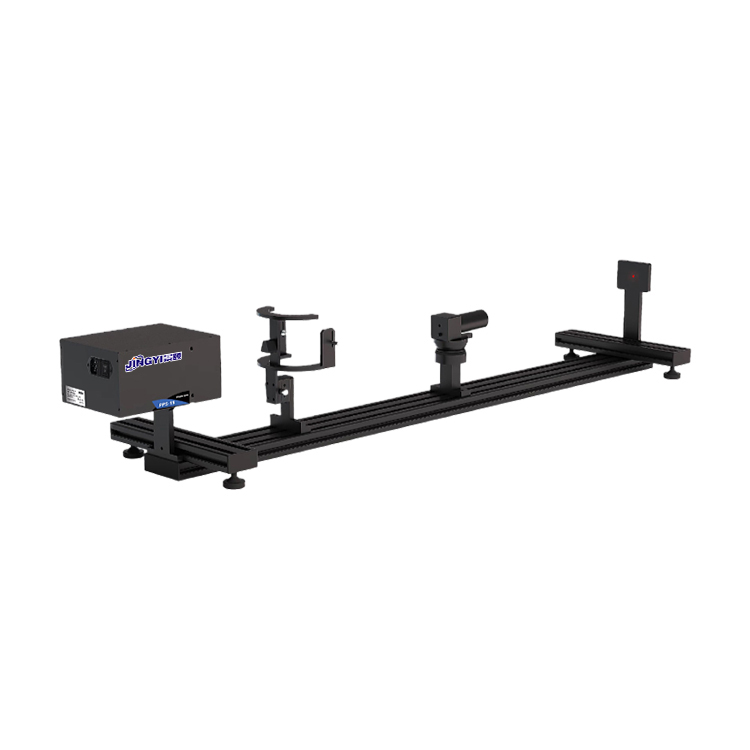
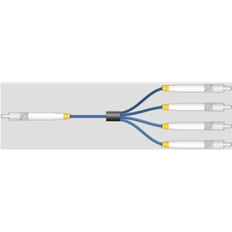
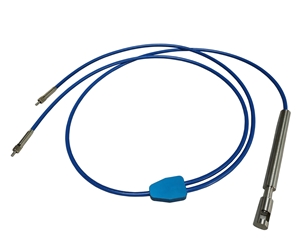
When single-test duration falls below 1 s, inspection can be embedded into the takt without becoming a bottleneck. Real-time 380–1000 nm spectral curves for fiber-optic light guides, and sub-0.8-s cycles for plastic welding, both satisfy this quantitative boundary. The combination of speed and auto-calibration is a prerequisite for shop-floor deployment.
Deployment Prerequisites
Optical Environment: Temperature, Humidity, and Cleanliness
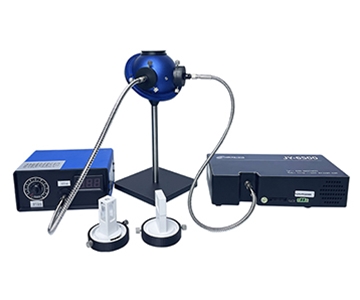
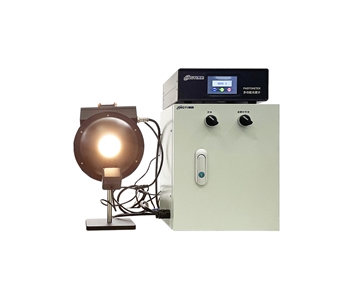
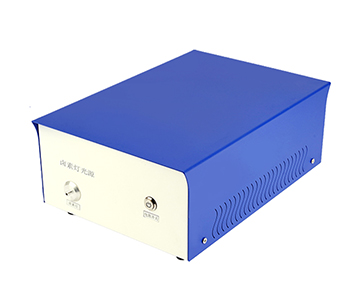
Source stability drives measurement reproducibility. In precision photonics manufacturing, low-noise calibration lamps (neon or mercury) are often used as wavelength benchmarks during qualification. Neon sources provide strong UV line spectra for academic spectroscopic verification; mercury lamps offer extended lifetime for large-area display-panel uniformity mapping. Regardless of the external reference, the system must ultimately rely on its internal halogen or deuterium-halogen source stack, stabilized through automated calibration loops. Operating temperature ranges from 5°C to 80°C (41°F to 176°F) at 220 V input, with halogen lamp life rated at 2,000 hours—figures that must be folded into the maintenance schedule.
Sample Interface: Physical Dimensions and Positioning Accuracy
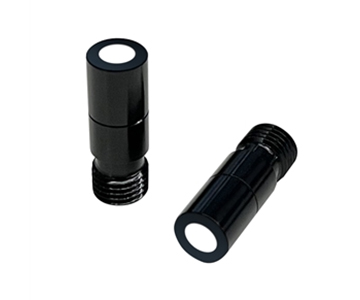
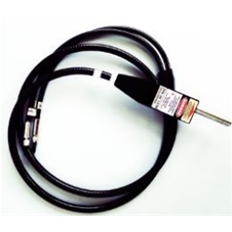
Fiber-optic samples require 10-mm (0.4-in) connection ports. Curved workpieces must fit within the gripper envelope for length and diameter. Microscopic samples need ≤1-mm or even sub-millimeter spots via microscopic optics. The intersection of port size, stage travel, and spot diameter determines physical compatibility.
Software Interface: OS and Data Protocols
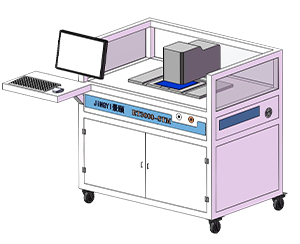
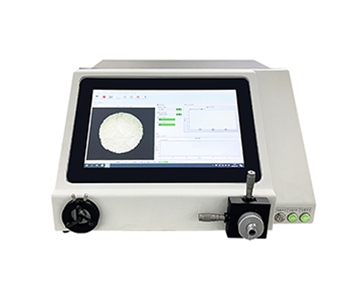
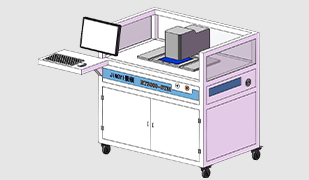
Systems typically ship with USB 3.0 or WiFi connectivity, supporting Windows 7/10/11. For production traceability, verify whether the software exposes a data-interface protocol so transmittance records can flow automatically into the plant quality-management system. Embedded PCs and automated test platforms reduce manual intervention and improve operator ergonomics.
Honest Limitations
Extreme Bands and Specialty Coatings
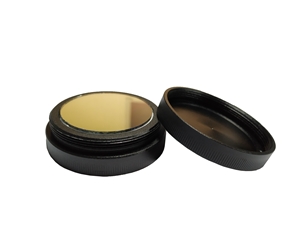
When high-precision transmittance is required beyond 1700 nm in the near-infrared or below 250 nm in the deep-ultraviolet, only wide-spectrum systems satisfy the need; conventional 400–1000 nm instruments are spectrally truncated. For ultra-low-reflectance or high-scatter coatings, the integrating-sphere’s 98% baseline—standard for most industrial applications—may require additional calibration to suppress systematic error in ultra-precision thin-film metrology.
Custom Fixture Lead Time and Cost
Curved-surface inspection demands custom grippers, multi-axis adjustment stages, or vertical safety enclosures, typically carrying additional development lead time. On mixed-model lines with frequent changeovers, tooling swap time can erode the efficiency gains from fast measurement. A product-family lock-in strategy should be evaluated before deployment to prevent the QC station from becoming the new constraint.
Frequently Asked Questions
Q1: What wavelength accuracy differences exist across system tiers?
Benchtop systems typically deliver <1-nm wavelength accuracy, with some variants reaching sub-nanometer precision. Microscopic configurations are verified against holmium oxide filters at 637.80 nm with accuracy ≤1.5 nm. Fully automated wide-spectrum systems maintain 1-nm accuracy across 250–2500 nm. Selection should be driven by process sensitivity: a ±1-nm shift at 980 nm can measurably alter plastic laser weld penetration depth.
Q2: Do curved samples require a dedicated system?
If tubular or curved parts are ≥5 mm (0.2 in) in diameter and must remain sealed, a dedicated curved-surface system with radially symmetric optics enables non-destructive measurement. Flat sections excised from the same parts can be measured on a general-purpose gauge with custom fixturing, but that sacrifices integrity and adds preparation labor.
Q3: How should pass/fail thresholds be set for production relevance?
Thresholds must be anchored to the process source wavelength, not a full-spectrum average. For 980-nm plastic laser welding, monitor transmittance at 980 nm. The gauge supports custom zones and limits, but threshold values must derive from designed experiments correlating transmittance to tensile-shear test data, not from generic standard tables.
Q4: What separates benchtop from fully automated procurement tiers?
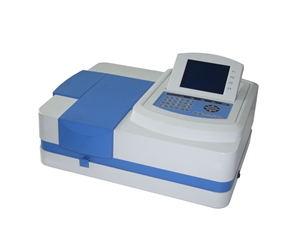
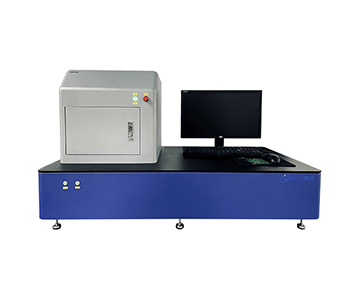
Economy benchtop units are intended for laboratory spot-checking and small-batch validation, usually with 3-mm (0.12-in) spots and manual clamping. Fully automated tiers cover 250–2500 nm with auto-stages and combined deuterium-halogen sources for continuous monitoring. The decisive factor is not price alone, but whether cycle time matches takt, the band covers the process wavelength, and the data protocol integrates with existing manufacturing execution system (MES) infrastructure.
Q5: How can I independently verify measurement reliability?
A three-step protocol is recommended: (1) recheck factory calibration with the supplied certified reference filter; (2) send an identical sample to an ISO/IEC 17025-accredited third-party lab for cross-checking; (3) run a 30+ part gauge repeatability and reproducibility (GR&R) study on the production floor, confirming repeatability and reproducibility both below 1% before the system is adopted into the QC framework.
Data Sources
: In-house validation reports (n=127 wafers/coupons), industry public information, and published metrology standards.
Author
: [Full Name], Senior Application Engineer, [Company Name], 12 years in industrial optical inspection and production-line metrology.
Disclosure
: [Company Name] manufactures optical transmittance measurement systems. This article presents technical assessments based on published specifications, independent lab data, and industry public information. No compensation was received from third-party brands mentioned.
Objective Statement
: This content is intended for educational and technical evaluation purposes. Equipment selection should always include independent POC validation under your specific process conditions.
Last Updated
: June 2026
For detailed specifications and application notes on full-spectrum transmittance measurement systems, search "Jingyi + transmittance meter" or visit our technical library.