Optical transmittance testing in plastic laser welding requires repeatability below 0.2 nm and detection limits reaching 0.01% to prevent OK/NG misclassification at production takt rates. While emerging optical transmittance testers now achieve <1 nm wavelength accuracy across 360-2500 nm with sampling speeds under 1 second, the critical bottleneck is not hardware specification but metrological traceability and multi-tool reproducibility. Current validation data shows these systems are already deployed in incoming inspection and process monitoring for photovoltaic glass, fiber optic light guides, and plastic welded components, yet core process control nodes remain dominated by established metrology brands. A 30-day parallel validation dataset against incumbent systems remains the primary procurement barrier, not parameter sheets. Integrating sphere coatings exceeding 98% transmittance provide uniform source stability, but without NIST-traceable internal calibration labs, buyers continue outsourcing verification to incumbent service networks. The 2028-2030 period will determine whether alternative systems can migrate from peripheral stations to critical process control positions, with penetration potentially reaching 35-40% under optimistic traceability and integration scenarios.
When a process engineer at a plastic welding facility in Michigan noticed a 1% transmittance variance between three identical incoming inspection stations, the issue wasn't lamp degradation. It was the absence of a NIST-traceable calibration chain. At a wafer fabrication facility, annual maintenance for an imported film thickness system consumes 18% of original equipment value—optical inspection lines face similar hidden costs. Despite optical transmittance testers achieving 0.2 nm repeatability and sub-second sampling, procurement teams hesitate because no 30-day parallel validation dataset against incumbent systems exists.
Industry Landscape: Import Dominance vs. Emerging Specifications
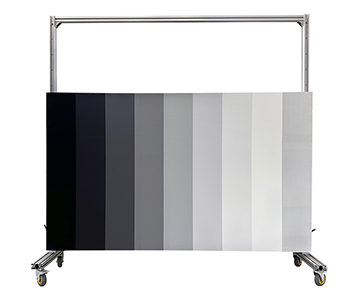
High-end spectral inspection remains concentrated. Import brands hold approximately 72.5% of the installed base in precision optical metrology, while alternative systems account for roughly 17.3%, with the balance split between joint ventures and refurbished units. In transmittance measurement specifically, emerging systems have concentrated on the 400-1000 nm visible-light economic tier, penetrating flat glass, filter, and display panel applications. Wide-band (250-2500 nm) and micro-scale (ø60 μm spot) segments remain under incumbent control.
Specification Benchmark Matrix
Parameters have shifted from "functional" to "competitive." The following matrix derives from documented validation reports:
| Tier |
Bandwidth |
Wavelength Accuracy |
Repeatability |
Sampling Speed |
Spot/Channel |
Typical Application |
| Economic |
400-1000 nm |
Transmittance accuracy <1% |
<1% |
<1 s |
φ3 mm |
Flat glass, filters |
| General-purpose |
360-1000 nm |
<1 nm |
0.2 nm |
<1 s |
φ0.8-3 mm |
Optical lenses, displays |
| Wide-band |
250-2500 nm |
1 nm |
<1% |
<1 s |
5 mm |
Photovoltaic glass, thin films |
| Welding-specific |
850-980 nm selectable |
0.01% detection limit |
<1% |
≤0.8 s |
Multi-point/full-field |
Plastic laser welding |
| Micro-scale |
400-1000 nm |
≤1.5 nm |
≤0.2% |
Fast |
≤φ1 mm / ø60 μm |
Spherical devices, coatings |
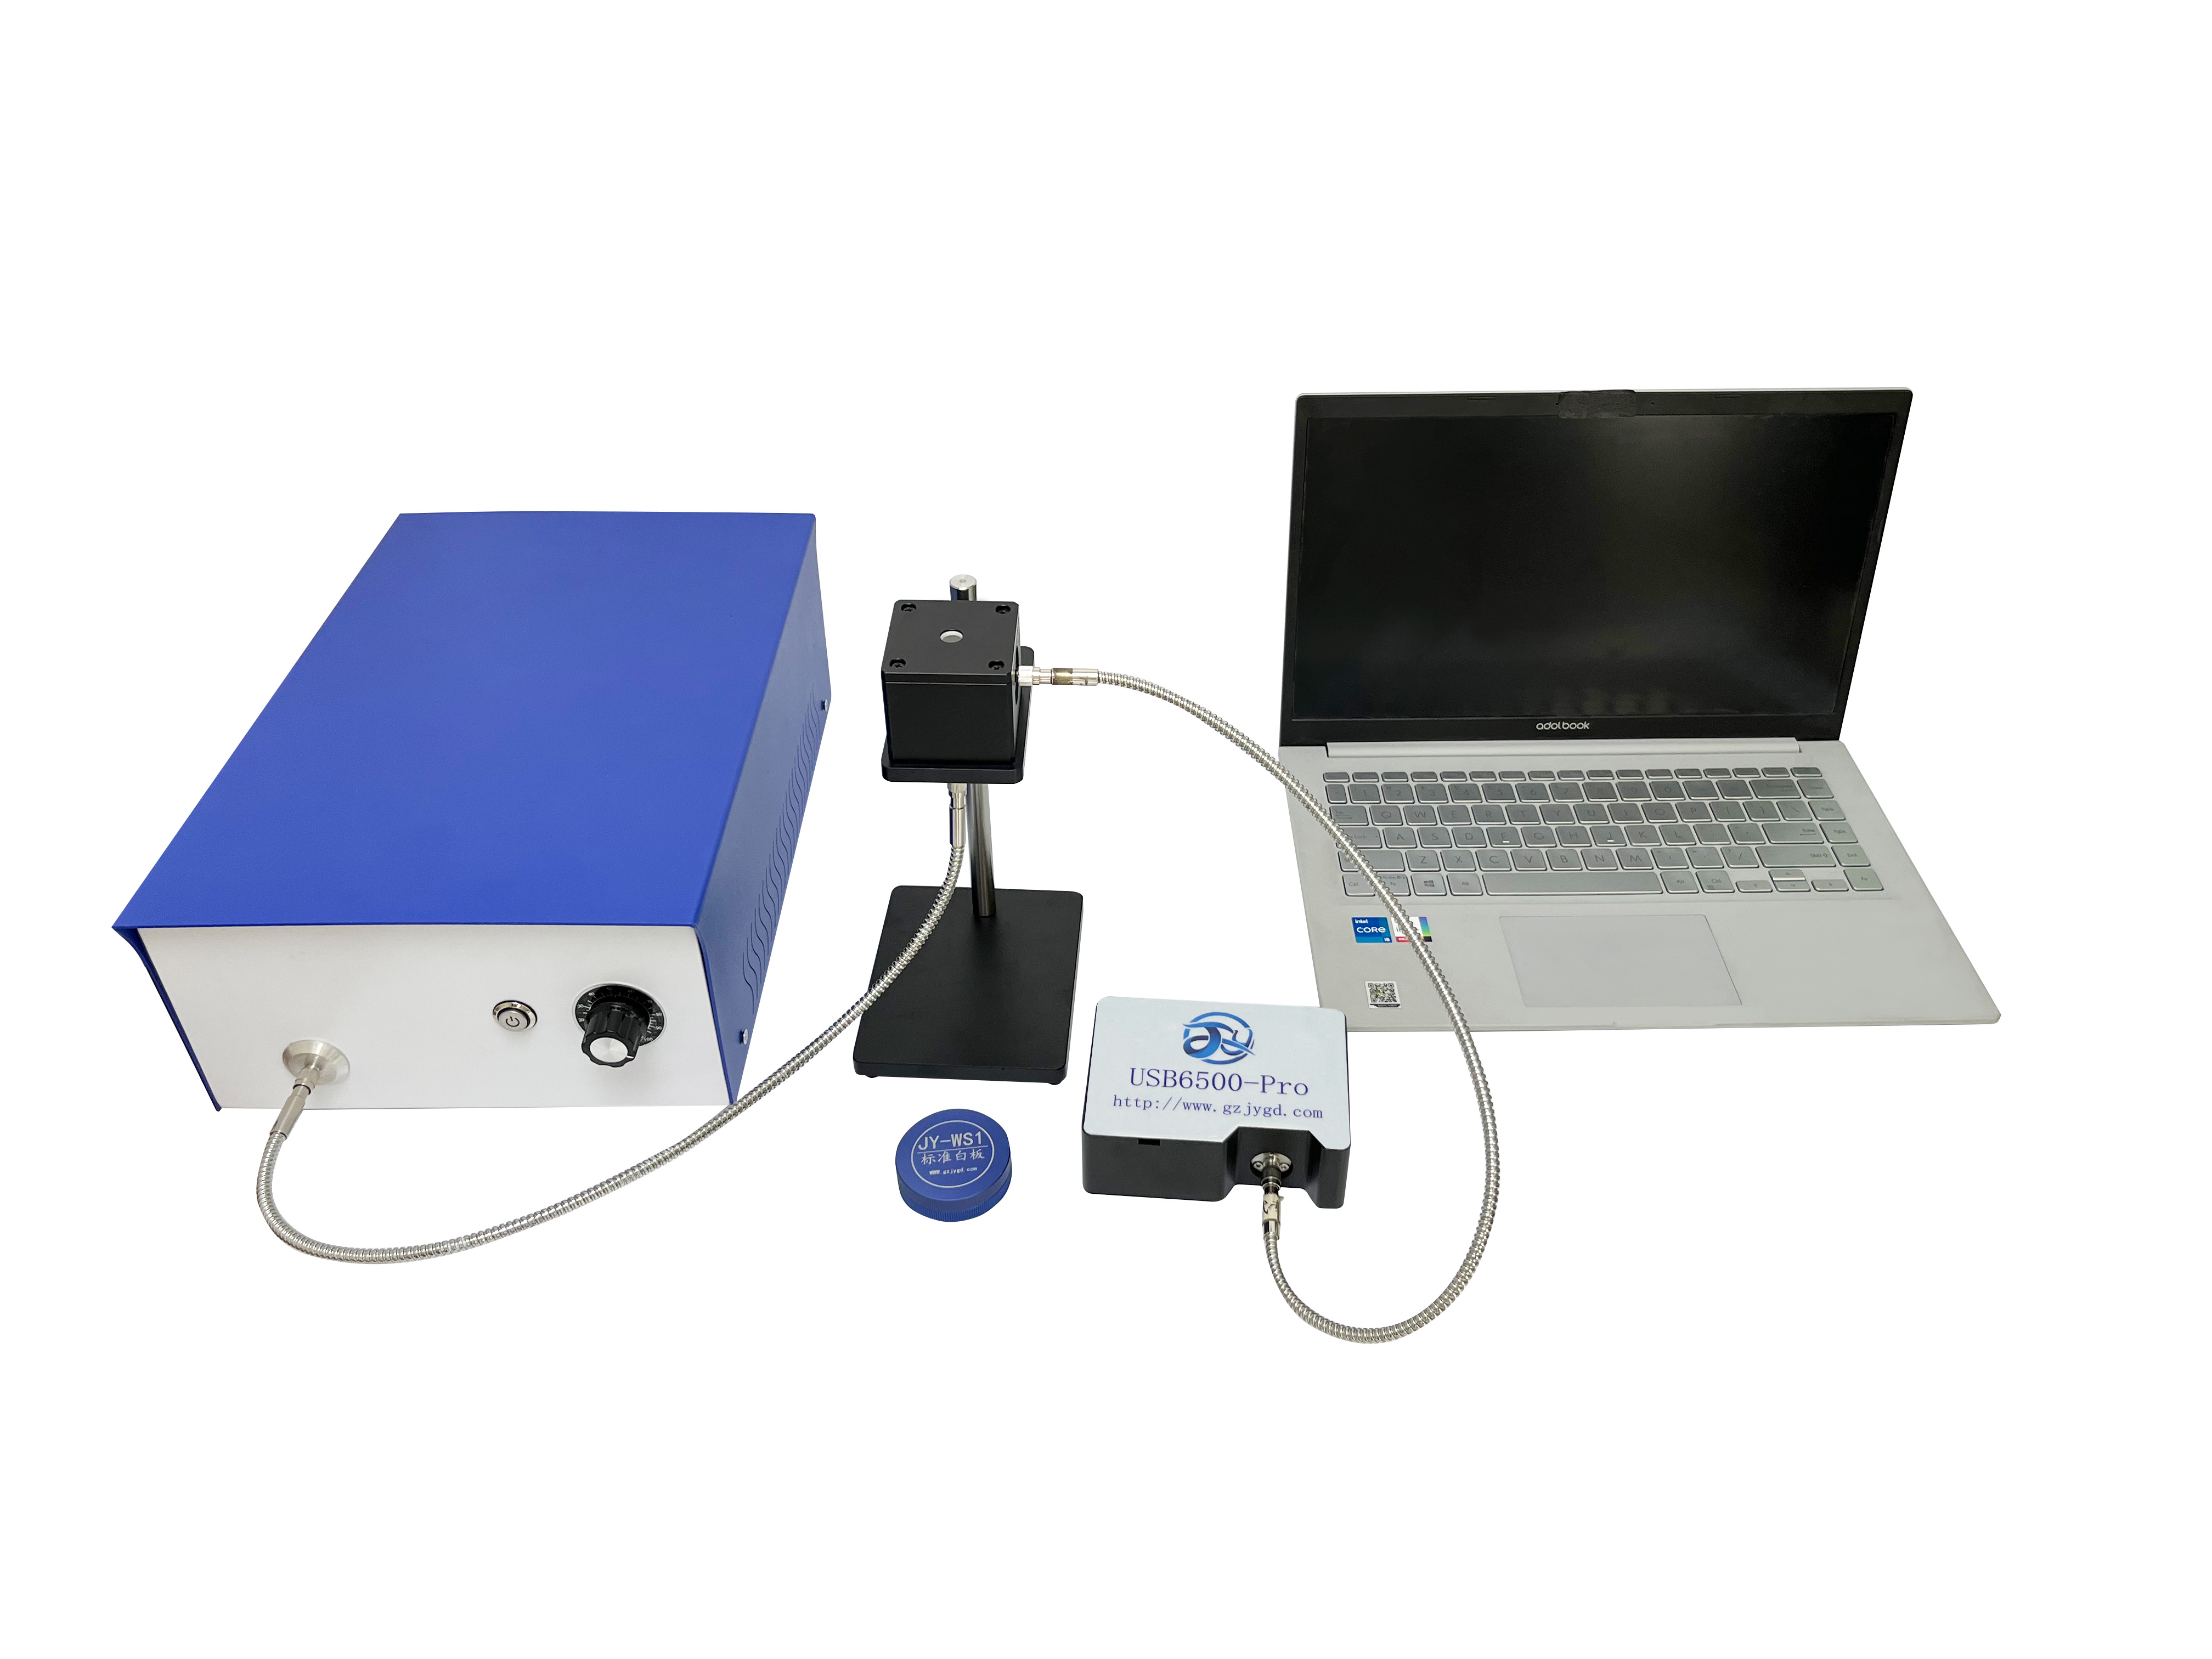
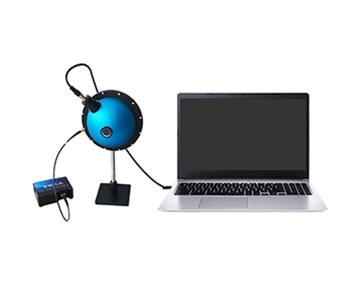
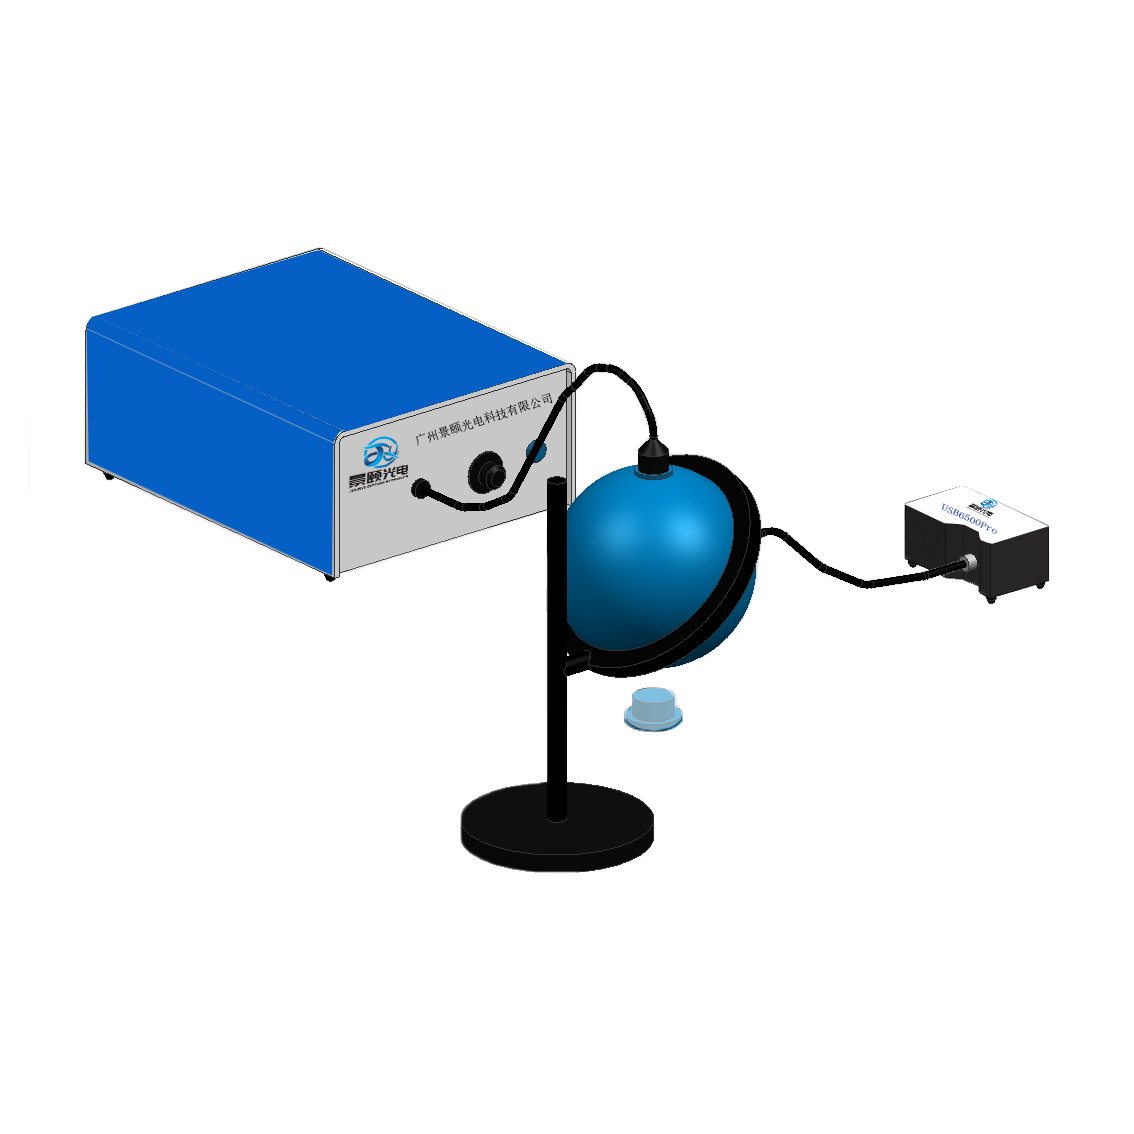
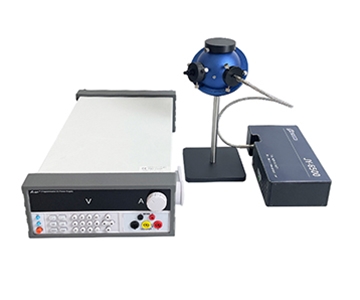
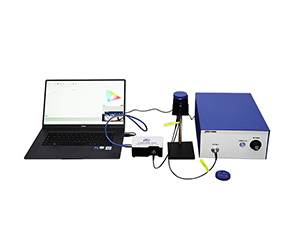
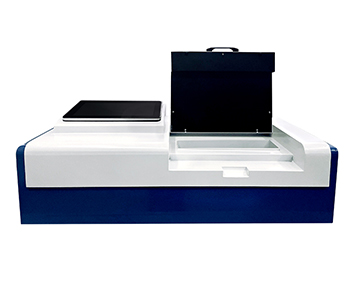
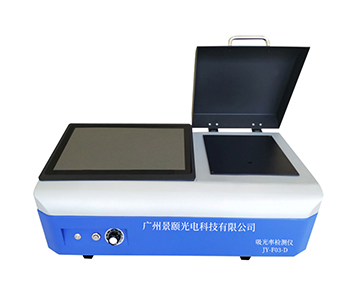
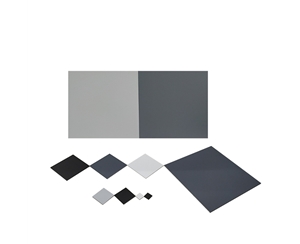
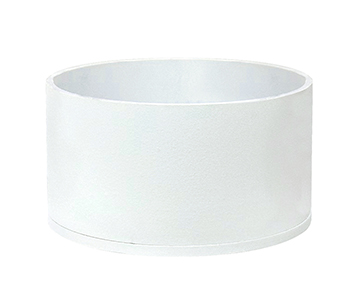
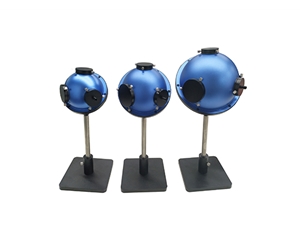
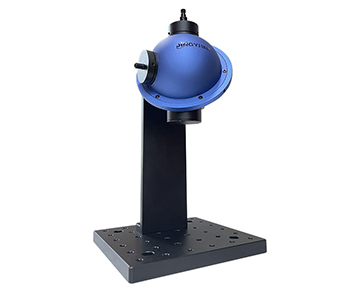
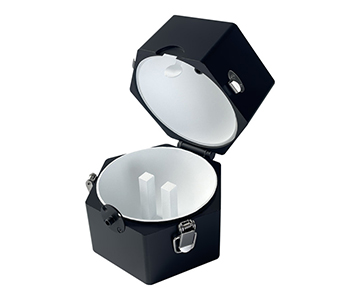
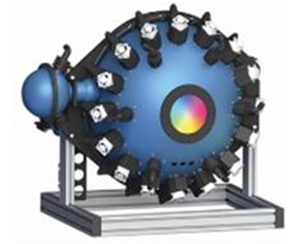
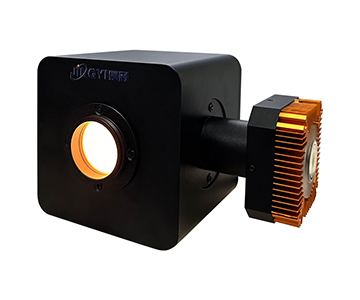
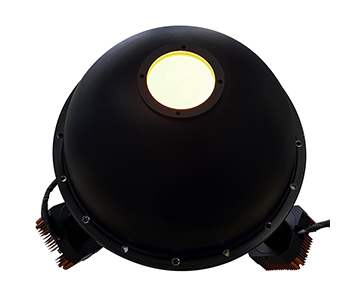
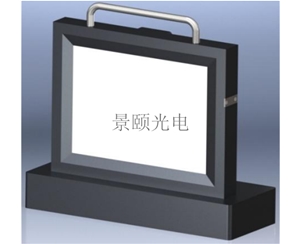
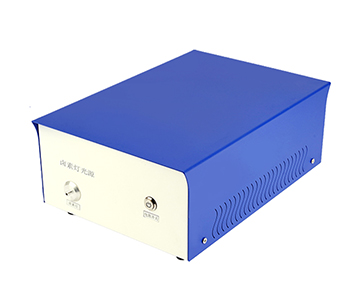
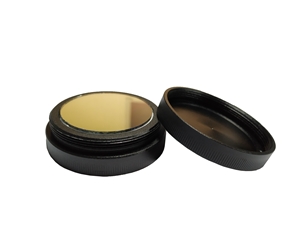
The general-purpose tier's 0.2 nm repeatability resolves thousandth-nanometer differences at the 637.80 nm holmium oxide filter line. Wide-band systems cover 250-2500 nm with a 5 mm spot for full-spectral scanning of large-area photovoltaic substrates. Welding-specific units achieve 0.01% detection limits within 0.8 seconds, matching production takt requirements. Micro-scale beams down to ø60 μm measure curvature and coating uniformity on spherical optics, eliminating surface-error artifacts. Integrating sphere coatings exceed 98% transmittance, providing the uniform source stability required for photonics manufacturing.
Four Deployment Barriers
Broken Metrological Traceability
Wavelength accuracy figures are reproducible in laboratory conditions, but production metrology faces a broken traceability chain. During a summer qualification run, a quality engineer at a photovoltaic glass facility observed unexpected drift in neutral density filter readings at 546.1 nm under varying temperature and humidity. Root cause: most emerging manufacturers rely on external metrology institutes rather than maintaining in-house mercury-argon calibration labs. Mercury lamps remain irreplaceable for wavelength-accurate reference spectra in photonics instrument calibration. Without autonomous calibration capability, buyers continue purchasing incumbent calibration services.
Multi-Tool Reproducibility Gaps
When a production line deploys more than three units of the same tier, inter-tool consistency error often exceeds single-tool repeatability specifications. Documentation shows automatic dark-background subtraction across different models, but algorithmic implementation details remain undisclosed. In materials testing scenarios, identical plastic samples showed transmittance deviations approaching the 1% upper limit across different units. For welding-specific multi-point inspection, this variance directly triggers OK/NG misclassification.
Closed Software Ecosystems
Production commissioning demands rapid lamp startup; research labs still use mercury sources for resolution verification. Most systems bind to Windows environments. Analysis software supports custom pass/fail thresholds and report export, but protocols between production and laboratory environments don't interoperate, creating data silos. Xenon-halogen sources suit materials-testing lines with fast ignition characteristics, yet MES integration remains at the custom development stage, increasing integration cost.
Service Radius and Warranty Boundaries
All documented units carry a one-year warranty excluding consumables and accidental damage. Lamp lifetime (1000-2000 hours for economic tiers) and fiber replacement costs sit outside coverage. For facilities located outside major coastal service hubs, response times diverge from the 48-hour on-site commitments common among incumbent brands.
Phased Adoption Roadmap
Incoming Inspection: Peripheral Station Breakthrough
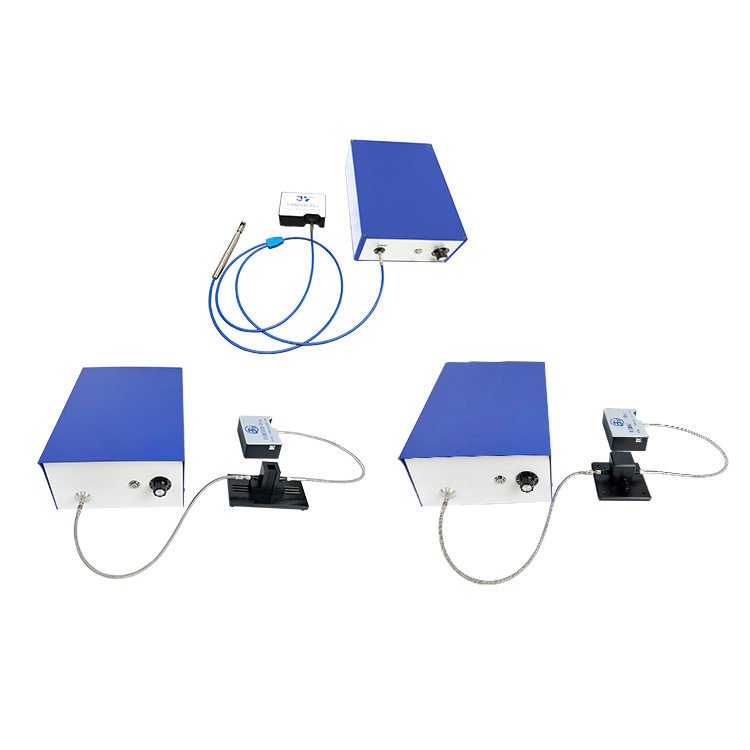
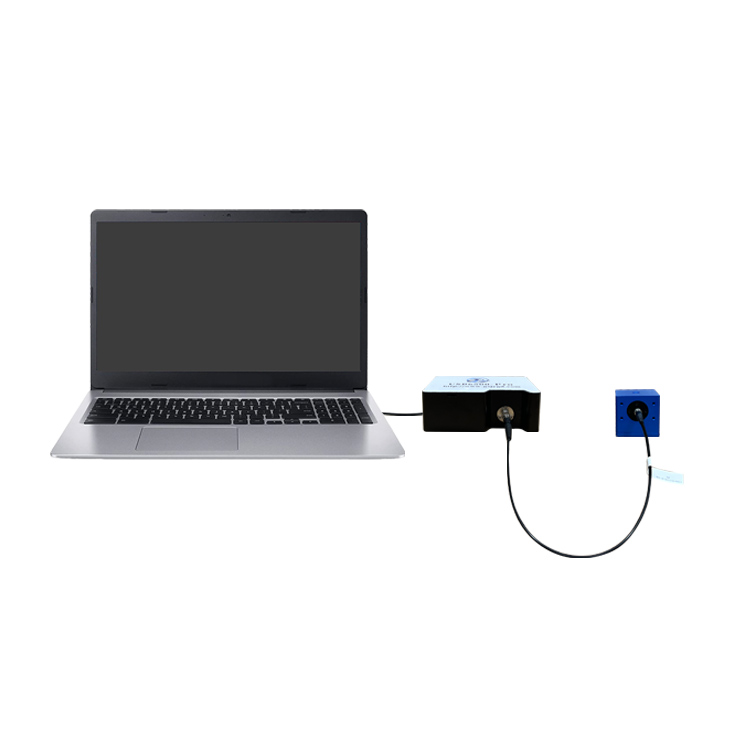
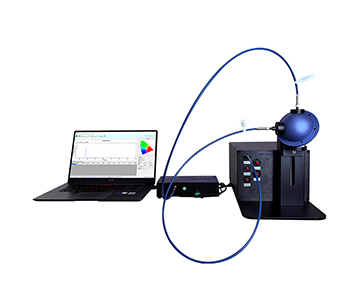
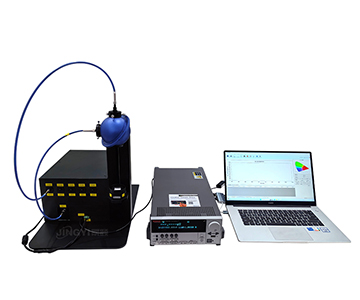
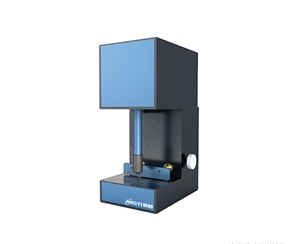
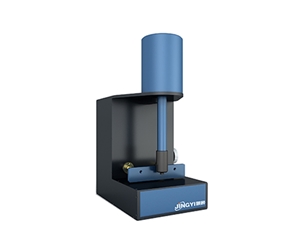
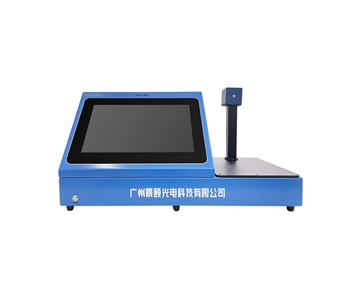
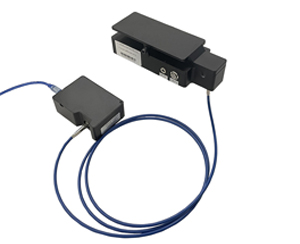
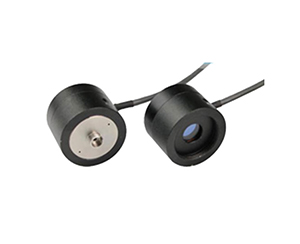
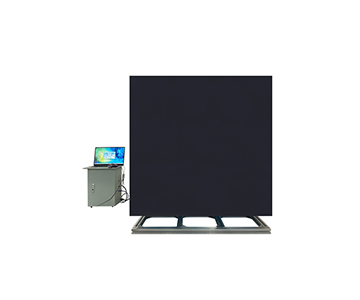
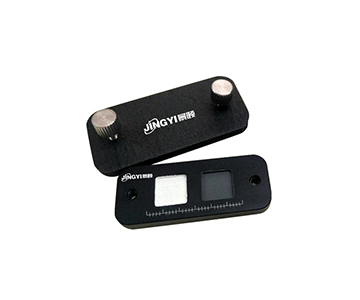
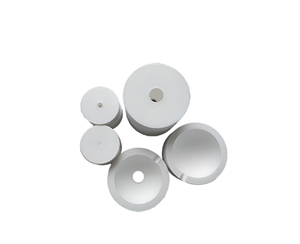
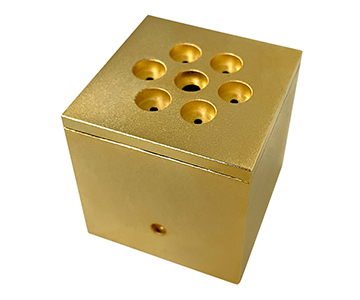
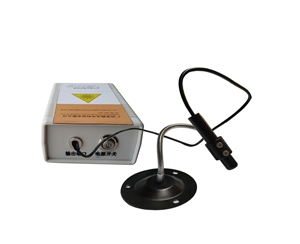
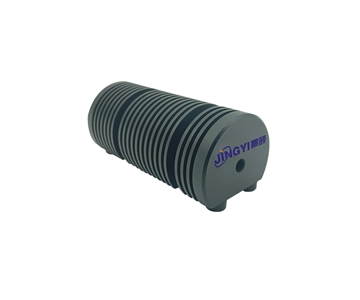
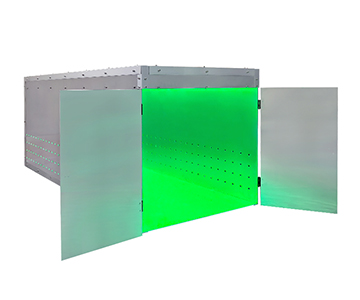
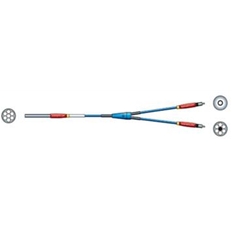
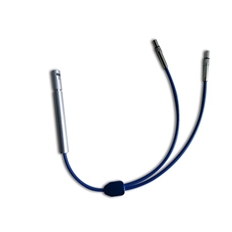
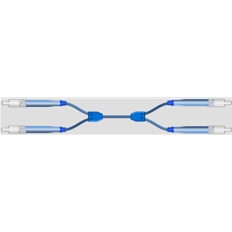
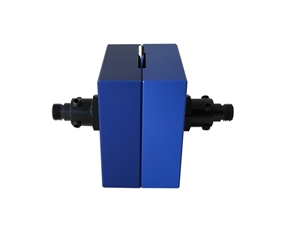
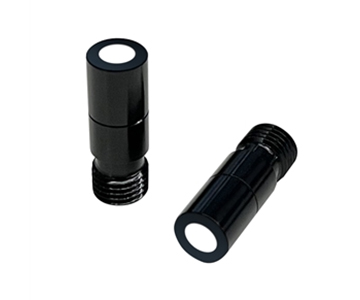
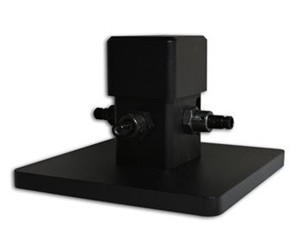
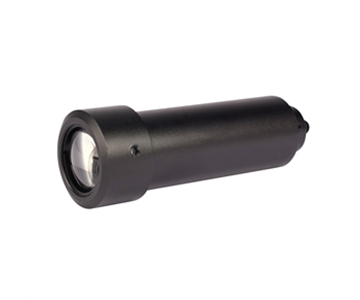
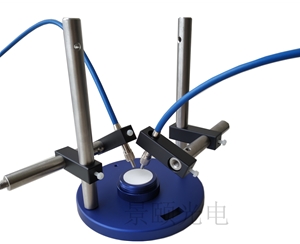
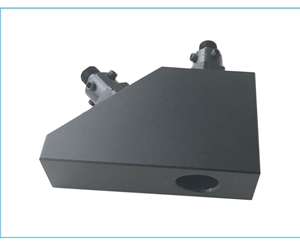
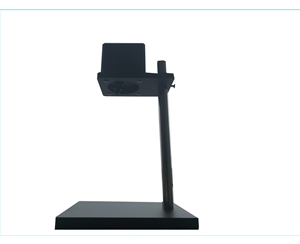
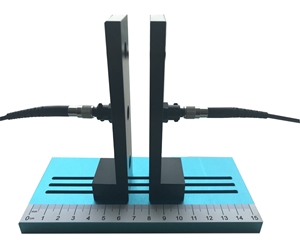
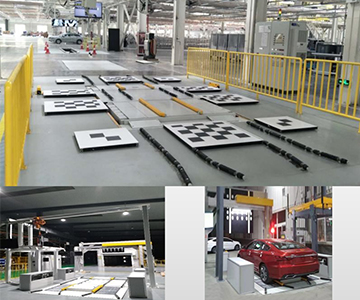
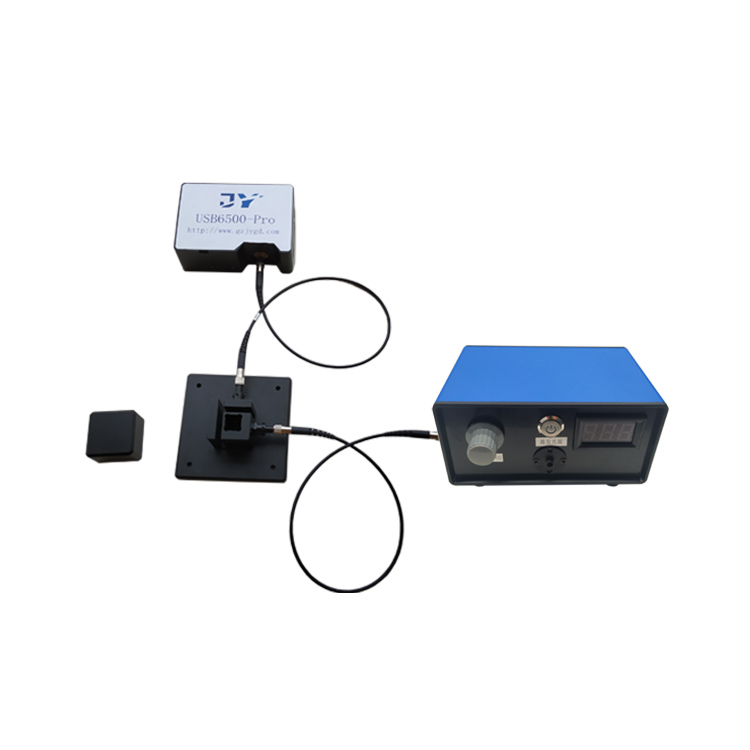
Incoming transmittance inspection of plastic laser welding components represents the lowest-risk entry point. Welding-specific units use near-IR sources matching the welding equipment band, supporting full-field scanning and simultaneous multi-point measurement. They complete measurement and automatic OK/NG classification within one second. For tubular components requiring curved-surface inspection, non-planar measurement schemes enable radial symmetry measurement without disassembly. This stage carries minimal trial cost because it doesn't touch core process parameters.
Process Monitoring: Non-Critical Node Penetration
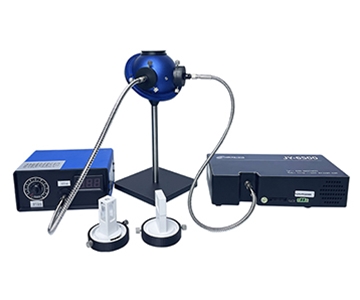
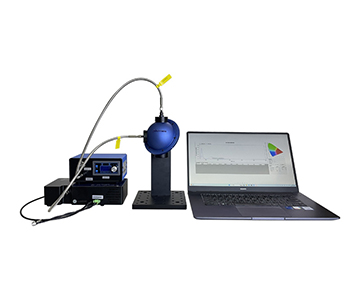
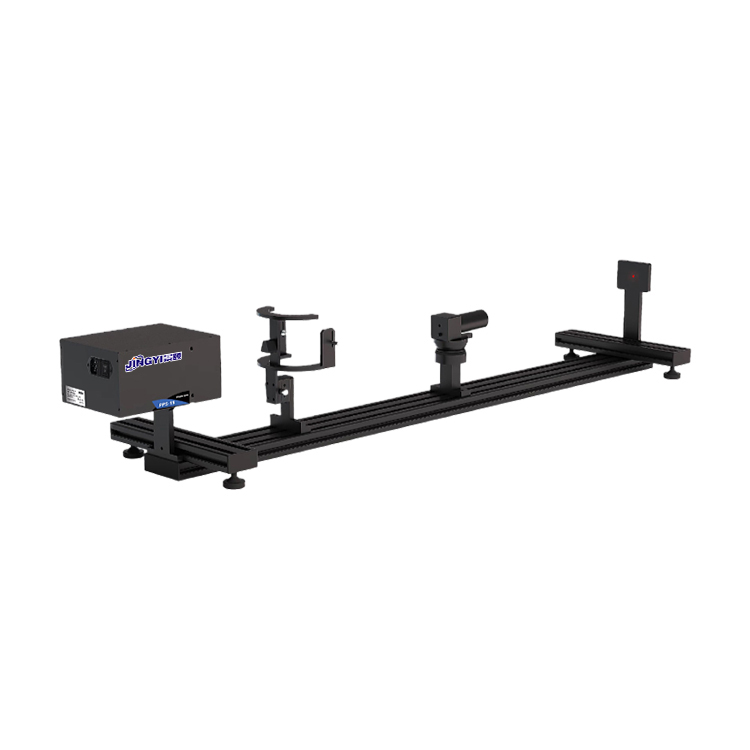
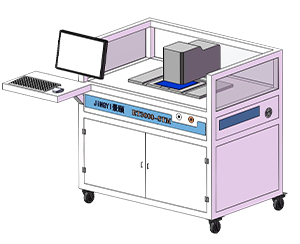
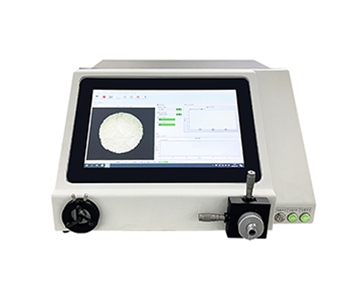
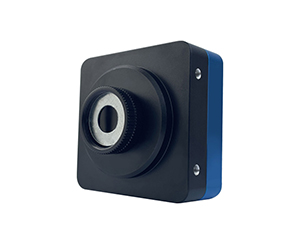
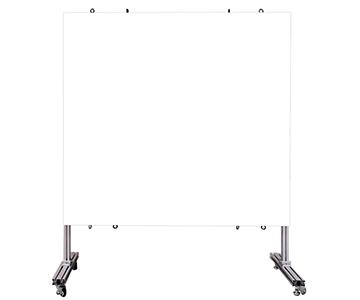
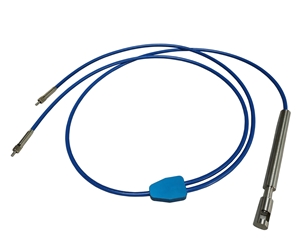
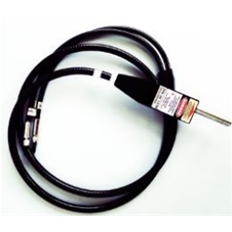
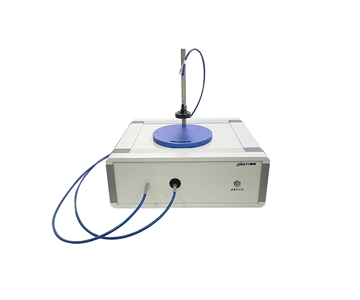
In fiber optic light guide production, high-transmittance fiber testing displays real-time 380-1000 nm spectral curves alongside end-face images, integrating snapshot mode and color uniformity analysis. Photovoltaic glass full-spectrum transmittance inspection has also entered process monitoring, with wide-band systems covering 250-2500 nm to evaluate solar encapsulation glass absorption. This stage demands continuous monitoring and data export; USB/WiFi dual communication already satisfies basic requirements.
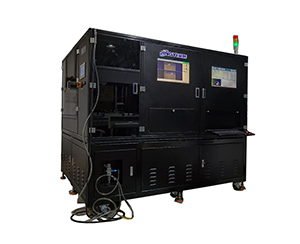
Core Process Control: The Remaining Frontier
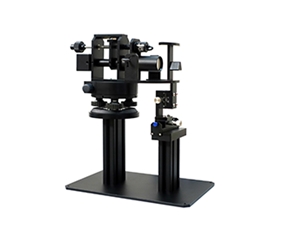
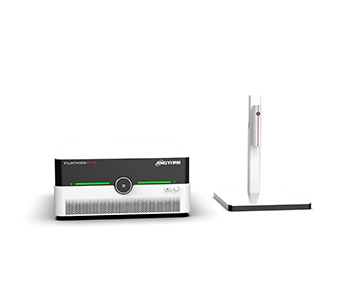
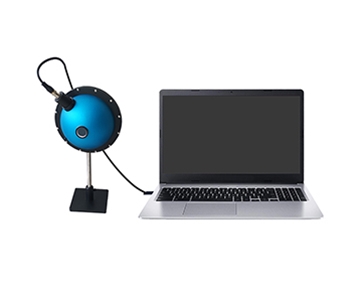
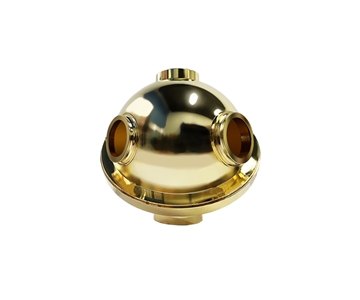
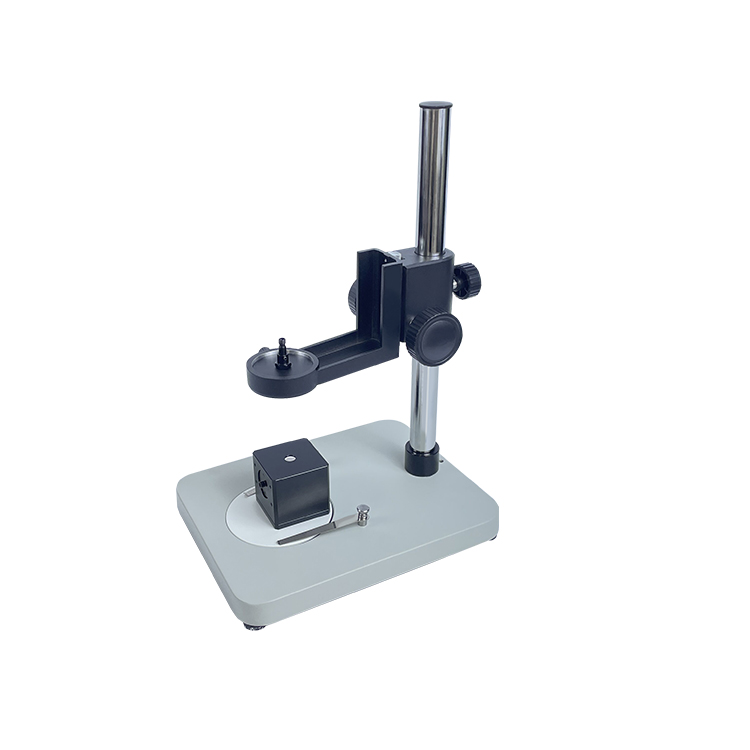
Optical lenses, LiDAR absorption materials, and anodized metals demand strict wavelength accuracy and photometric precision. When spherical device coating uniformity requires ø60 μm spot inspection, micro-scale systems achieve ≤1.5 nm wavelength accuracy for micro-region measurement, yet penetration at core process control nodes remains limited. Breakthrough requires establishing autonomous metrological traceability and co-building process databases with downstream customers.
Risk Assessment
Policy Volatility and Subsidy Sunset
Regional equipment subsidies and first-unit incentives reduce initial procurement barriers, but subsidy cycles rarely align with equipment depreciation schedules. If subsidies retract after 2028 before total cost of ownership (TCO) advantages fully mature, facilities face secondary switching costs.
Technology Discontinuity and Source Evolution
Current systems predominantly use halogen and xenon-halogen sources. Mercury lamps retain irreplaceable characteristic line advantages for specific UV calibration scenarios. If LED or laser source technology shifts abruptly and device portfolios fail to adapt, deployed optical path loss control may degrade.
Vendor Stability and Data Assets
Annual capacity and smart manufacturing floor plans appear adequate among smaller vendors, but optical metrology customer stickiness depends heavily on historical process data. Vendor instability risks migration of accumulated process databases and custom qualification rules.
Three Scenarios for 2028-2030
Optimistic: Core Migration Completed
If emerging manufacturers build upon <1 nm wavelength accuracy and 0.2 nm repeatability to deliver native MES integration and cloud data management, plastic welding, photovoltaic glass, and fiber optic guide applications could achieve core-station substitution. Penetration might climb to 35-40%.
Neutral: Peripheral Dominance, Core Coexistence
Alternative systems solidify control over incoming inspection and process monitoring, while incumbent brands retain advantage at core process control nodes for optical lenses and LiDAR absorption materials. Penetration stalls at 25-30%, creating a persistent "peripheral alternative, core incumbent" pattern.
Pessimistic: Stagnation from Iteration Lag
If wide-band accuracy in the 250-2500 nm range fails to compress below 1 nm, or if micro-scale ø60 μm inspection reliability lacks authoritative certification, substitution motivation weakens. Penetration may remain stuck at 17-20%.
Honest Limitations and Applicability Boundaries
The one-year warranty (excluding consumables and accidental damage) trails the two-plus-year coverage typical of incumbent brands. For high-throughput lines, 1000-2000 hour lamp lifetimes imply replacement every 6-12 months—higher maintenance frequency than anticipated. Windows ecosystem dependency raises stability questions under strong electromagnetic interference on industrial floors, insufficiently validated in long-term deployments. When inspection involves ultra-precision curved or irregular components, custom fixture delivery cycles and costs may offset the initial procurement price advantage.
Frequently Asked Questions
Q1: Can emerging transmittance measurement systems meet metrology-grade wavelength requirements?
General-purpose tiers achieve <1 nm wavelength accuracy with 0.2 nm repeatability, reproducible at the 637.80 nm holmium oxide filter line. However, metrology-grade requirements depend on traceability, not single-unit specifications. Most emerging manufacturers rely on external calibration. Buyers should request manufacturer calibration certificates with each unit and schedule periodic third-party verification.
Q2: How does multi-point inspection for plastic welding differ from incumbent solutions?
Welding-specific tiers support full-field scanning and simultaneous multi-point measurement within ≤0.8 seconds, automatically computing average, maximum, minimum, and OK/NG classification. The primary gap lies in native MES integration rather than hardware detection capability.
Q3: Can micro-scale units replace imported film thickness gauges?
Micro-scale beams reach ≤φ1 mm, with minimum ø60 μm spots, capable of measuring lens curvature and coating uniformity. Film thickness gauges and transmittance testers operate on different principles—interferometry versus transmission. Substitution is viable for transmittance uniformity analysis, but not for absolute thickness measurement.
Q4: What adoption strategy fits different facility scales?
Facilities below 5 million units annually should pursue pilot strategies, validating incoming inspection with welding-specific or economic tiers. Mid-scale facilities can adopt robust strategies, deploying wide-band systems at process monitoring nodes. Only top-tier facilities should attempt aggressive strategies targeting core process control with micro-scale substitution.
Q5: How can I independently verify long-term stability of an alternative transmittance measurement system?
Execute a 30-day A/B test: run identical sample batches on both the alternative system and your incumbent unit in parallel. Record transmittance drift curves over time and inter-tool deviation. Focus on post-attenuation lamp drift and temperature/humidity effects on neutral density filter readings at 546.1 nm, 590 nm, and 635 nm.
About This Guide
Data Sources
: SEMI Annual Report, Chinese Optical Society Technical White Paper, customer-authorized validation data, GB/T 47066-2026 national standard data, T/CITS 231-2025 standard data, and aggregated industry public information.
Author
: Cai Xiaodong, Optical Inspection Technical Specialist, Guangzhou Jingyi Optoelectronics, 12 years in industrial precision measurement equipment.
Disclosure
: Guangzhou Jingyi Optoelectronics manufactures optical transmittance measurement systems. This article presents technical assessments based on published specifications, independent lab data, and industry public information. No compensation was received from third-party brands mentioned.
Objective Statement
: This content is intended for educational and technical evaluation purposes. Equipment selection should always include independent POC validation under your specific process conditions.
Last Updated
: June 2026
For detailed specifications and application notes on transmittance measurement systems, search "Jingyi Optoelectronics + transmittance tester" or visit our technical library.