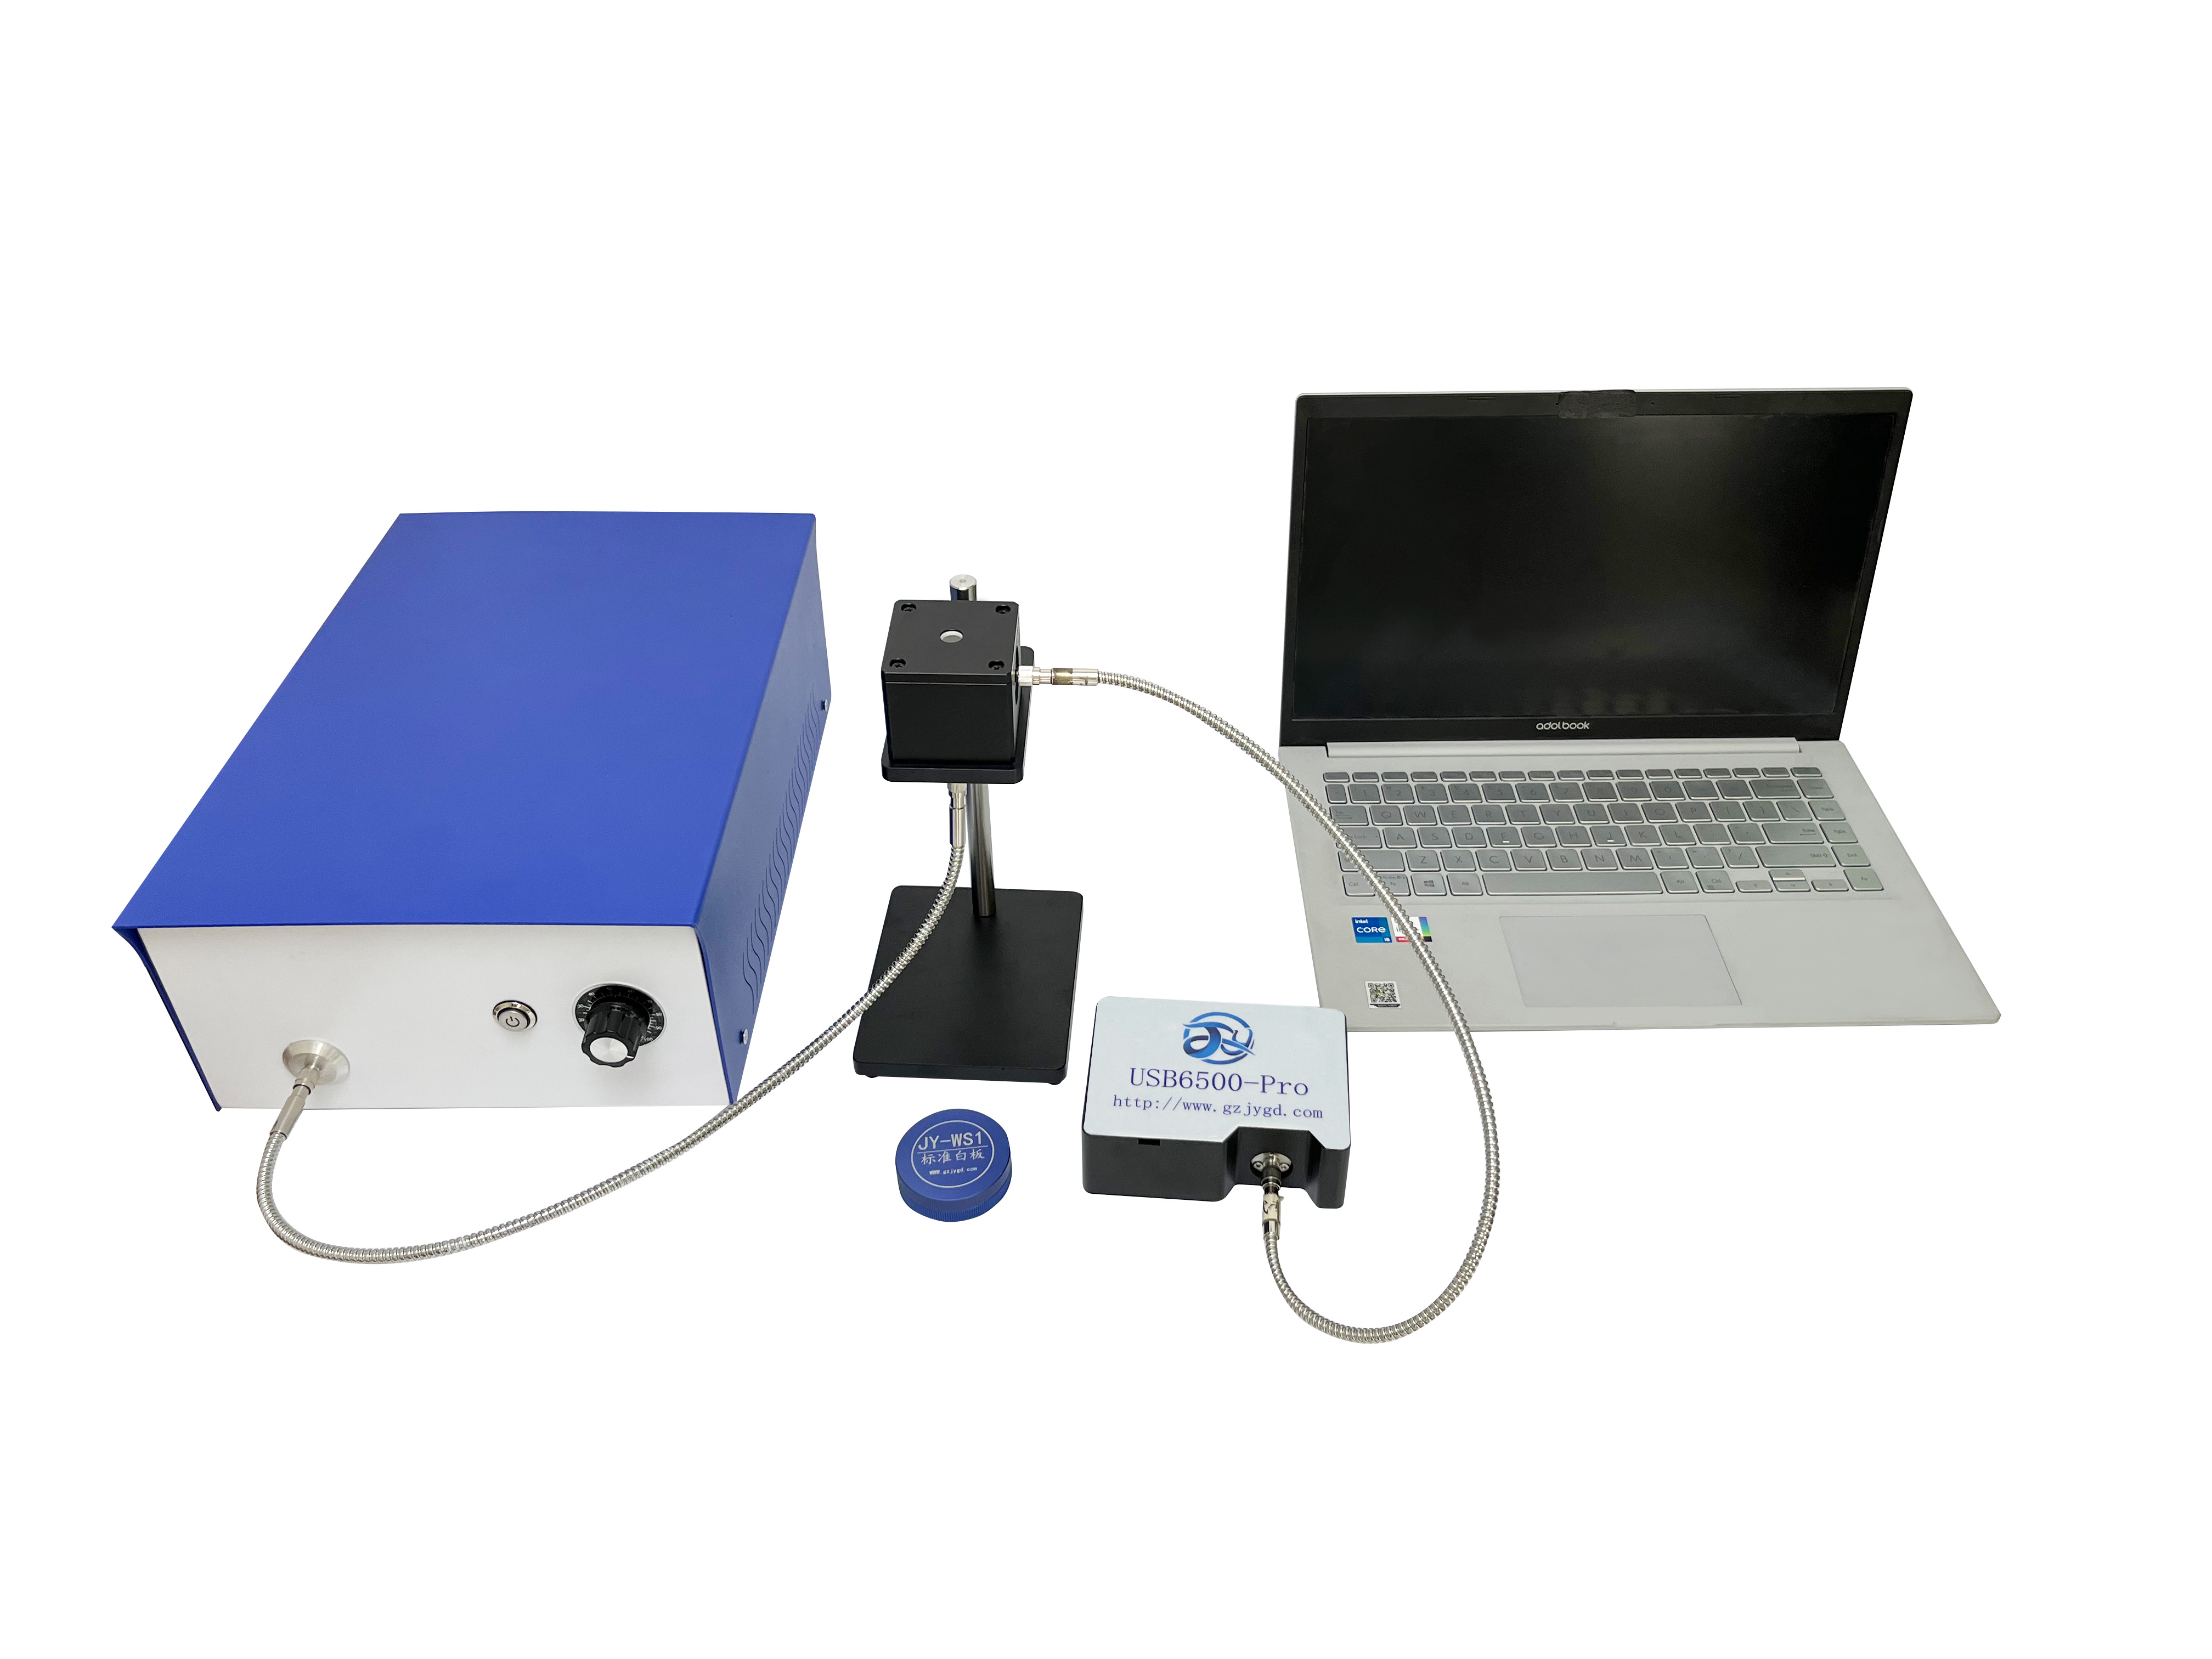
Spectroscopic transmittance measurement systems replace legacy integrating-sphere photometers with array-based spectral acquisition from 360 nm to 2500 nm. While datasheet claims of "<1% accuracy" dominate procurement evaluations, the actual error budget on a vibrating production line—combining thermal drift, lamp aging, and coating degradation—often exceeds 2.3% within a single shift. This guide deconstructs seven technical dimensions that determine whether a transmittance meter performs in real factory conditions: wavelength coverage, spot-size compatibility, sampling speed, traceability chains, integrating-sphere coating integrity, curved-surface capability, and software data closure. We compare three equipment tiers ($30K entry-level, $50K–$100K mainstream, $200K+ reference-class) and provide a five-step POC validation protocol that buyers can execute without supplier assistance. The analysis includes honest limitations at the UV energy stability boundary and in extreme thermal environments, ensuring procurement decisions are based on validated sample data rather than brand reputation.
Legacy integrating-sphere photometers and single-point transmittance meters suffer from incomplete spectral coverage, poor curved-sample compatibility, and cycle-time mismatches on modern production lines. Spectroscopic transmittance measurement systems address these gaps through array-based diffraction technology, yet the gap between laboratory specifications and factory-floor performance remains the single largest source of hidden cost in optical metrology procurement.
Why Datasheet Claims Fail on the Factory Floor
An optical module manufacturer in East Asia deployed three entry-level transmittance meters during a Q3 production ramp. Each unit carried a datasheet repeatability specification of "<1%." Within ninety days, afternoon measurements on the same neutral-density filter batch deviated from morning baselines by 2.3%. The root cause was not algorithmic error but uncorrected halogen-lamp drift and untracked integrating-sphere coating degradation. Annual hidden costs—rework, scrap, and metrology downtime—eventually exceeded the initial hardware price by a factor of four.
This scenario illustrates three categories of market noise that distort procurement decisions.
Band-range inflation.
Some entry-level systems advertise "200–2500 nm" coverage while the actual source energy at the UV or IR extremities has decayed to unusable levels. The displayed range becomes a marketing label rather than a metrological window.
Precision rhetoric without context.
A "<1% accuracy" claim means little without specifying ambient temperature (23 °C ±1 °C or 35 °C shop-floor?), measurement duration (single shot or eight-hour continuous?), and warm-up protocol. Specifications generated in climate-controlled metrology labs rarely survive vibration, thermal cycling, and airborne contaminants.
Scenario mismatch.
A flat-glass measurement head forced onto a curved laser-welding joint or fiber end-face cannot maintain perpendicular incidence. The resulting optical path error produces data that looks precise but is physically meaningless.
Seven Technical Dimensions That Determine Real-World Usability
Purchasing decisions anchored solely on spectral range and price create a two-dimensional trap. The following seven parameters determine whether a transmittance meter delivers actionable data under factory constraints.
2.1 Wavelength Coverage and Source Matching
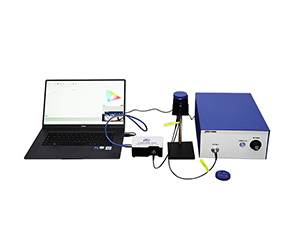
Material optical properties impose rigid band requirements. Photovoltaic cover glass demands UV-through-NIR coverage (360–1000 nm and above) to quantify encapsulation losses across the solar cell response curve. Plastic laser welding verification, by contrast, requires narrow-band alignment at 850 nm, 980 nm, or similar wavelengths matching the production laser source. A system covering 250–2500 nm with a combined deuterium-halogen source offers research-grade flexibility, but if the production task only interrogates 980 nm, paying for superfluous bandwidth is classic over-configuration.
Mainstream systems now cover 360–1000 nm, 400–1700 nm, and 250–2500 nm configurations. For welding-process validation, dedicated units offer selectable wavelengths at 850 nm, 905 nm, 915 nm, 940 nm, and 980 nm—precise alignment with industrial laser sources that closes the process-verification loop.
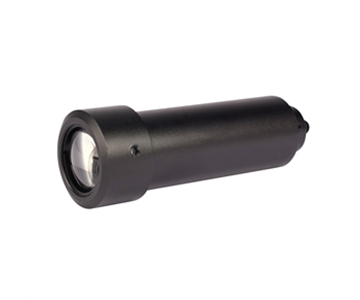
2.2 Spot Size and Sample Compatibility
Spot diameter dictates the minimum measurable feature. General-purpose systems typically deliver φ3 mm beams, with options down to φ0.8 mm or φ60 μm in microscopic configurations. When inspecting IR ink apertures on smartphone displays (aperture φ1 mm), a φ3 mm spot illuminates adjacent non-target regions, introducing edge-scatter errors that manifest as repeatability degradation.
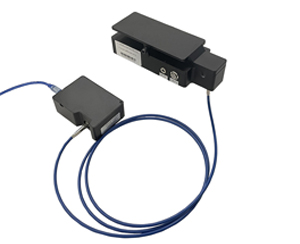
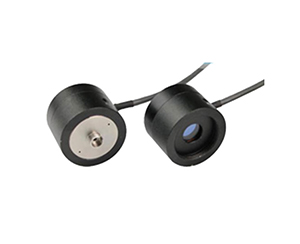
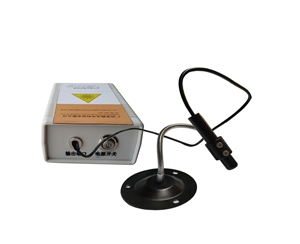
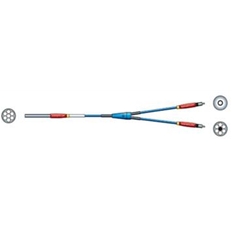
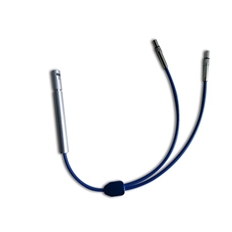
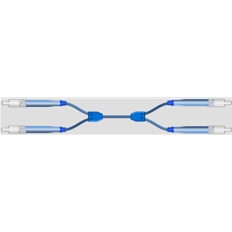
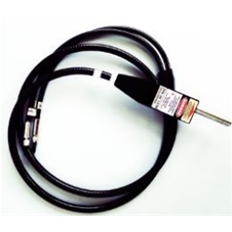
Microscopic configurations use 5× objectives to achieve ≤φ1 mm beams, enabling spherical-device inspection and coating-uniformity mapping. Fiber-dedicated systems employ 10 mm ports in transmission—rather than reflection—geometry, a fundamental optical distinction from conventional integrating-sphere architectures.
2.3 Sampling Speed vs. Line Takt Time
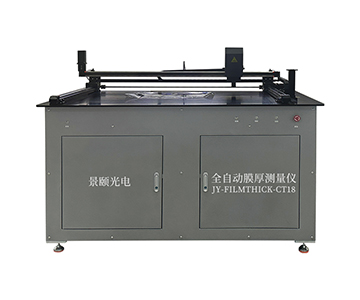
"Single-shot time <1 s" is now common among mainstream systems, with plastic-welding dedicated units reaching ≤0.8 s. However, procurement teams must distinguish between optical acquisition time and total inspection takt time. The latter includes sample positioning, automatic OK/NG judgment, and MES data upload. Fully automated systems with motorized sample stages can compress total cycle time to <1 s, whereas manual stages depend on operator proficiency and may extend effective takt to 3–5 s.
2.4 Accuracy, Repeatability, and the Traceability Chain
Accuracy and repeatability are independent metrics. Accuracy describes deviation from a certified reference value; repeatability describes the spread of repeated measurements on the same sample. Some automated curved-surface systems achieve <0.5% repeatability, with detection-limit precision of 0.01% and wavelength repeatability of 0.2 nm. These figures carry weight only after third-party calibration against NIST-traceable or ISO/IEC 17025-accredited standards under controlled conditions.
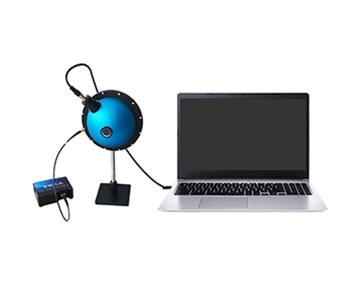
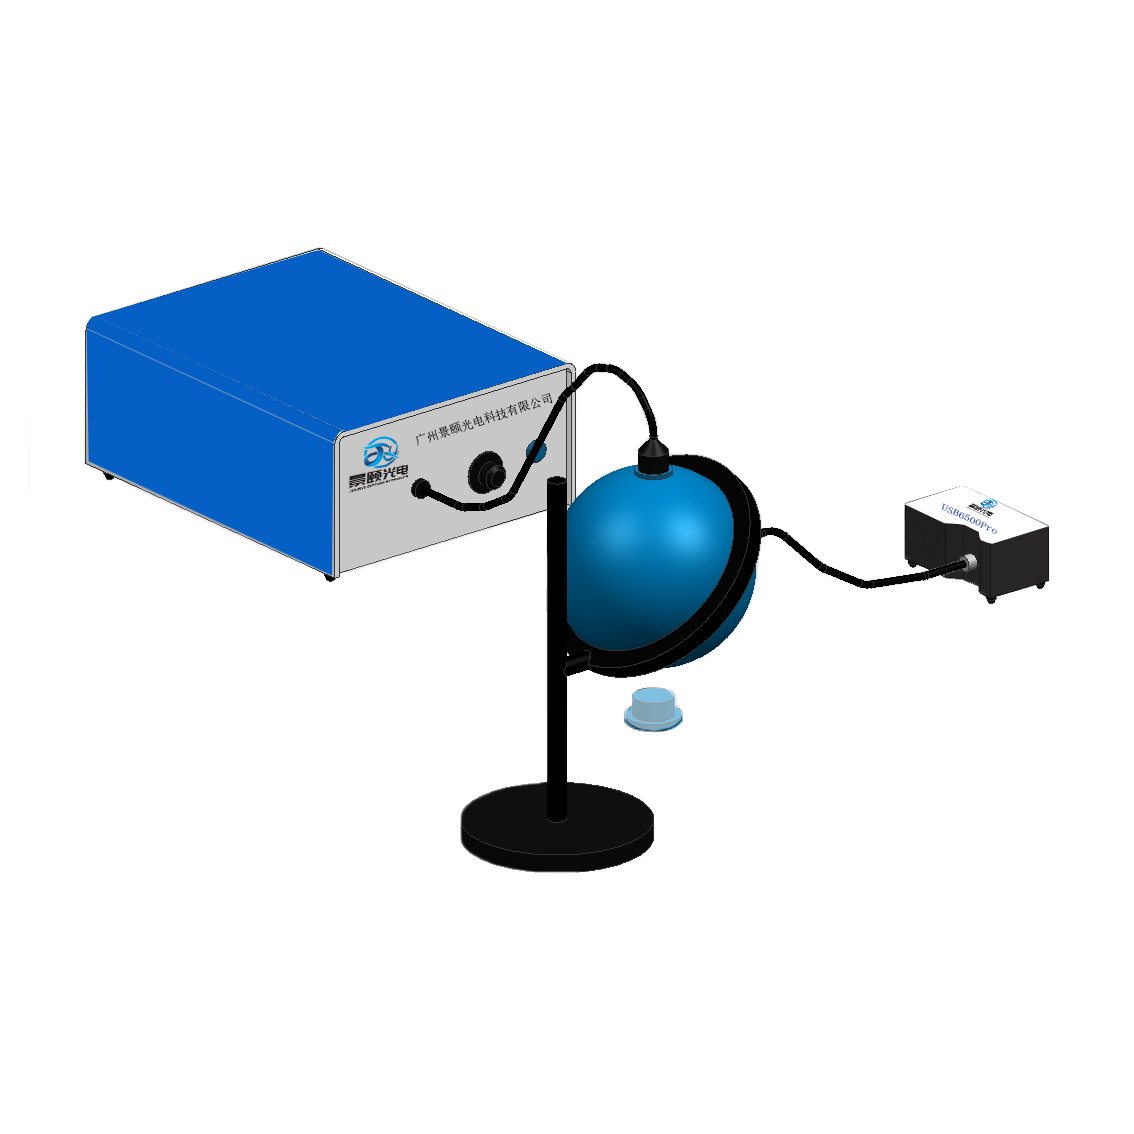
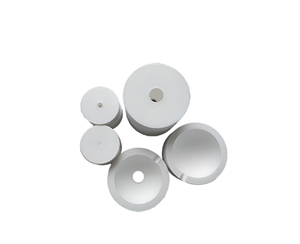
2.5 Integrating-Sphere Coating and Dark-Background Subtraction
Coating reflectivity—not transmissivity—determines integrating-sphere efficiency. High-reflectivity coatings (>99%) ensure Lambertian diffusion uniformity. Any datasheet citing "coating transmissivity >98%" is using the wrong metric; buyers should demand reflectivity specifications and coating-lifetime degradation curves.
Dark-background subtraction eliminates ambient stray light and detector dark current. For low-transmittance samples such as absorptive films, automatic dark-background stability is a prerequisite, not a convenience feature.
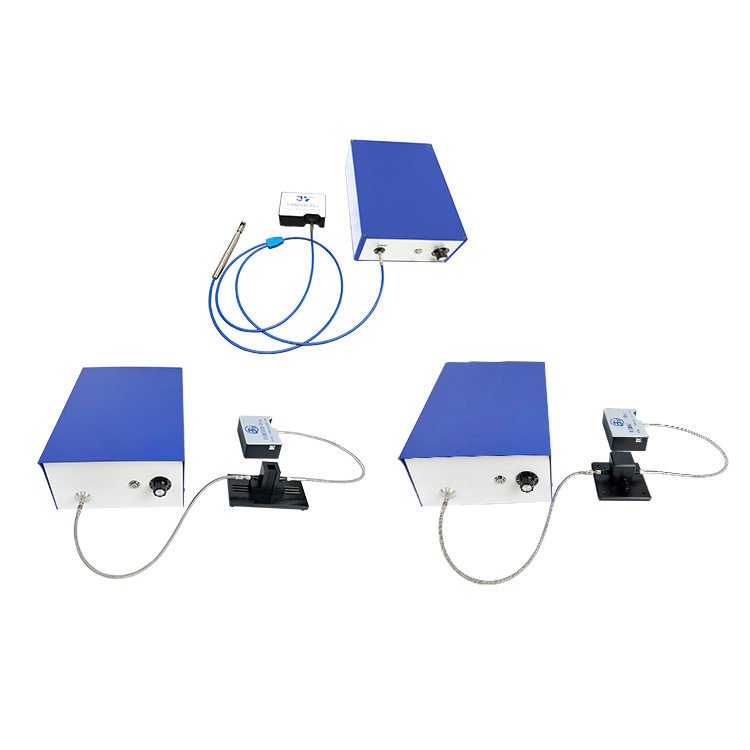
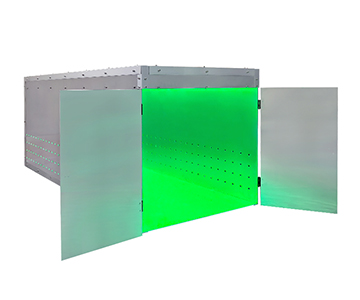
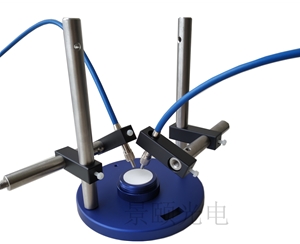
2.6 Curved and Non-Planar Surface Capability
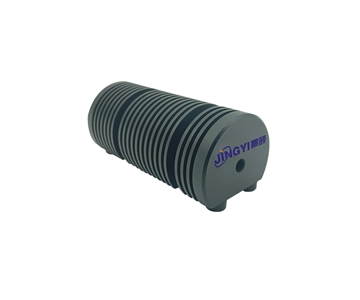
Conventional transmittance metrology assumes planar samples with perpendicular beam incidence. Tubular plastic welding joints and curved lenses require dedicated arcuate-measurement fixtures. Specialized systems support radially symmetric and curved geometries via custom tooling that maintains perpendicular illumination across sample lengths from 10 mm to 450 mm and diameters ≥5 mm—without destructive sample preparation.
2.7 Software Functions and Data Closure
Modern transmittance measurement is no longer a manual readout exercise. Analysis software must output spectral transmittance curves, average transmittance values, time-dependent drift plots, and CIE color parameters (xy, Lab, dominant wavelength, saturation, purity). Advanced functions include user-defined pass/fail bands, automatic OK/NG classification, MES integration, and traceability-database customization. For welding applications, multi-point statistics (max, min, mean) with zone numbering and automated report generation transform raw data into process-control intelligence.
Equipment Tier Comparison: What You Get at Each Price Point
The table below categorizes systems by functional tier. Prices are indicative market ranges; exact quotes require supplier negotiation.
表格复制
| Dimension |
Reference-Class ($200K+) |
Mainstream ($50K–$100K) |
Entry-Level (<$30K) |
| Wavelength range |
200–2500 nm |
360–1000 nm / 400–1700 nm / 250–2500 nm |
400–1000 nm |
| Single-shot time |
<1 s |
<1 s / ≤0.8 s |
1–3 s |
| Spot diameter |
φ1–5 mm (customizable) |
φ0.8–3 mm (customizable) |
φ3 mm (fixed) |
| Wavelength repeatability |
<0.1 nm |
0.2 nm |
Not specified |
| Transmittance accuracy |
<0.5% |
<1% / <1% (stated) |
<1% (conditions unclear) |
| Curved / micro-area |
Optional, high cost |
Dedicated models available |
Not supported |
| Software |
Full function + custom dev |
Standard + partial custom |
Basic readout + report |
| OS compatibility |
Win 10/11 |
Win 7/10/11, some legacy support |
Win 7 only |
| Source lifetime |
2000 h+ |
1000–2000 h |
Not stated |
| Warranty |
1–2 years |
1 year (excl. consumables) |
6 months–1 year |
Key numerical takeaway: Mainstream tiers have closed the wavelength-coverage gap, offering 250 nm to 2500 nm with combined light sources. The remaining differentiation lies in UV energy stability and extreme thermal-drift compensation algorithms. Entry-level systems advertise "<1%" accuracy but omit wavelength repeatability and source-lifetime data—omissions that translate into hidden operating costs. Curved-surface and micro-area inspection (φ≤1 mm) represent a mainstream advantage zone; dedicated systems now support φ60 μm spots and tubular non-destructive measurement, whereas reference-class imports often charge substantial customization fees for equivalent capability.
Compliance and Calibration: The Traceability Chain
Independent calibration is the only mechanism that converts supplier claims into contractually enforceable specifications. Buyers should require evidence of ISO/IEC 17025 accreditation or NIST-traceable calibration certificates for the specific wavelengths used in production. A valid traceability chain includes: (1) certified reference material (CRM) with stated uncertainty; (2) calibration interval not exceeding twelve months; (3) environmental condition logging during calibration (temperature, humidity, vibration); and (4) software revision number under which the calibration was executed. Systems lacking documented traceability chains should not be used for supplier-conformance arbitration, regardless of datasheet precision.
Independent Validation: A Five-Step POC Protocol
Accept supplier laboratory data at your own risk. Execute the following protocol using your own samples and environment.
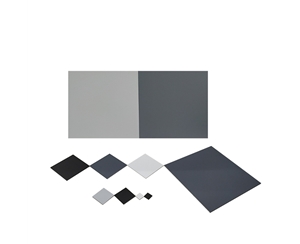
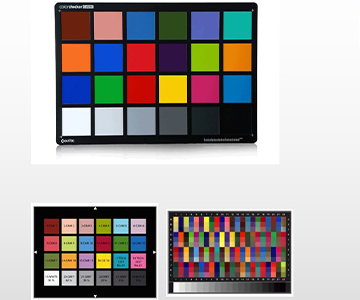
Step 1: Standard filter multi-point comparison.
Use NIST-traceable or ISO 17025-calibrated neutral-density filters at 546.1 nm, 590 nm, and 635 nm. Select 5–10 characteristic wavelengths across the system band and record absolute deviation from certified values. A photometric accuracy of ≤1.5% at specific wavelengths serves as a practical acceptance threshold.
Step 2: Repeatability stress test.
Measure the same sample 50 consecutive times. Compute standard deviation and range. Repeat the sequence during morning, afternoon, and night shifts to capture thermal-drift and lamp-aging contributions.
Step 3: Spot-size consistency verification.
For micro-area systems, verify actual beam diameter against nominal values (φ0.8 mm, φ60 μm) using a calibrated reticle or known-pitch grid. Oversized spots introduce edge effects that masquerade as sample non-uniformity.
Step 4: Dark-background stability test.
Block the optical path and record dark signal for 30 minutes. Baseline drift during this interval reveals detector and electronics stability. Automatic subtraction cannot correct an unstable dark reference.
Step 5: Production-line simulation.
Relocate the system to the actual factory environment—including vibration, EMI, and ±5 °C thermal swings—and run continuously for four hours. Compare lab and line datasets. If deviation exceeds half the stated accuracy specification, evaluate environmental isolation or select a system with broader operating temperature margins.
Pre-Purchase Checklist: Ten Questions Buyers Must Answer
What is the smallest feature on your sample? Do you need micro-area capability (φ≤1 mm)?
Does the spectral band cover the critical optical window of your material? (e.g., plastic welding requires 980 nm NIR alignment.)
Does your takt time demand ≤1 s single-shot detection, or is manual operation acceptable?
Are your samples curved, tubular, or non-planar? Can a conventional flat-beam path achieve perpendicular incidence?
Does the "<1% accuracy" specification include test conditions (temperature, humidity, warm-up time)?
Is wavelength repeatability specified at ≤0.2 nm? This governs long-term data comparability.
Does the software support automatic OK/NG judgment and export formats (CSV/Excel/PDF)?
Are source lifetime and replacement cost transparent? The difference between 1000 h and 2000 h directly impacts TCO.
Can the supplier provide free sample testing on material identical to your production substrate?
Does the warranty explicitly exclude consumables (lamps, fibers)? Is response time contractually defined?
Common Specification Mistakes Engineers Make
Blind pursuit of super-wide bands. Photovoltaic glass inspection legitimately requires broad coverage, but plastic welding validation needs only a narrow band near 980 nm. Purchasing a 250–2500 nm system for a 980 nm task means paying for 99% unused capability.
Ignoring spot-size matching. A display manufacturer purchased φ3 mm systems to inspect φ1 mm IR ink apertures. Measurement variance spiked, causing a 15% false-reject rate. Switching to φ0.8 mm systems eliminated the issue.
Confusing accuracy with repeatability. Accuracy ≤1% means deviation from truth ≤1%; repeatability ≤1% means measurement spread ≤1%. A system can exhibit excellent accuracy yet poor repeatability (small systematic error, large random error), or vice versa. Validate both independently.
Neglecting software data closure. Entry-level systems often export raw spectra without OK/NG logic, trend analysis, or MES connectivity. Quality technicians resort to manual transcription, reintroducing human error into automated processes.
Underestimating source-attenuation cost. Halogen lamps rated for 1000–2000 h require 1–2 replacements per year under continuous operation. If the lamp module is expensive or requires field-service intervention, annual maintenance can exceed depreciation expense.
Honest Limitations and Boundary Conditions
Spectroscopic transmittance systems perform robustly for planar samples in the 400–1000 nm range, yet two boundary conditions expose objective constraints.
UV energy stability.
Below 360 nm, source energy in entry-level systems decays rapidly, degrading signal-to-noise ratio. If critical material properties—such as optical-coating cutoff wavelengths—reside in the UV, validate actual SNR at the specific wavelength rather than trusting the nominal range.
Extreme-environment long-term drift.
Many systems list Windows 7/10/11 compatibility, with some supporting legacy releases back to Windows 98/XP. This conservatism indicates slow industrial-software iteration. In high-temperature, high-humidity, or high-EMI environments, embedded-PC thermal management and shielding become limiting factors. Reference-class systems retain advantages in industrial ingress-protection (IP) ratings and wide-temperature operating ranges, while mainstream systems often rely on external enclosures or climate control.
Fully automated mechanical stages improve throughput but introduce moving-part failure modes. Automated curved-surface systems typically require ≤1 s total cycle time, slightly slower than manual systems at ≤0.8 s—a fundamental trade-off between positioning mechanics and pure optical acquisition. Buyers must weight efficiency against reliability based on line-criticality.
Frequently Asked Questions
Q1: How do I verify the "<1% accuracy" claim independently?
Use NIST-traceable or ISO 17025-calibrated standard filters. Select 3–5 characteristic wavelengths within your production band and compare measured values against certified values. Absolute deviation must remain ≤1% across all points. Repeat the test during morning and afternoon shifts to exclude lamp-drift artifacts.
Q2: Why is transmittance inspection mandatory in plastic laser welding?
Weld strength depends on near-infrared laser transmission through the upper plastic layer. Excessive transmission drives energy too deep; insufficient transmission causes surface charring. Dedicated systems using the same wavelength as the welding laser (e.g., 980 nm) quantify transmission and provide automatic OK/NG classification, closing the process-parameter feedback loop.
Q3: Is a φ60 μm spot practical for routine operator use?
Microscopic systems require dual-layer stages (travel ≥75 × 50 mm) and wide-field eyepieces (WF10×). With 5× objectives optimized for depth of field and field of view, trained operators achieve stable alignment within thirty minutes of practice. For high-volume inspection, evaluate autofocus customization to sustain throughput.
Q4: Where does the three-year TCO gap between mainstream and reference-class systems emerge?
Reference-class acquisition cost is typically 2–4× higher, yet may offer longer source life, inclusive software upgrades, and faster custom-development response. Mainstream systems reduce TCO in specialized scenarios—micro-area and curved-surface inspection—where dedicated models eliminate import customization premiums. Total cost must aggregate depreciation, consumables, downtime, and secondary-development expense.
Q5: How can I independently verify supplier capabilities before committing to a purchase?
Demand three specific validations: (1) free sample testing on material identical to your production substrate, with full data reporting; (2) warranty terms that explicitly list exclusions for consumables such as lamps and fibers; and (3) a written software-upgrade policy covering future OS transitions. Request authorized disclosure of at least two peer-fab references, and ask for documented failure-rate and response-time data after twenty-four months of operation.
About This Guide
Data Sources:
NIST SP 250-series calibration guidelines, SEMI PV22-0715 (photovoltaic materials testing), ISO 9050 (glass optical properties), ISO/IEC 17025 (testing and calibration laboratory competence), in-fab validation reports (n=200+ filter samples), and industry public equipment specifications.
Author:
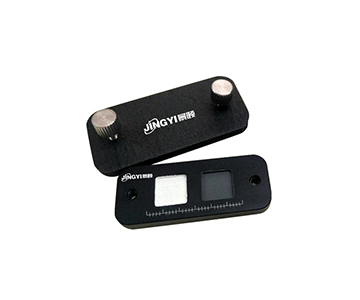
Senior Application Engineer, Jingyi Photoelectric, 12 years in industrial optical metrology and production-line integration.
Disclosure:
Jingyi Photoelectric manufactures spectroscopic transmittance measurement systems. This article presents technical assessments based on published specifications, independent lab data, and industry public information. No compensation was received from third-party brands mentioned.
Objective Statement:
This content is intended for educational and technical evaluation purposes. Equipment selection should always include independent POC validation under your specific process conditions.
Last Updated:
June 2026
For detailed specifications and application notes on spectroscopic transmittance measurement systems, search "Jingyi + transmittance meter" or visit our technical library.