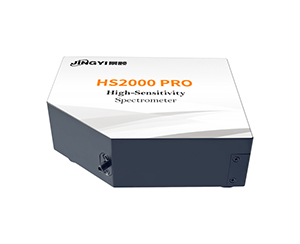
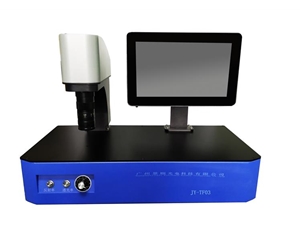
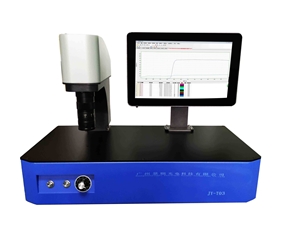
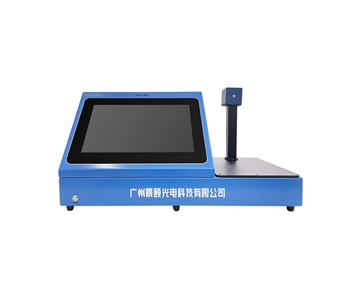
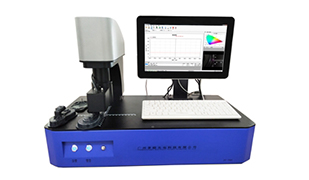
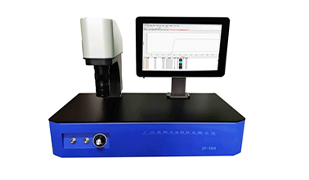
In today's optical inspection field, spectral quality analyzers have become essential tools in numerous scientific research and industrial sectors owing to their excellent performance and wide-ranging applications. Jingyi Optics has long been committed to the R&D and innovation of spectrometer technology, and its HS2000PRO Spectral Quality Analyzer demonstrates advantages in multiple aspects, featuring technologies such as a high-sensitivity back-illuminated CCD and a dual-blazed grating design.
Core Technical Principles of Spectral Quality Analyzers
Aberration
Aberration is an unavoidable phenomenon in practical optical systems, arising from discrepancies between non-paraxial ray-tracing results and paraxial ray-tracing results, as well as deviations from the ideal conditions of Gaussian optics. In spectrometers, aberration typically manifests as the failure of light from a single point to converge to a point after passing through the system, resulting in "blurring" or "distortion" of the spectrum. Aberrations are caused not only by defects in optical components, but more significantly by the inability of simple paraxial theory to simulate the effects of optical systems on light rays. Common types of aberration include:

Chromatic Aberration
Light rays of different wavelengths are focused to different points by the lens, thereby forming fringe patterns in the spectrum.
Coma
An asymmetric transverse aberration produced when an off-axis object point is imaged with a wide beam.
Astigmatism
Light rays propagating in two perpendicular planes are focused at different distances by the lens, leading to partial focusing and partial blurring of the image.
Spherical Aberration
Edge rays and central rays of the lens exhibit different focusing degrees, blurring the sharp edges of objects.
Precision optical instruments and thin-film coatings can be adopted to mitigate the effects of aberrations. Aberrations cause the spectral peak shape at narrow slits to deviate from the Gaussian distribution, and they limit optical resolution particularly when the entrance slit size of the spectrometer is small.
Absolute Irradiance Calibration
Absolute irradiance calibration involves calibrating the response intensity of each pixel in the spectrometer using a lamp with a known spectral output power. This calibration modifies the overall shape and magnitude of the spectrum and corrects the instrument's individual Instrument Response Function (IRF). The calibrated spectrum is expressed in terms of power output per unit area per unit wavelength, typically denoted as µW/cm²·nm. It should be noted that "absolute irradiance" is not the precise technical term for this quantity; the accurate term is absolute spectral irradiance.
Absorbance
Absorbance is a physical quantity that measures the degree to which light is absorbed when passing through a solution or substance. It is defined as the base-10 logarithm of the ratio of the incident light intensity before transmission to the transmitted light intensity after passage (lg(I0/It)), where I0 is the incident light intensity and It is the transmitted light intensity. Absorbance is affected by factors such as solvent, concentration, and temperature. The absorptivity is related to the wavelength of incident light and the substance through which the light passes; for a given substance at a fixed wavelength, the absorptivity remains constant.
According to Beer's Law, when a beam of parallel monochromatic light passes vertically through a homogeneous, non-scattering absorbing medium, the absorbance A is directly proportional to the concentration c of the absorbing substance and the absorption path length l, and inversely proportional to the transmittance T. Transmittance T is the ratio of transmitted light intensity It to incident light intensity I0, and it decreases with increasing path length and concentration. Absorbance can be calculated from transmittance T.
In multi-component systems, if the light-absorbing species of each component do not interact with one another, the total absorbance equals the sum of the absorbances of the individual components. This principle enables the simultaneous determination of multi-components and the measurement of equilibrium constants for certain chemical reactions.
In absorbance measurements, to compensate for the absorption, reflection, scattering, and other effects of the cuvette, solvent, reagents, etc., on incident light, a double-beam spectrophotometer can be used, with matched cuvettes of identical optical properties and thickness holding the test solution and reference solution respectively.
Analog Input/Output
The spectrometer communicates with external devices via analog input/output pins. The voltage at the output pins can be incrementally varied within a specified range to control external devices. For instance, a lamp controlled by an analog output pin can alter its intensity based on the voltage generated by the spectrometer. Analog input pins accept variable voltages from external devices to modify certain characteristics of the spectrometer system, such as trigger delay. Unlike GPIO pins, which only have on/off states, analog input/output pins support gradual, continuous variation.
Analog-to-Digital Converter (ADC)
The analog-to-digital converter is a key component in spectrometers, responsible for converting the voltage signals from the detector into digital signals, which are then transmitted to a computer for processing and graphical display. Incident photons generate electrons in the detector pixels, which are converted to digital signals by the ADC. The data transmission rate to the computer is measured in MHz (megahertz, millions of cycles per second).
However, the maximum clock speed of the detector is typically the limiting factor for the overall speed of the spectrometer system, and the speed of other electronic components in the device also affects the overall spectral acquisition rate. Therefore, the speed or resolution of the ADC alone cannot fully characterize the performance of the spectrometer.
Auto-Zero
The auto-zero function is used to adjust the baseline return, resetting the baseline to a user-specified level. When measurements of the same light source are performed using two different spectrometers, this function aligns the baselines of the different instruments to a comparable state, ensuring the comparability of the output spectrograms.
Averaging (Temporal and Spatial)
Two forms of signal averaging—temporal and spatial—can be applied during spectral viewing or acquisition.
Temporal Averaging
The amount of spectral information captured is increased by calculating the average output of individual pixels across multiple spectral scans. Although this process takes longer than a single scan, it improves the Signal-to-Noise Ratio (SNR) and stabilizes fluctuating data. The SNR increases with the square root of the number of temporal averages.
Spatial Averaging (Moving Smoothing Method)
The values of adjacent pixels are averaged to visually smooth single-scan results, boosting the SNR at the cost of optical resolution. Spatial averaging is useful for relatively flat spectra with small variations between adjacent pixels, but it impairs the resolution of sharp spectral features. The SNR increases with the square root of the number of pixels averaged.
Background Spectrum and Dark Spectrum
The background spectrum is the output spectrum of the spectrometer in the absence of a sample. The dark spectrum refers to the signal generated by the detector, circuitry, optics, and other components when no light enters the spectrometer at all.
For example, in reflectance measurements using a fiber-coupled light source under ambient indoor lighting, ambient light may enter the incident fiber even when measuring a perfectly black sample, causing the black sample to register a non-zero reflectance reading. Blocking the incident fiber cuts off all light, including the background spectrum. When acquiring a background spectrum, the fiber-coupled light source should be turned off to account only for ambient background light.
The background spectrum differs from the dark spectrum, which is used to correct baseline return and fixed-pattern noise.
Band Gap
In semiconductors such as silicon detectors, the band gap is the electron energy difference between the top of the valence band and the bottom of the conduction band. When photons with energy matching the band gap strike the detector, electrons are excited from the valence band to the conduction band and accumulate in the pixel "well" for processing. The stored charge is removed from the detector and transmitted to the ADC for processing to form the spectrum.
Nevertheless, electrons can also be thermally excited, and the detector cannot distinguish these thermally generated electrons from those produced by photon absorption—these unwanted electrons are the source of dark noise. Since photon energy decreases with increasing wavelength, infrared photons above 1100 nm cannot be detected by silicon CCDs. Infrared spectrometers commonly employ InGaAs detectors, which possess a smaller band gap and a higher wavelength cutoff. However, the smaller band gap also results in higher dark noise from thermally excited "thermal noise" electrons.
Baseline Drift
Baseline drift in a spectrometer refers to the overall deviation of the average baseline return caused by temperature variations. As temperature rises, the impact of dark noise increases, but electronic compensation may either increase or decrease with temperature. For instance, the baseline of the Sony ILX511B detector decreases with rising temperature, as negative electronic compensation masks the slight baseline increase induced by dark noise. Theoretically, temperature changes could produce equivalent and opposing effects across the detector, resulting in no baseline drift.
Baseline Noise
Baseline noise is the sum of readout noise, dark noise, and electronic noise. It is quantified by setting the spectrometer to the minimum integration time to minimize dark noise, blocking all incoming light, recording 100 spectral readings, and calculating the average of the standard deviations of the output for each individual pixel to obtain the minimum baseline noise of the device. While baseline noise is not a figure of merit, it can be utilized to calculate the dynamic range.
Baseline Return (Baseline Compensation)
Baseline return is the value displayed by the instrument when no light is incident. These values vary slightly across each pixel of the detector, and the final profile of the inter-pixel return differences constitutes fixed-pattern noise. Baseline return is governed by three fundamental factors: electronic compensation, dark current, and readout noise. The single average value of the instrument can be computed by averaging the baseline return across all detector pixels.
Bend Radius
The bend radius is the minimum radius of a circle into which an optical fiber can be bent without risk of damage. A smaller value indicates a tighter allowable bend. Bend radius is a function of fiber diameter: larger fibers exhibit greater rigidity and a larger minimum bend radius. Bend radius is classified into Long-Term Bend Radius (LTBR) and Short-Term Bend Radius (STBR), serving as the minimum allowable radii for storage conditions and handling/operation, respectively.
High Efficiency (Diffraction Gratings)
All ruled or holographically etched gratings are optimized for first-order spectra in specific wavelength regions. The range where efficiency exceeds 30% is defined as the "high-efficiency" region. In some cases, the spectral range of a grating exceeds its effective diffraction range. For example, the Ocean Optics Grating 1 has a spectral range of 650 nm, but high efficiency is achieved over a 375 nm span from 200 nm to 575 nm. At wavelengths longer than 575 nm, light intensity detected on the sensor drops significantly due to reduced grating efficiency.
Bidirectional Reflectance Distribution Function (BRDF)
The Bidirectional Reflectance Distribution Function (BRDF) describes the ratio of radiant power exiting a surface in a specified output direction to the radiant power incident on the surface from a specified input direction. Since both input and output directions are two-dimensional, the full function is four-dimensional.
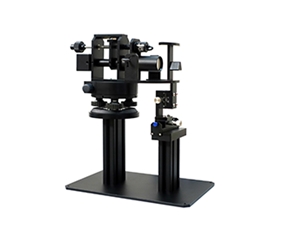
Conventional BRDF does not incorporate a wavelength term, rendering it of limited utility for spectral analysis and a poor model for most surfaces. This limitation can be addressed by adding an incident wavelength term. A complete BRDF measurement requires a goniometer setup, but in most applications, a simplified subset or approximation is sufficient. For example, surfaces typically exhibit only diffuse reflection (45° input angle, 0° output angle) and specular reflection (0° input angle, 0° output angle).
Blaze Wavelength of Diffraction Gratings
For ruled (etched) gratings, the blaze wavelength is the peak wavelength of the grating efficiency curve. The triangular groove tilt of etched gratings is engineered to enhance the intensity of a specific diffraction order at a target wavelength.
Holographic gratings feature a sinusoidal groove structure, delivering lower peak intensity than ruled gratings but reduced stray light due to lower scattering levels. Holographic gratings do not have a blaze wavelength.
Blue Light Hazard
Blue light hazard refers to the potential retinal damage caused by wavelengths in the 400–500 nm range of the visible spectrum. Light below 430 nm is considered to pose a relatively severe risk to the retina. Spectrometers can provide detailed data for all relevant wavelengths of a light source, rather than reducing the entire spectrum to simple xy chromaticity coordinates.
Moving Average
The moving average method is a form of spatial averaging that eliminates noise and improves SNR by averaging the values of adjacent pixels, at the expense of optical resolution. It is suitable for relatively flat spectra with minor inter-pixel variations, but a trade-off between smoothing and spectral resolution must be made when the total number of pixels included in the average exceeds the pixel resolution of the spectrometer.
In Ocean Optics software, the input width value defines the number of pixels averaged to the left and right of a single pixel. For example, a moving average width of 4 corresponds to averaging 9 pixels in total, increasing the SNR by a factor of 3.
Back-Illuminated CCD Detector
Multiple structures on the front side of conventional silicon CCD detectors attenuate photon penetration across all wavelengths, particularly for photons below 450 nm. Photons below 400 nm are partially blocked, resulting in poor response of standard silicon detectors in the ultraviolet wavelength range. Back-thinned detectors overcome this limitation by illuminating the thinned, etched backside of the detector chip.
#SpectralQualityAnalyzer #FiberOpticSpectrometer #Spectrometer #SpectralMeasurementInstrument #CooledSpectrometer