JINGYI Jing Yi
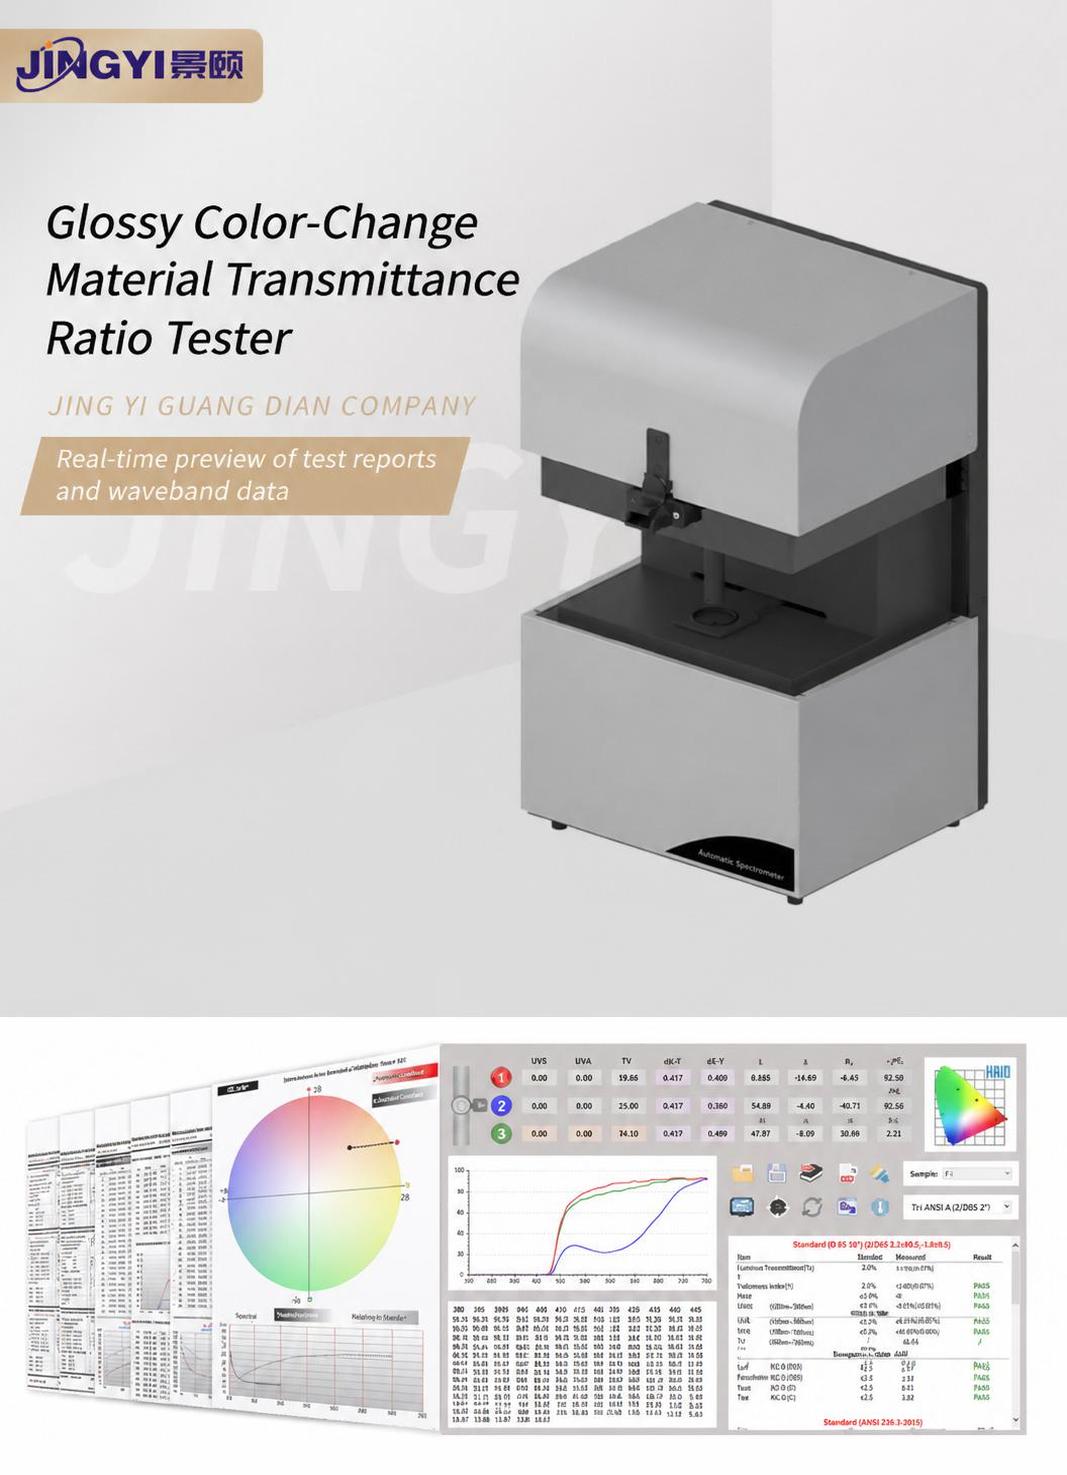
Photochromic material transmittance tester
JING YI GUANG DIAN COMPANY
Real time preview of test reports and wavelength data
Automatic Spectrometer
Report Type
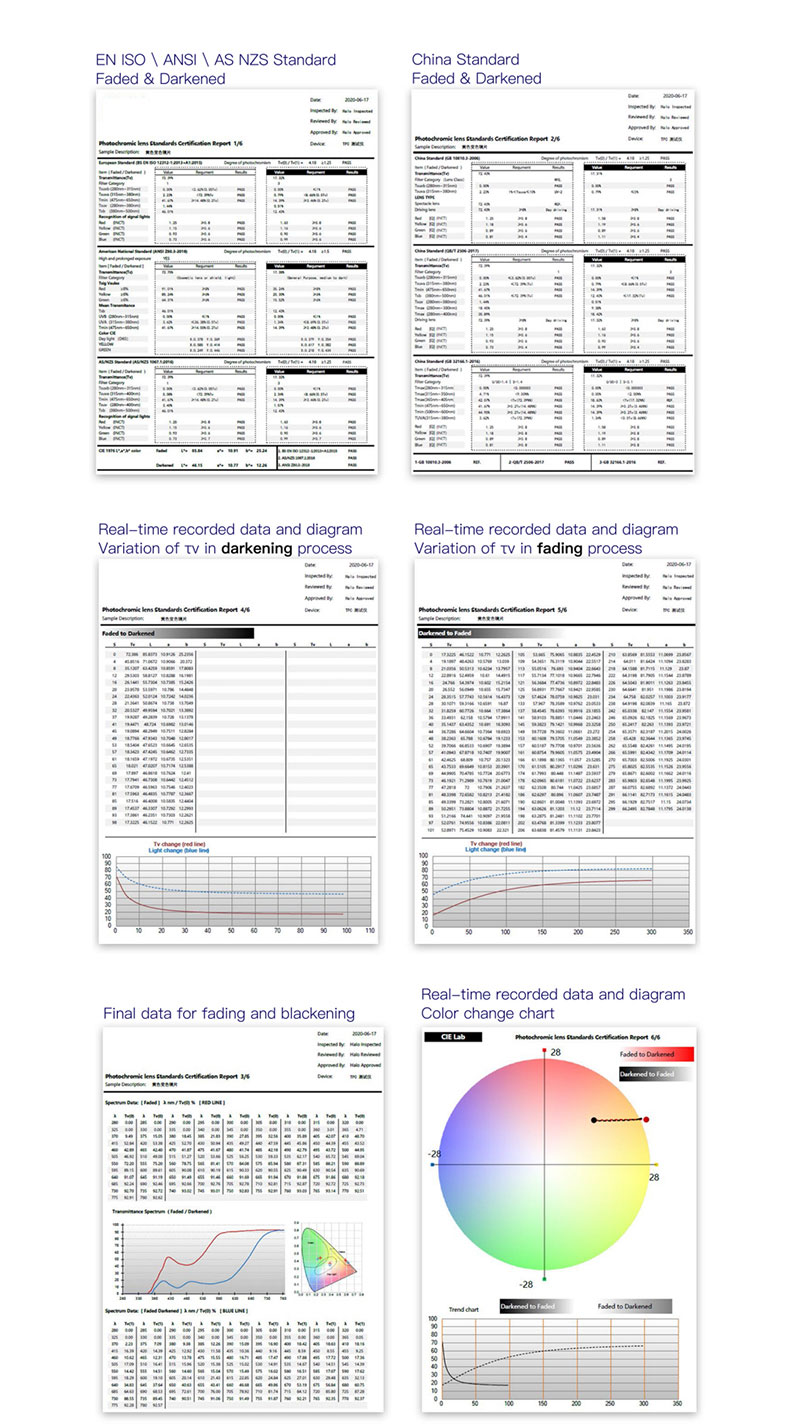
- EN ISO \ ANSI \ AS NZS Standard Faded & Darkened
- China Standard Faded & Darkened
- Real-time recorded data and diagram Variation of Tv in darkening process
- Real-time recorded data and diagram Variation of Tv in fading process
- Final data for fading and blackening
- Real-time recorded data and diagram Color change chart
Software functions and technical specifications
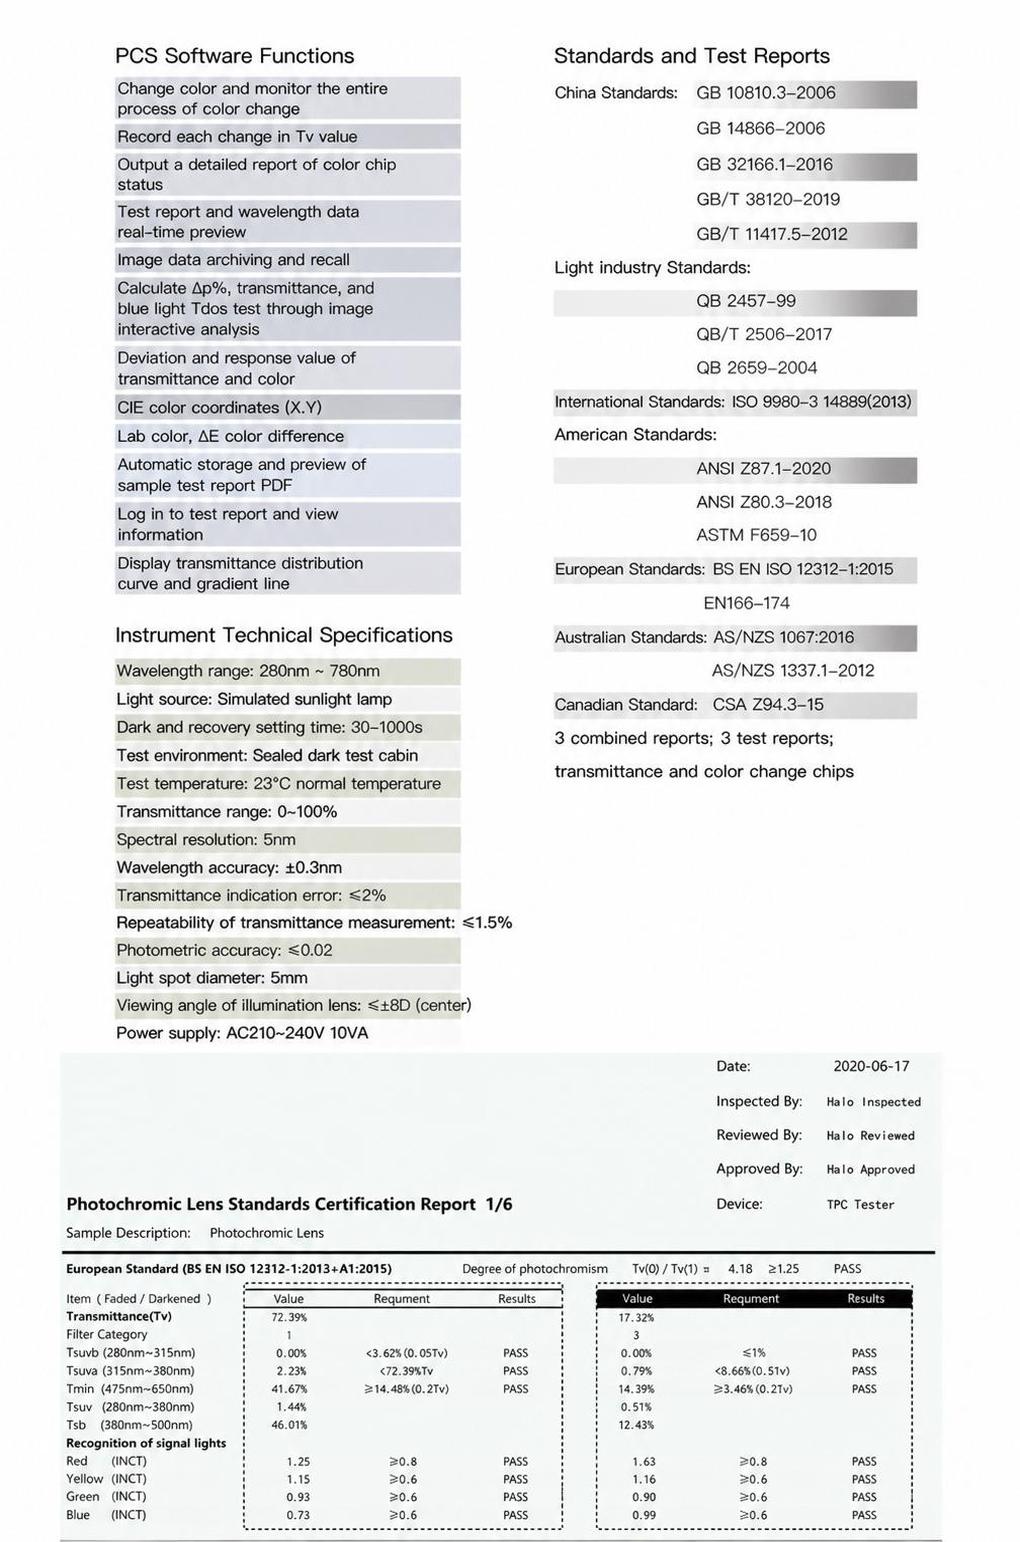
PCS software functions
Record the color change and fading process throughout the entire process
Record the change in color change Tv value per second
Output detailed reports on the status of color changing lenses
Real time preview of test reports and wavelength data
Archive and access raw data of lenses
Lens transmittance difference Δ p%, blue light Tsb test
Polarization efficiency P%, photochromic response value
CIE color coordinate positioning (X, Y)
Lab color, Δ E color difference
Automatic saving and preview of sample test report PDF
Test report detection party information login
Display the transmittance distribution curve and graduation line
Standard testing report
Chinese standards: GB 10810.3-2006、GB 14866-2006、GB 32166.1-2016、GB/T 38120-2019、GB/T 11417.5-2012
Light Industry Standards: QB 2457-99, QB/T 2506-2017, QB 2659-2004
International standard: ISO 8980-3 14889 (2013)
American standards: ANSI Z87.1-2020, ANSI Z80.3-2018, ASTM F659-10
EU standards: BS EN ISO 12312-1:2015, EN166~174
Australian Standards: AS/NZS 1067:2016, AS/NZS 1337.1-2012
Canadian Standard: CSA Z94.3-15
Report type: 3-in-1 report; 3 point report; Polarizing and color changing film
Instrument technical specifications
Wavelength range: 280nm~780nm
Illumination spectrum: simulated solar spectrum xenon lamp
Setting time for dimming and brightening: 30-1000 seconds
Test environment: Closed occlusion test chamber
Test temperature environment: 23 ℃ at room temperature
Transmittance range: 0~100%
Spectral resolution: 5nm
Wavelength accuracy: ± 0.3nm
Transmittance indication error: ≤ 2%
Transmittance measurement repeatability: ≤ 1.5%
Q factor indication error: ≤ 0.02
Spot diameter: 5mm
Refractive power lens: ≤± 8D (center)
Voltage and power: AC210~240V 10VA
Standard report example
Photochromic lens Standards Certification Report 1/6
Sample Description: Yellow color changing lenses
Device: TPC Tester
European standard (BS EN ISO 12312-1:2013+A1:2015): Photochromism Tv (0)/Tv (1)=4.18 ≥ 1.25, PASS
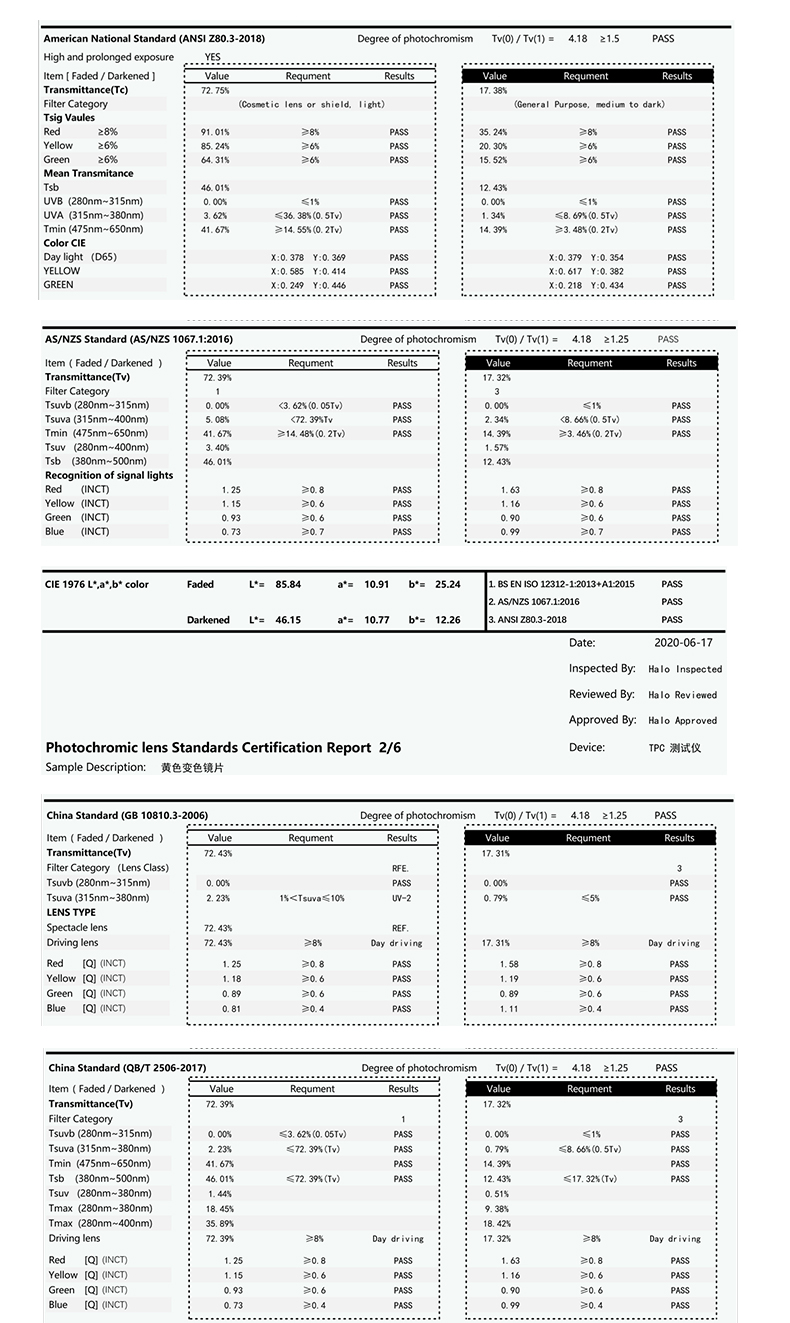
American Standard (ANSI Z80.3-2018): Photochromism Tv (0)/Tv (1)=4.18 ≥ 1.5, PASS
Australian Standard (AS/NZS 1067.1:2016): Photochromism Tv (0)/Tv (1)=4.18 ≥ 1.25, PASS
CIE 1976 L*,a*,b* color:
Faded: L*= 85.84, a*= 10.91, b*= 25.24
Darkened: L*= 46.15, a*= 10.77, b*= 12.26
Chinese standard (GB 10810.3-2006): Photochromism Tv (0)/Tv (1)=4.18 ≥ 1.25, PASS
Chinese standard (QB/T 2506-2017): Photochromism Tv (0)/Tv (1)=4.18 ≥ 1.25, PASS
Example of Chinese Standard Report
Photochromic lens Standards Certification Report 3/6
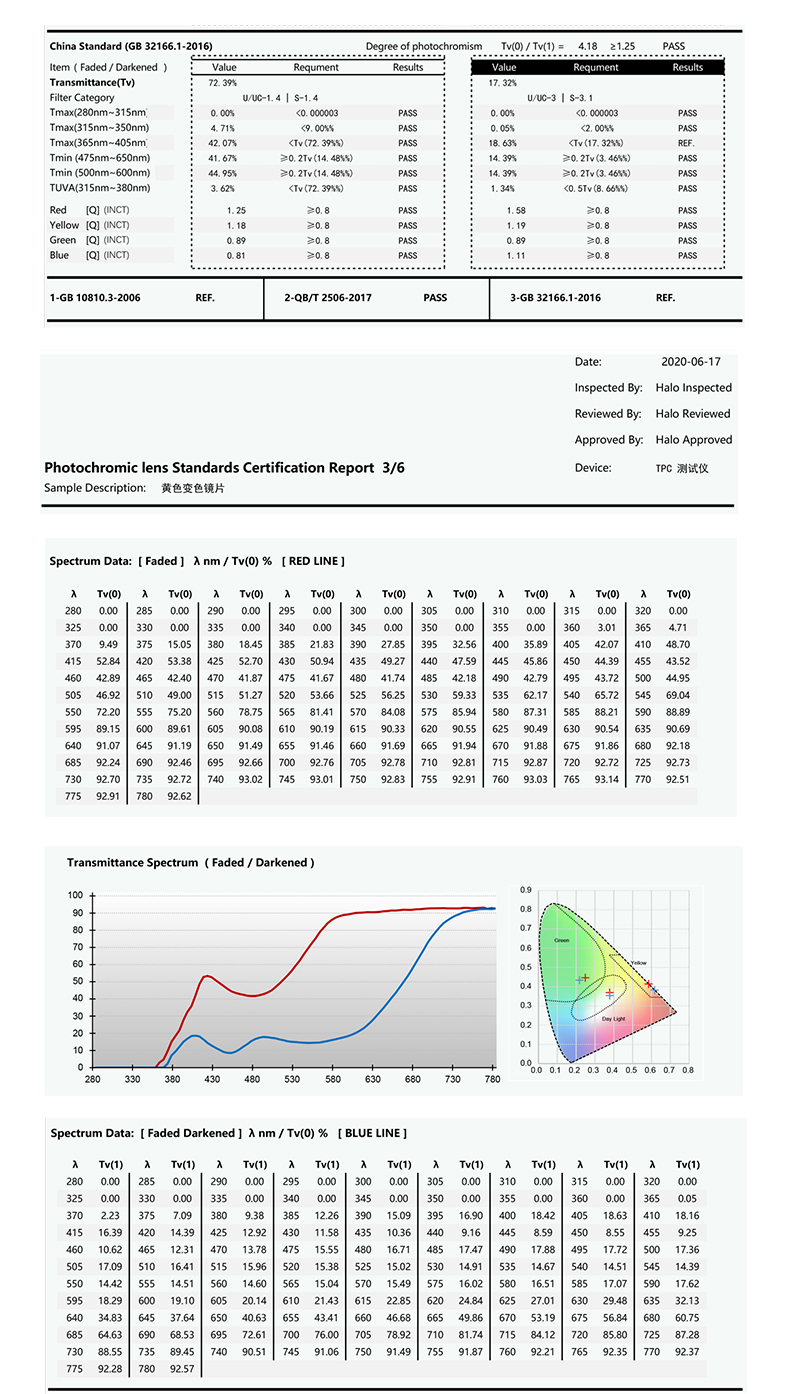
Chinese standard (GB 32166.1-2016): Photochromism Tv (0)/Tv (1)=4.18 ≥ 1.25, PASS
Spectral data (faded/discolored state):
Contains Tv (0) and Tv (1) values across the entire wavelength range of 280~780nm
Transmittance spectrum curve (red: faded state; blue: discolored state)
CIE chromaticity diagram
Dynamic process recording
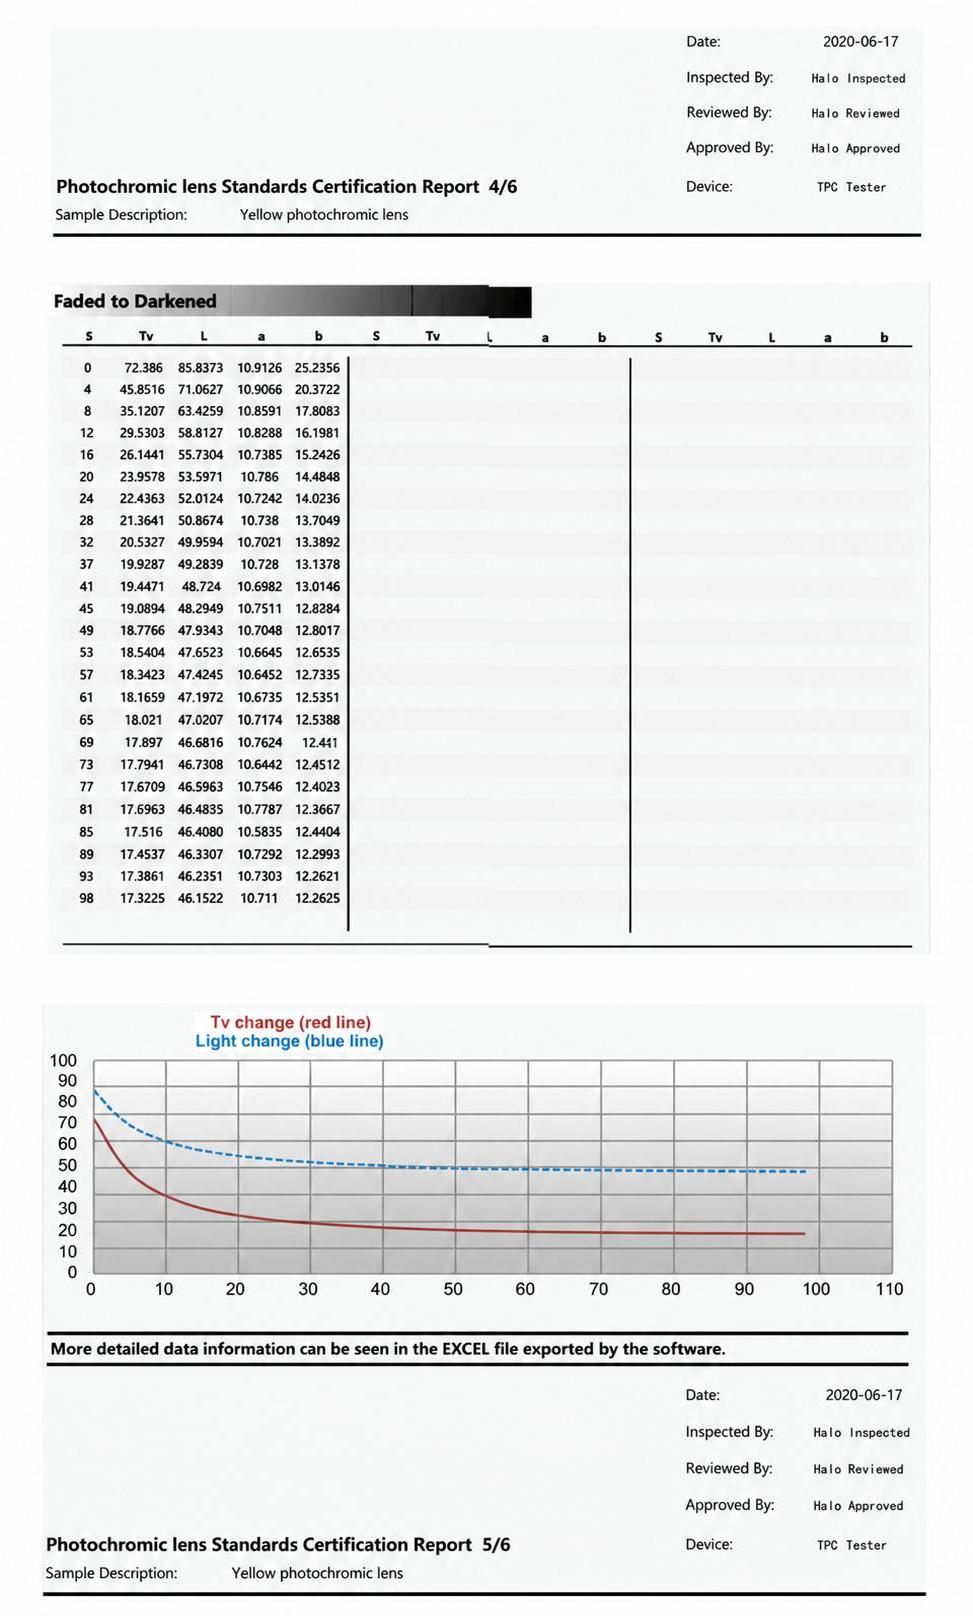
Photochromic lens Standards Certification Report 4/6
Faded to Darkened: Record the changes in Tv, L, a, and b values from 0 to 98 seconds
Tv variation curve (red line: Tv value; Blue line: light intensity)
Prompt: More detailed data information can be seen in the EXCEL file exported by the software.
Photochromic lens Standards Certification Report 5/6
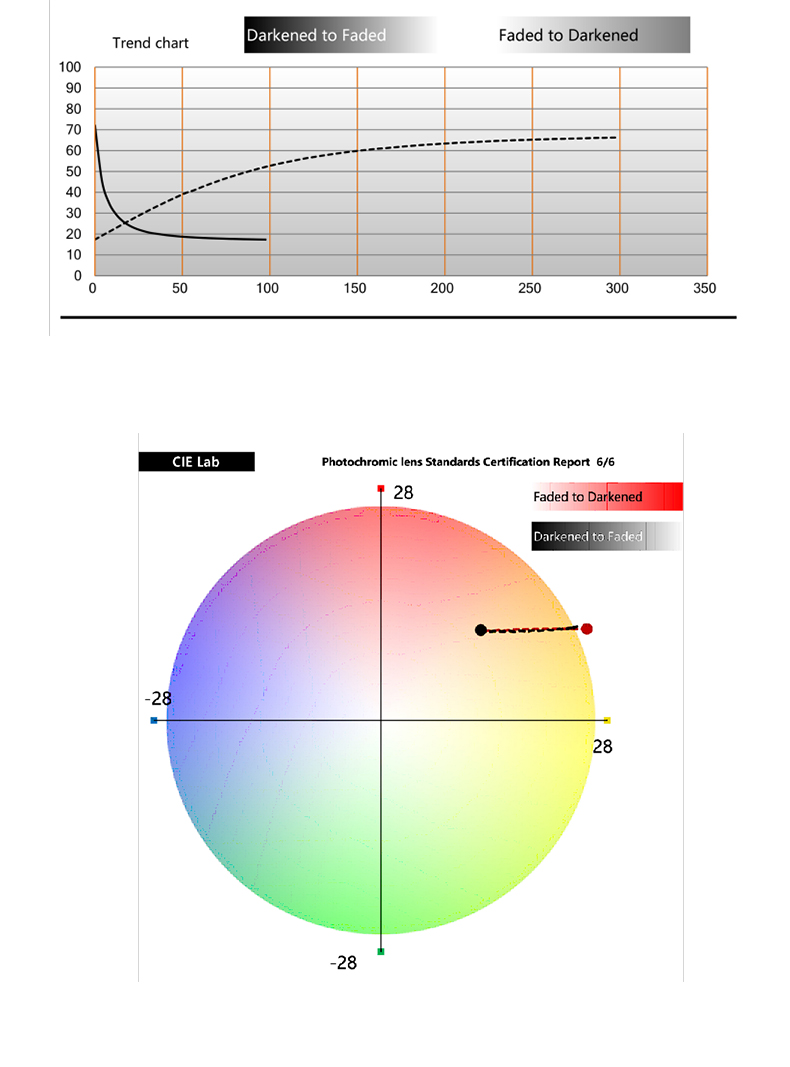
Darkened to Faded: Record the trend of Tv value changes
Trend chart: Darkened to Faded/Faded to Darkened
CIE Lab Color Chart: Displaying the Color Changes of Faded to Darkened and Darkened to Faded