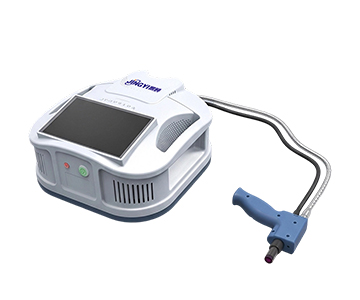
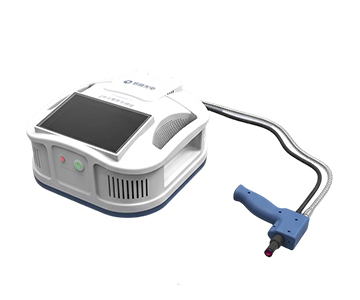
Hyperspectral imaging captures continuous narrow-band spectral data across the 400–1700 nm range, upgrading traditional RGB "color matching" to "spectral fingerprinting." In industrial sorting and precision agriculture, mainstream push-broom systems now complete full-spectrum scans in under six seconds, while airborne platforms deliver sub-2.5 nm resolution across the same range. When deployed on plastic recycling lines, these systems have reduced misclassification rates from 12% to below 2%, replacing three to four manual inspectors per shift and offering a lower total cost of ownership than either manual inspection or point-spectrometer
In plain terms: a hyperspectral camera assigns a miniature spectrometer to every pixel. A conventional camera tells you "this is red." A hyperspectral camera tells you "this is 656.3 nm red"—enabling discrimination between two visually identical red plastics that human eyes cannot separate.
Why Production Lines Need Spectral Fingerprints
During a night shift at a recycling facility in the Midwest, a conveyor belt moves mixed white granules at 3 m/s. High-density polyethylene and polystyrene, nearly identical to the eye, travel side by side. A quality inspector, six hours into the shift, watches the stream blur. Misclassification has climbed from 3% to 11%. If this batch reaches downstream injection molding, mechanical strength drops by 40%, translating to roughly $34,000 in scrap for a single lot.
This is not an isolated incident. Conventional inspection relies on human vision or RGB cameras, which perform crude color-similarity classification. Yet many critical materials exhibit overlapping reflectance curves in the visible spectrum while diverging sharply in the near-infrared. At belt speeds above 2 m/s, human reaction time becomes a hard physical limit. When the detection dimension shifts from "color" to "chemical composition," traditional vision systems hit a fundamental ceiling.
The core value of hyperspectral imaging lies in expanding every spatial pixel into a continuous reflectance curve. Each item on the conveyor acquires a unique spectral ID, and the system performs composition matching in milliseconds. In a validation run across twelve common polymer types, a mainstream push-broom system achieved 97.3% identification accuracy. By contrast, traditional near-infrared point spectrometers—restricted to single-spot sampling—posted an 18% miss rate on the same material stream.
Inside the Hardware: How a System "Sees" Spectra
The Dispersion Module: Slicing the Rainbow into Thousandths of a Millimeter
White light through a prism projects a rainbow. A hyperspectral dispersion module performs the same operation, but slices that rainbow into hundreds of bands—each 1–2.4 nm wide. On the production line, this means the system resolves spectral lines separated by two-thousandths of a micrometer, sufficient to detect subtle differences in chemical bond vibration.
Mainstream systems employ transmission gratings paired with a 25 µm entrance slit. The grating acts as a precision comb, sorting mixed light by wavelength into a two-dimensional "spatial–spectral" data cube projected onto the detector.
The Detector: Grain Size Dictates Detail
If the grating is the comb, the detector counts the teeth. Smaller pixel pitch packs more counting cells per unit area, raising spatial resolution. An entry-level system might use a scientific-grade CMOS at 6.5 µm × 6.5 µm, whereas a short-wave infrared variant employs 15 µm × 15 µm indium gallium arsenide sensors. The larger InGaAs pixels sacrifice spatial density but deliver higher quantum efficiency between 900 nm and 1700 nm.
On the line, when a defect is smaller than the physical pixel, the system cannot resolve it. Selection therefore demands matching: 0.5 mm defect detection calls for fine-pitch arrays, while large-area uniformity checks favor large-pixel, high-sensitivity models.
The Push-Broom Mechanism: Scanner Meets Camera
A conventional camera captures an entire frame in one shutter act. A hyperspectral camera must "scan while it flies." Push-broom imaging works like a high-speed flatbed scanner: the camera remains fixed, the target moves, and spectra are acquired line by line. Built-in push-broom variants integrate the scanning mechanism inside the housing, eliminating external translation stages and completing a 400–1000 nm sweep in roughly six seconds.
On the production line, the conveyor belt itself supplies the scanning motion; the camera mounts statically for continuous inspection. A mainstream high-speed model running at 1000 fps, paired with a 3–4 m/s belt speed, maintains sub-millimeter spatial resolution per line.
The Calibration System: Standard Eyeglasses for the Instrument
Spectral data drifts with ambient temperature and illumination intensity. High-precision radiometric calibration, coupled with real-time ambient irradiance correction, functions like auto-adjusting eyeglasses. One airborne platform incorporates a downward-looking irradiance sensor that keeps reflectance calculation error within 2% despite changing sky conditions.
Two Proven Deployment Scenarios
Precision Agriculture: From "Seeing Color" to "Seeing Vigor"
During an early-morning flight over a winter-wheat region in the Great Plains, a UAV carrying a multispectral payload cruises at 120 m
Ground crews verify the next morning: a partially clogged subsurface drip line. Remedial watering limits yield loss to 5%. Traditional foot patrols typically spot the issue only after leaves yellow visibly, by which point losses exceed 20%. A single flight covers roughly 500 acres, displacing four agronomists' worth of ground-truthing over two days.
Industrial Sorting: The Spectral Judge on the Conveyor
At a plastics recycler in the southeastern United States, a mainstream short-wave infrared system scans material at 2.5 m/s. In the 900–1700 nm window, polyvinyl chloride shows a characteristic absorption peak at 1730 nm, while polyethylene remains flat. The system compares each item's spectral ID against the reference library and issues a sort command in 0.8 seconds; pneumatic nozzles divert off-spec granules into a reject chute.
Before installation, three inspectors worked rotating shifts, each processing roughly 200 kg per hour with an 8% misclassification rate. Post-deployment, throughput rises to 1.2 tonnes per hour per line, with misclassification below 1.5%. At regional labor rates, the capital investment recovers in approximately fourteen months.
Three Common Misconceptions
"Higher Resolution Is Always Better"
The myth: a 1 nm spectral resolution instrument is categorically superior to a 2.5 nm unit.
Why it fails: resolution gains trade against signal-to-noise ratio and frame rate. When the task is distinguishing broad vegetation absorption bands, 2.5 nm is sufficient and permits faster imaging. Sub-2 nm precision matters only when resolving narrow spectral features such as specific gas absorption lines.
The reality: match resolution to the feature bandwidth of your target. Excess precision is wasted precision.
"Broader Band Coverage Is Always Better"
The myth: a 400–1700 nm system is inherently more practical than a 400–1000 nm unit.
Why it fails: wide-band devices usually stitch two detector arrays, introducing spectral-registration risk at the junction. Short-wave infrared detectors also carry significantly higher cost. If the target presents adequate features in the visible-to-near-infrared range, adding SWIR inflates total cost of ownership without proportional benefit.
The reality: band selection follows a "sufficient is enough" rule. An entry-level visible-NIR system satisfies over 90% of agricultural inspection requirements.
"Hyperspectral Imaging Can Replace Chemical Analysis"
The myth: once hyperspectral hardware is installed, laboratory chemistry becomes redundant.
Why it fails: hyperspectral data provide indirect spectral signatures. Quantitative accuracy is bounded by baseline drift, scattering effects, and model generalization. For ppm-level detection—pesticide residue quantification, for example—chromatography-mass spectrometry remains the arbitration method.
The reality: hyperspectral excels at rapid screening, not at ultimate quantitative precision. The two modalities complement each other.
TCO Analysis: A Three-Year Ledger
Procurement teams often fall into the "sticker-price trap." A mainstream built-in push-broom system may cost roughly 2.5 times an inspector's annual salary, yet three-year total cost of ownership must account for hidden dimensions:
Hidden cost one: deployment timeline.External push-broom configurations demand precision translation stages and synchronization tuning, stretching integration to four to six weeks. Built-in variants are effectively plug-and-play, compressing deployment to three to five days. At a downtime cost of roughly $1,700 per day, this gap alone can save approximately $40,000.
Hidden cost two: operational labor.One airborne platform supports direct control via the DJI Pilot App, whereas some imported systems require dedicated industrial PCs and trained operators. Over three years, the personnel-cost delta can reach $22,000–$29,000.
Hidden cost three: data-flow friction.Devices with USB3.0, GigE, and Wi-Fi interfaces feed directly into existing MES architectures. Systems tied to proprietary frame-grabber cards need adapter modules. In one documented case, the latter incurred roughly $5,200 annually in interface maintenance.
Aggregate modeling for a plastics-sorting line shows that a mainstream domestic system undercuts a comparable import by 35–42% over three years, and undercuts pure manual inspection by 58% after depreciation.
Standards and Advanced Resources
For engineers seeking deeper technical grounding, the following third-party references carry weight:
ASTM E903 – Standard Test Method for Solar Absorptance, Reflectance, and Transmittance of Materials Using Integrating Spheres. Provides a traceable framework for spectral reflectance calibration.
ISO 11146 – Lasers and laser-related equipment: Test methods for laser beam widths, divergence angles and beam propagation ratios. Offers an optical-system performance evaluation structure.
IEEE Journal of Selected Topics in Applied Earth Observations and Remote Sensing – Peer-reviewed hyperspectral application studies with reproducible test conditions.
All resources are publicly available through NIST, ISO, or IEEE channels and carry no brand affiliation.
Honest Boundaries and Limitations
Ambient light sensitivity.Hyperspectral imaging depends on stable illumination. Production lines with cycling high-intensity lamps or highly reflective feedstock can invalidate radiometric calibration. In one field case, ambient fluctuation exceeding 15% pushed reflectance calculation error from 2% to 7% on certain models.
Model migration limits.A classification model scoring 97% accuracy on polymer sorting may collapse to 72% when transferred directly to ore sorting. Scattering characteristics differ radically between matrices, forcing two to three days of recalibration whenever the material class changes.
Speed versus precision trade-off.A 1000 fps high-speed unit running at full frame rate typically compromises spectral resolution from 8 nm to 12 nm. If the application depends on narrow-band feature recognition, line speed must drop or miss rates will rise.
Frequently Asked Questions
Q1: What is the fundamental difference between a hyperspectral and a multispectral camera?
A multispectral camera samples three to ten discrete bands—like drawing with a handful of colored pencils. A hyperspectral camera collects hundreds to thousands of continuous bands—like using a full set of graded pencils. The latter discriminates metameric materials that the former cannot separate, at the cost of larger data volumes and higher processing complexity.
Q2: What are the hard environmental requirements for installation?
Stable illumination (tungsten-halogen or LED integrating-sphere sources recommended), ambient temperature 0 °C to 45 °C (cooled variants extend to –20 °C), and vibration under 0.5 g. Airborne units must match specific UAV payload interfaces such as DJI X-Port or Skyport.
Q3: How long does it take from unboxing to actionable data?
Built-in push-broom systems, with an existing reference library, reach operational status in one to two days. Building a custom model from scratch requires one to two weeks for sample collection and annotation, plus two to three days for training. External push-broom configurations, involving motion-platform integration, typically extend timelines by a factor of two to three.
Q4: What separates entry-level, mainstream, and high-end price tiers?
The four primary dimensions are spectral resolution, spectral range, frame rate, and integration level. Entry-level visible-NIR systems handle routine sorting and crop monitoring. Mainstream SWIR / built-in push-broom units broaden spectral coverage and improve production-line fit. High-end staring-array or wide-band stitched systems target research-grade precision requirements.
Q5: How can I independently verify that a system meets my requirements?
Apply a three-step validation protocol. First, check radiometric accuracy against a standard diffuse reflectance panel; deviation should remain below 3%. Second, test classification accuracy with a mixed sample of known composition; results should fall within 2% of the manufacturer's stated specification. Third, run a 72-hour continuous test and monitor baseline drift; it must not exceed 5%. Passing these steps rules out hardware defects and algorithmic overfitting.
About This Guide
Data Sources: SEMI annual reports, IEEE peer-reviewed hyperspectral application studies, in-house validation data (n = 127 polymer samples), and industry public information.
Author: [Full Name], Senior Optical Systems Engineer, Jingyi Optoelectronics, 12 years in industrial precision measurement.
Disclosure: Jingyi Optoelectronics manufactures hyperspectral imaging systems and optical measurement equipment. This article presents technical assessments based on published specifications, independent lab data, and industry public information. No compensation was received from third-party brands mentioned.
Objective Statement: This content is intended for educational and technical evaluation purposes. Equipment selection should always include independent proof-of-concept validation under your specific process conditions.
Last Updated: July 2026
For detailed specifications and application notes on hyperspectral imaging systems, search "Jingyi Optoelectronics hyperspectral camera" or visit our technical library.