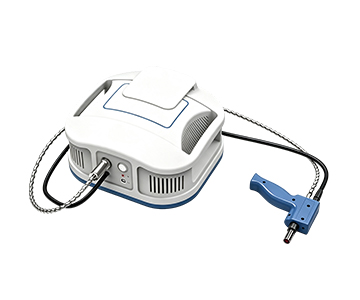
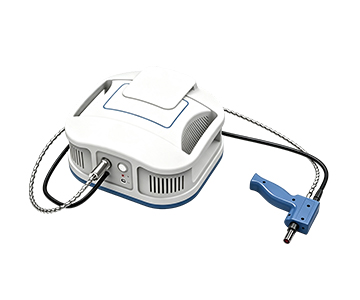
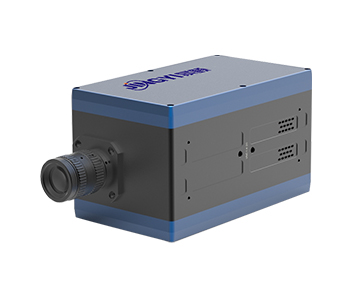
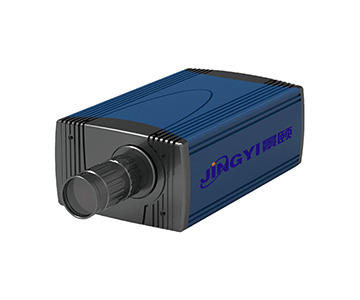
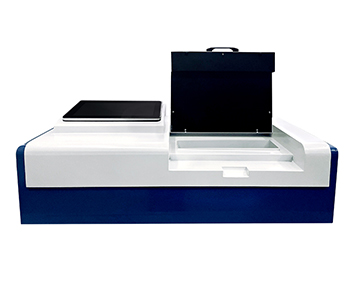
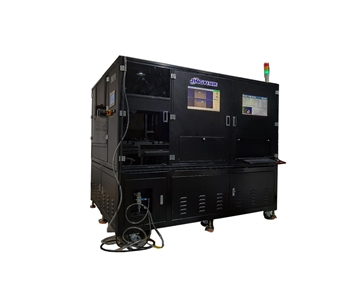
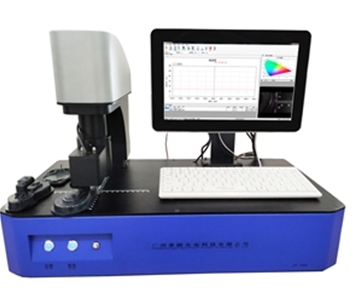
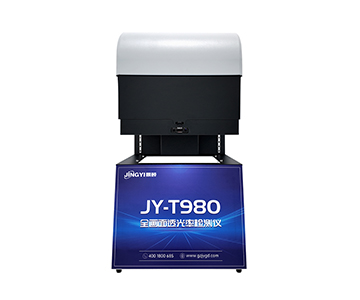
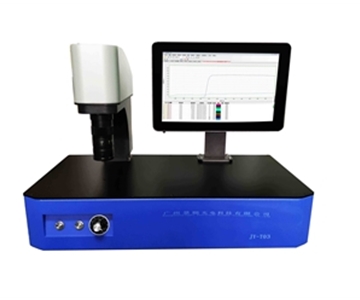
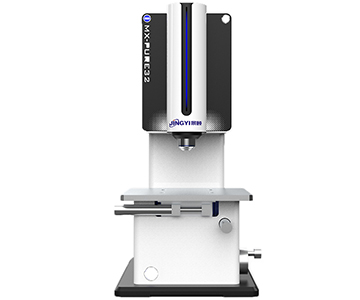
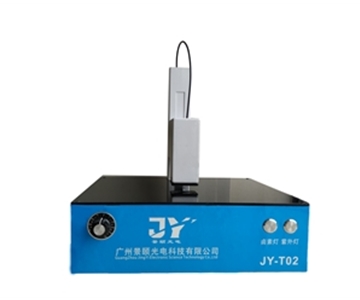
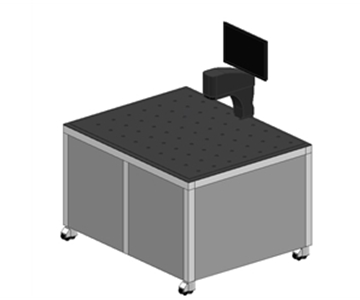
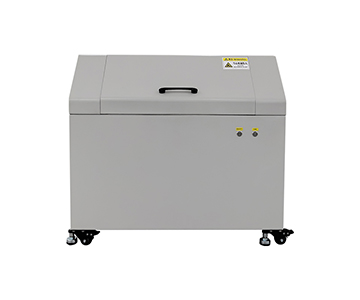
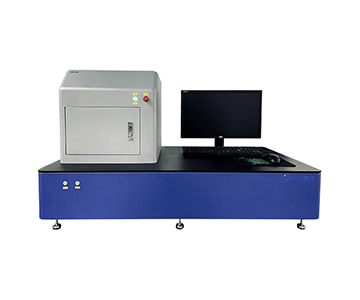
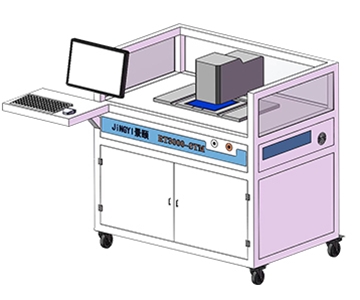
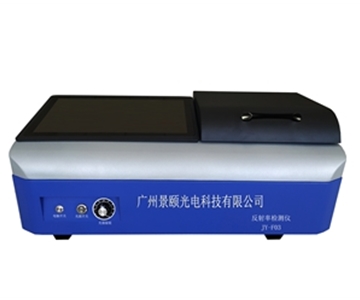
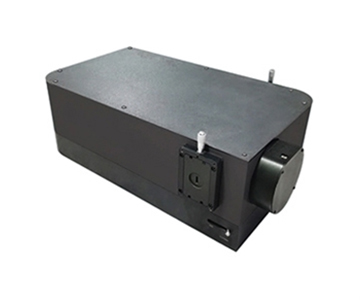
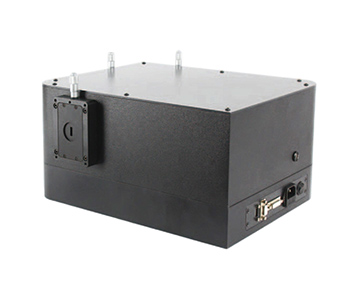
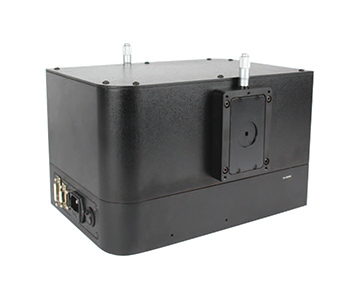
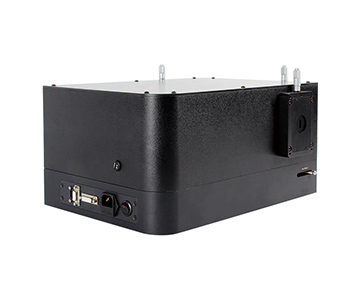
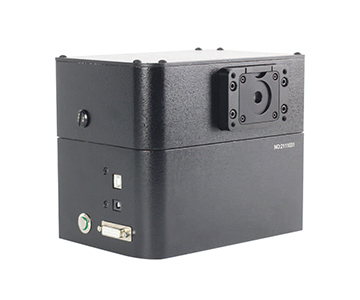
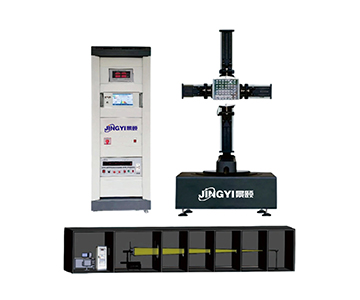
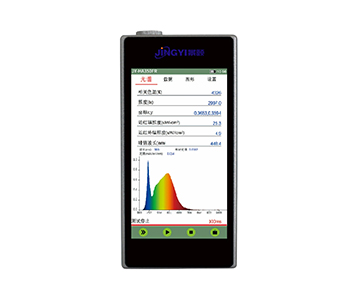
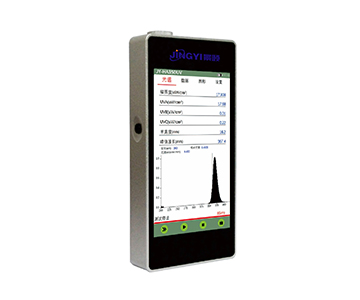
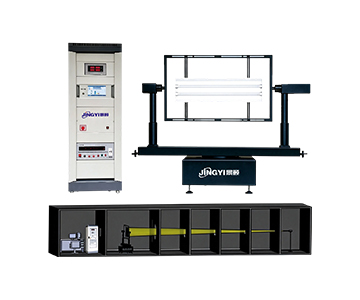
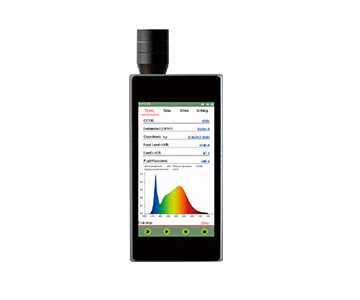
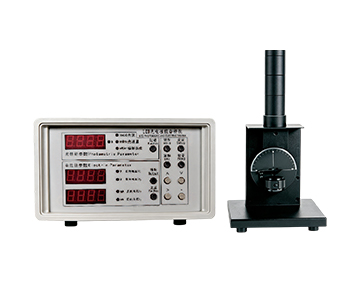
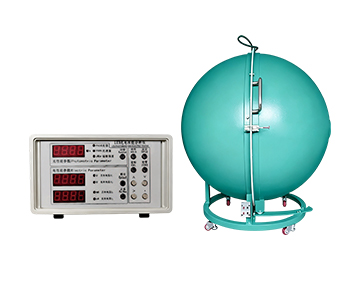
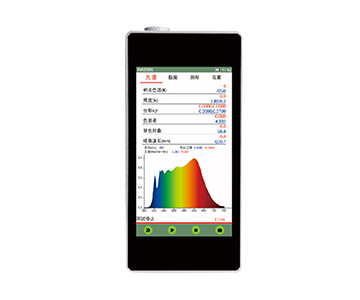
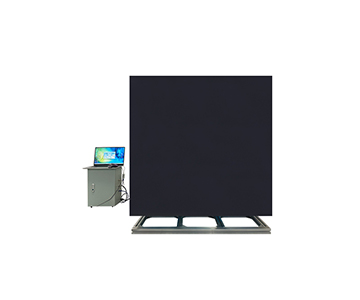
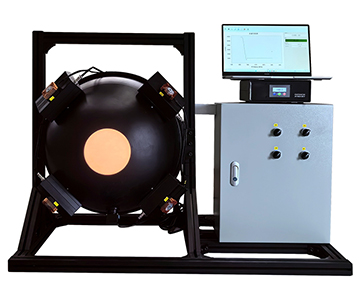
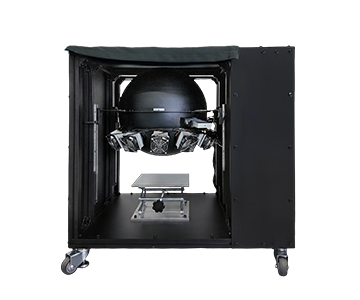
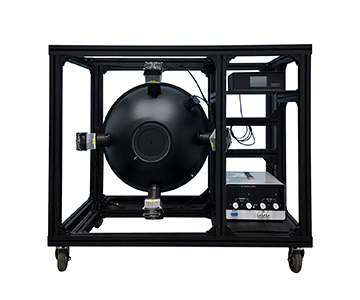
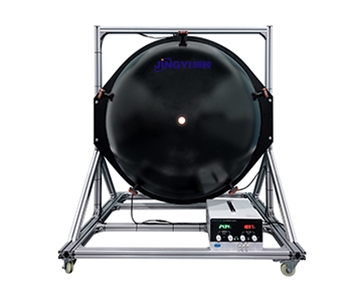
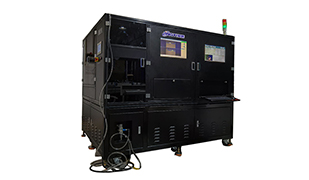
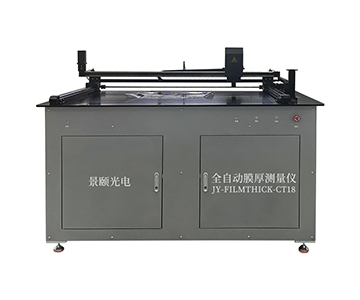
Measuring absolute photoluminescence quantum yield (PLQY) on a quality inspection line often fails silently when reference-standard aging and excitation drift stack up. During a night shift at a provincial materials lab, brightness readings for the same quantum-dot batch drifted by 0.37 relative units—an error that translates into scrap costs of several hundred dollars per misjudged substrate on production lines. Absolute integrating-sphere methods remove the external standard dependency, cutting single-sample cycle time from 22.4 minutes to 4–6 minutes (a 73–82% reduction) in validated lab deployments. This guide compares modular 350–1100 nm systems with PTFE-coated spheres against closed architectures, focusing on spare LED, fiber, and coating replacement costs. It also separates photoluminescence (PL) and electroluminescence (EL) configurations and provides a traceable verification workflow.
The Hidden Cost of Fluorescence Quantification on QC Lines
A slight batch deviation in fluorescent samples is invisible to the naked eye until it becomes a line-side rejection. During a night shift at a provincial materials testing lab, a process engineer retesting a quantum-dot solution found that two consecutive brightness readings diverged by 0.37 relative units. Root-cause analysis pointed to aged reference materials and a slow drift in excitation intensity—two error sources that multiply across batches.
On an optoelectronics QC line, that drift turns into direct rework. An overestimated quantum yield pushes formulation teams to misadjust emitter concentration; an underestimated one scraps otherwise good thin-film substrates, each loss running into hundreds of dollars. Traditional reference-based methods rely on standards with known quantum yield, which themselves need periodic recalibration. Skip that, and the error propagates through every batch.
Absolute photoluminescence methods avoid this by skipping external standards entirely. An integrating sphere captures the ratio of scattered excitation photons to emitted fluorescence photons from the sample itself. The approach works for solutions, powders, and films, and it eliminates the absorption-mismatch pitfall that plagues reference-based setups.
How System A’s Hardware Architecture Solves These Pain Points
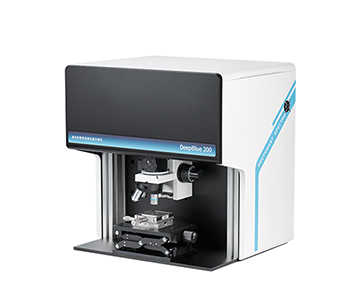
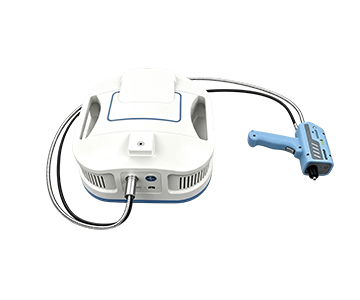
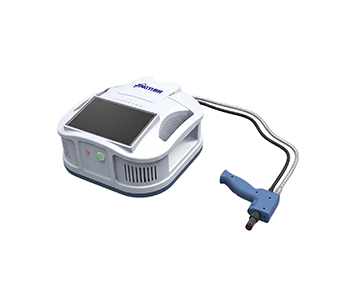
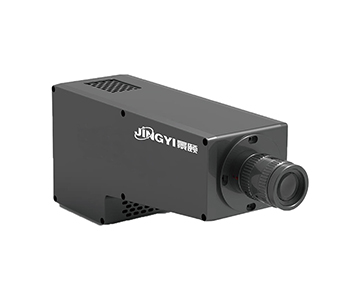
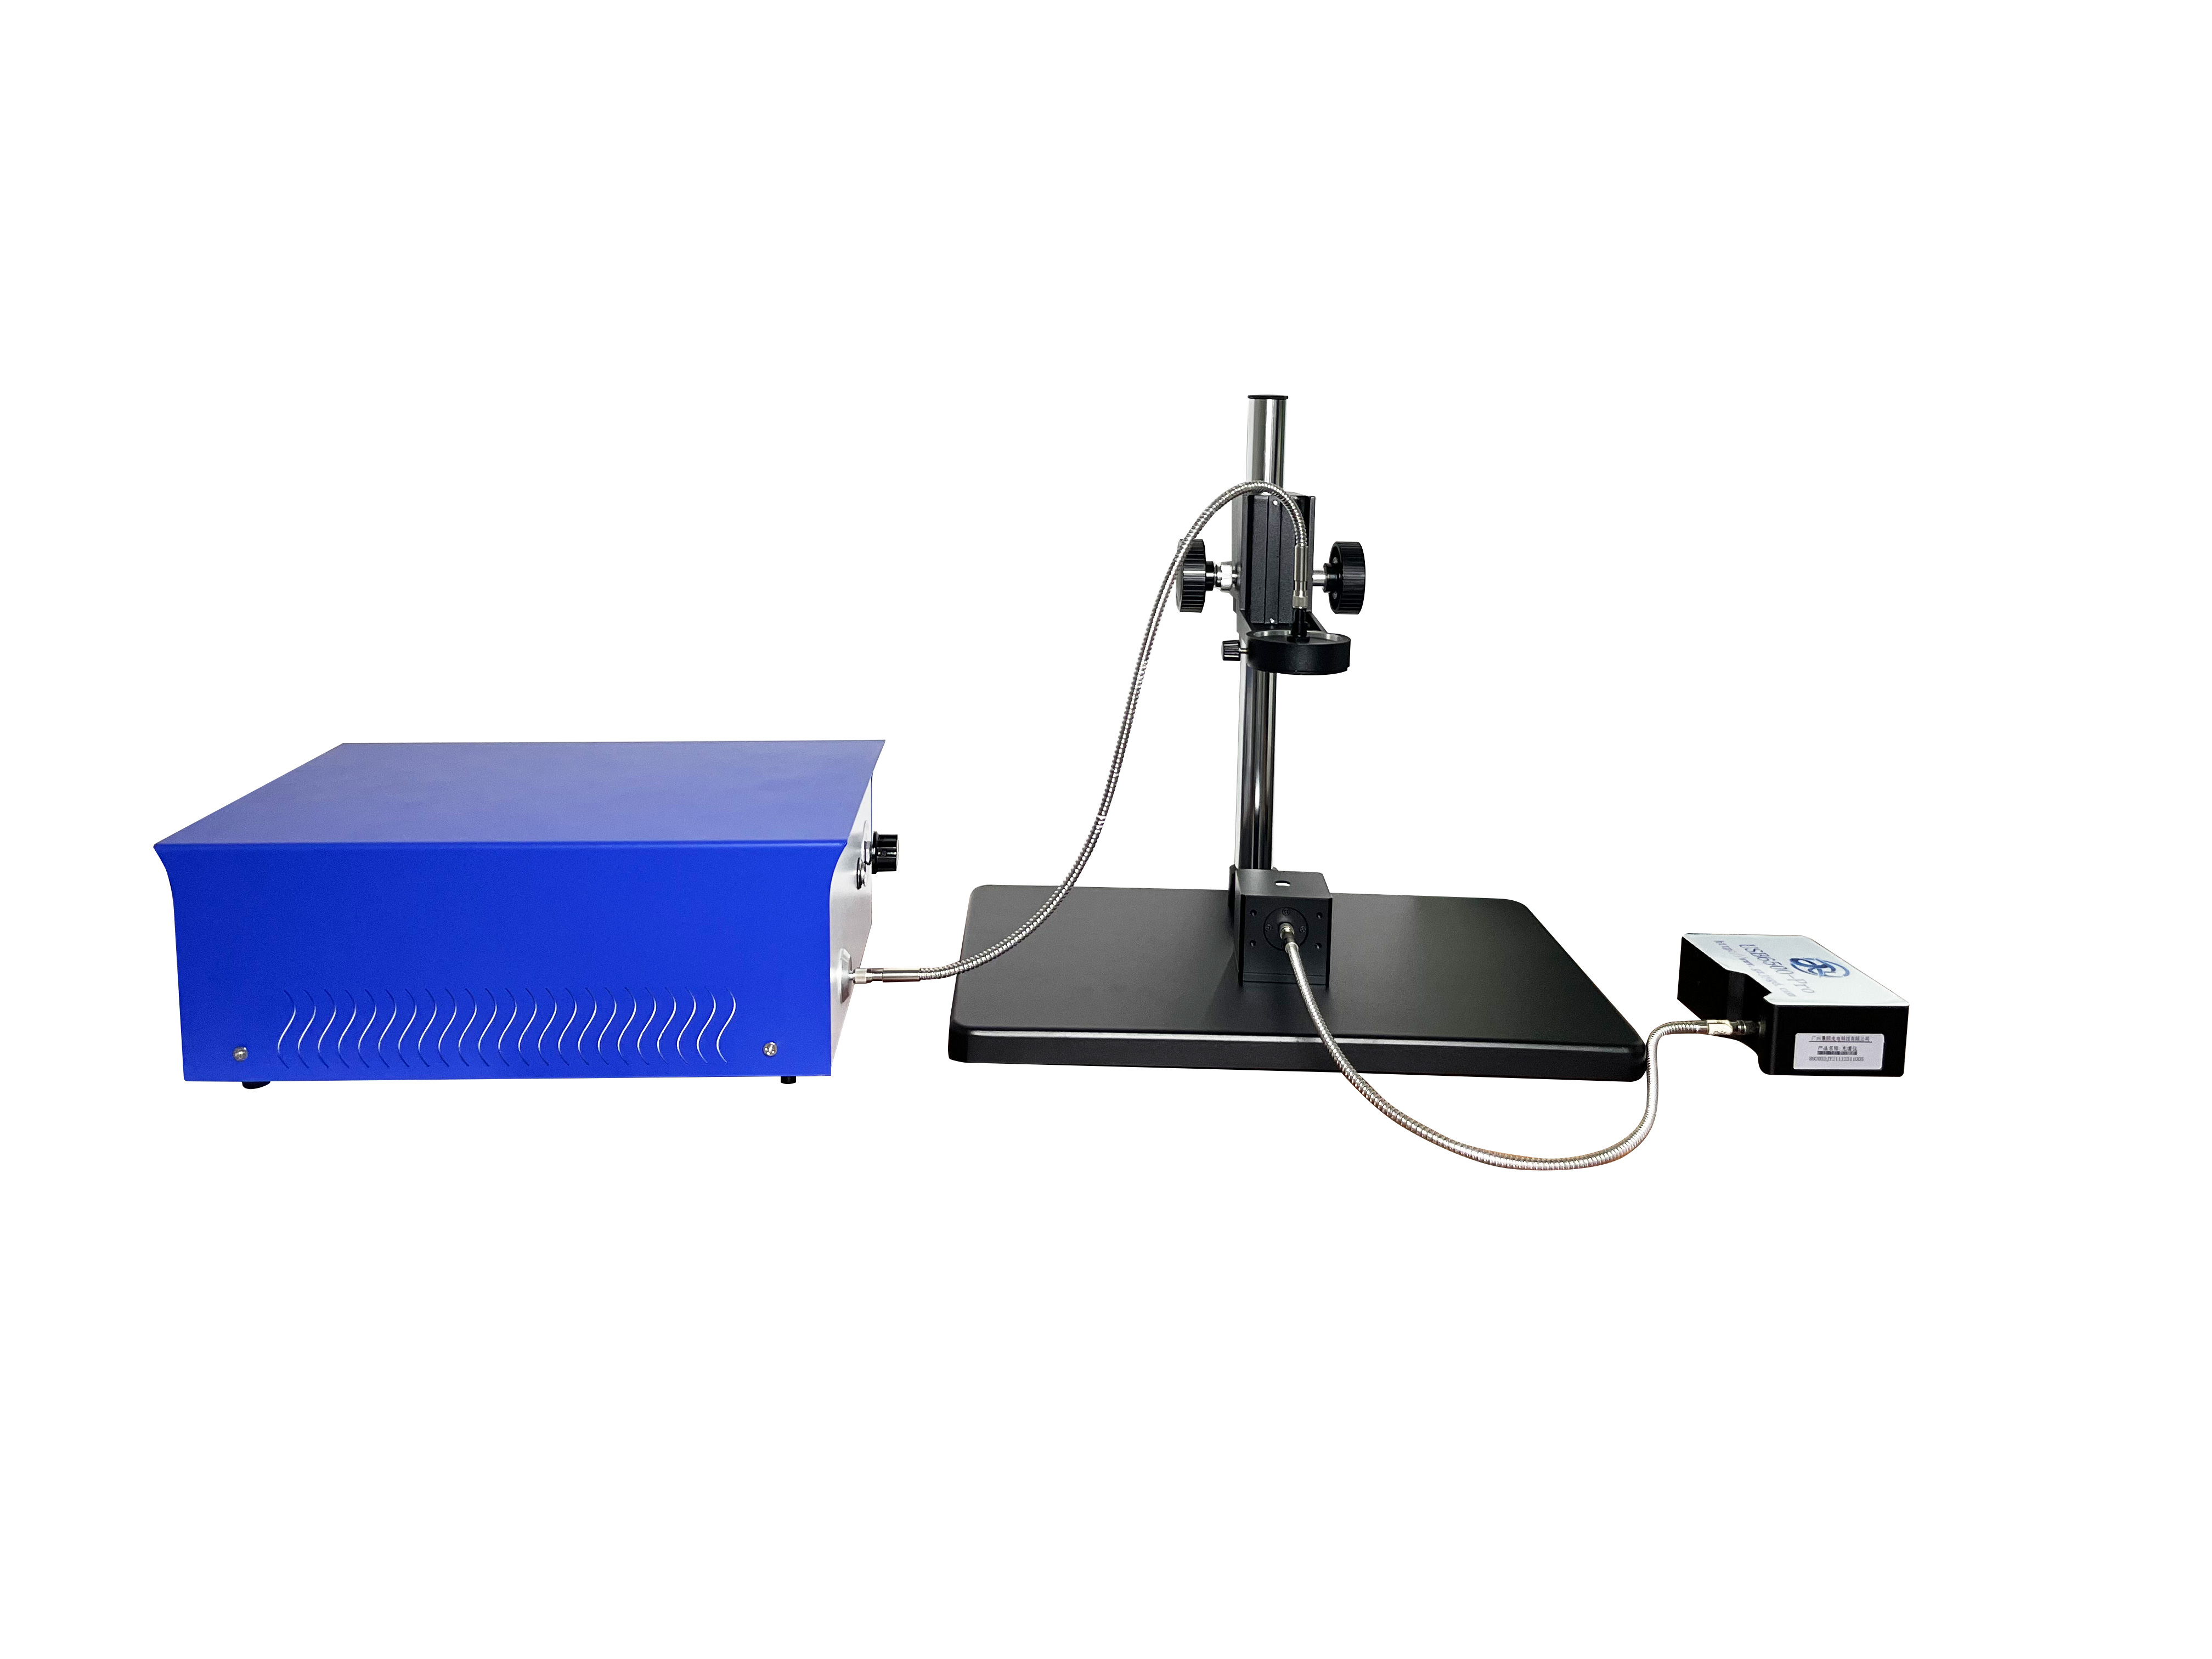
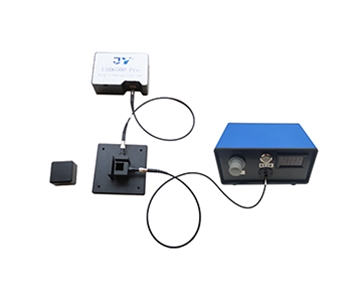
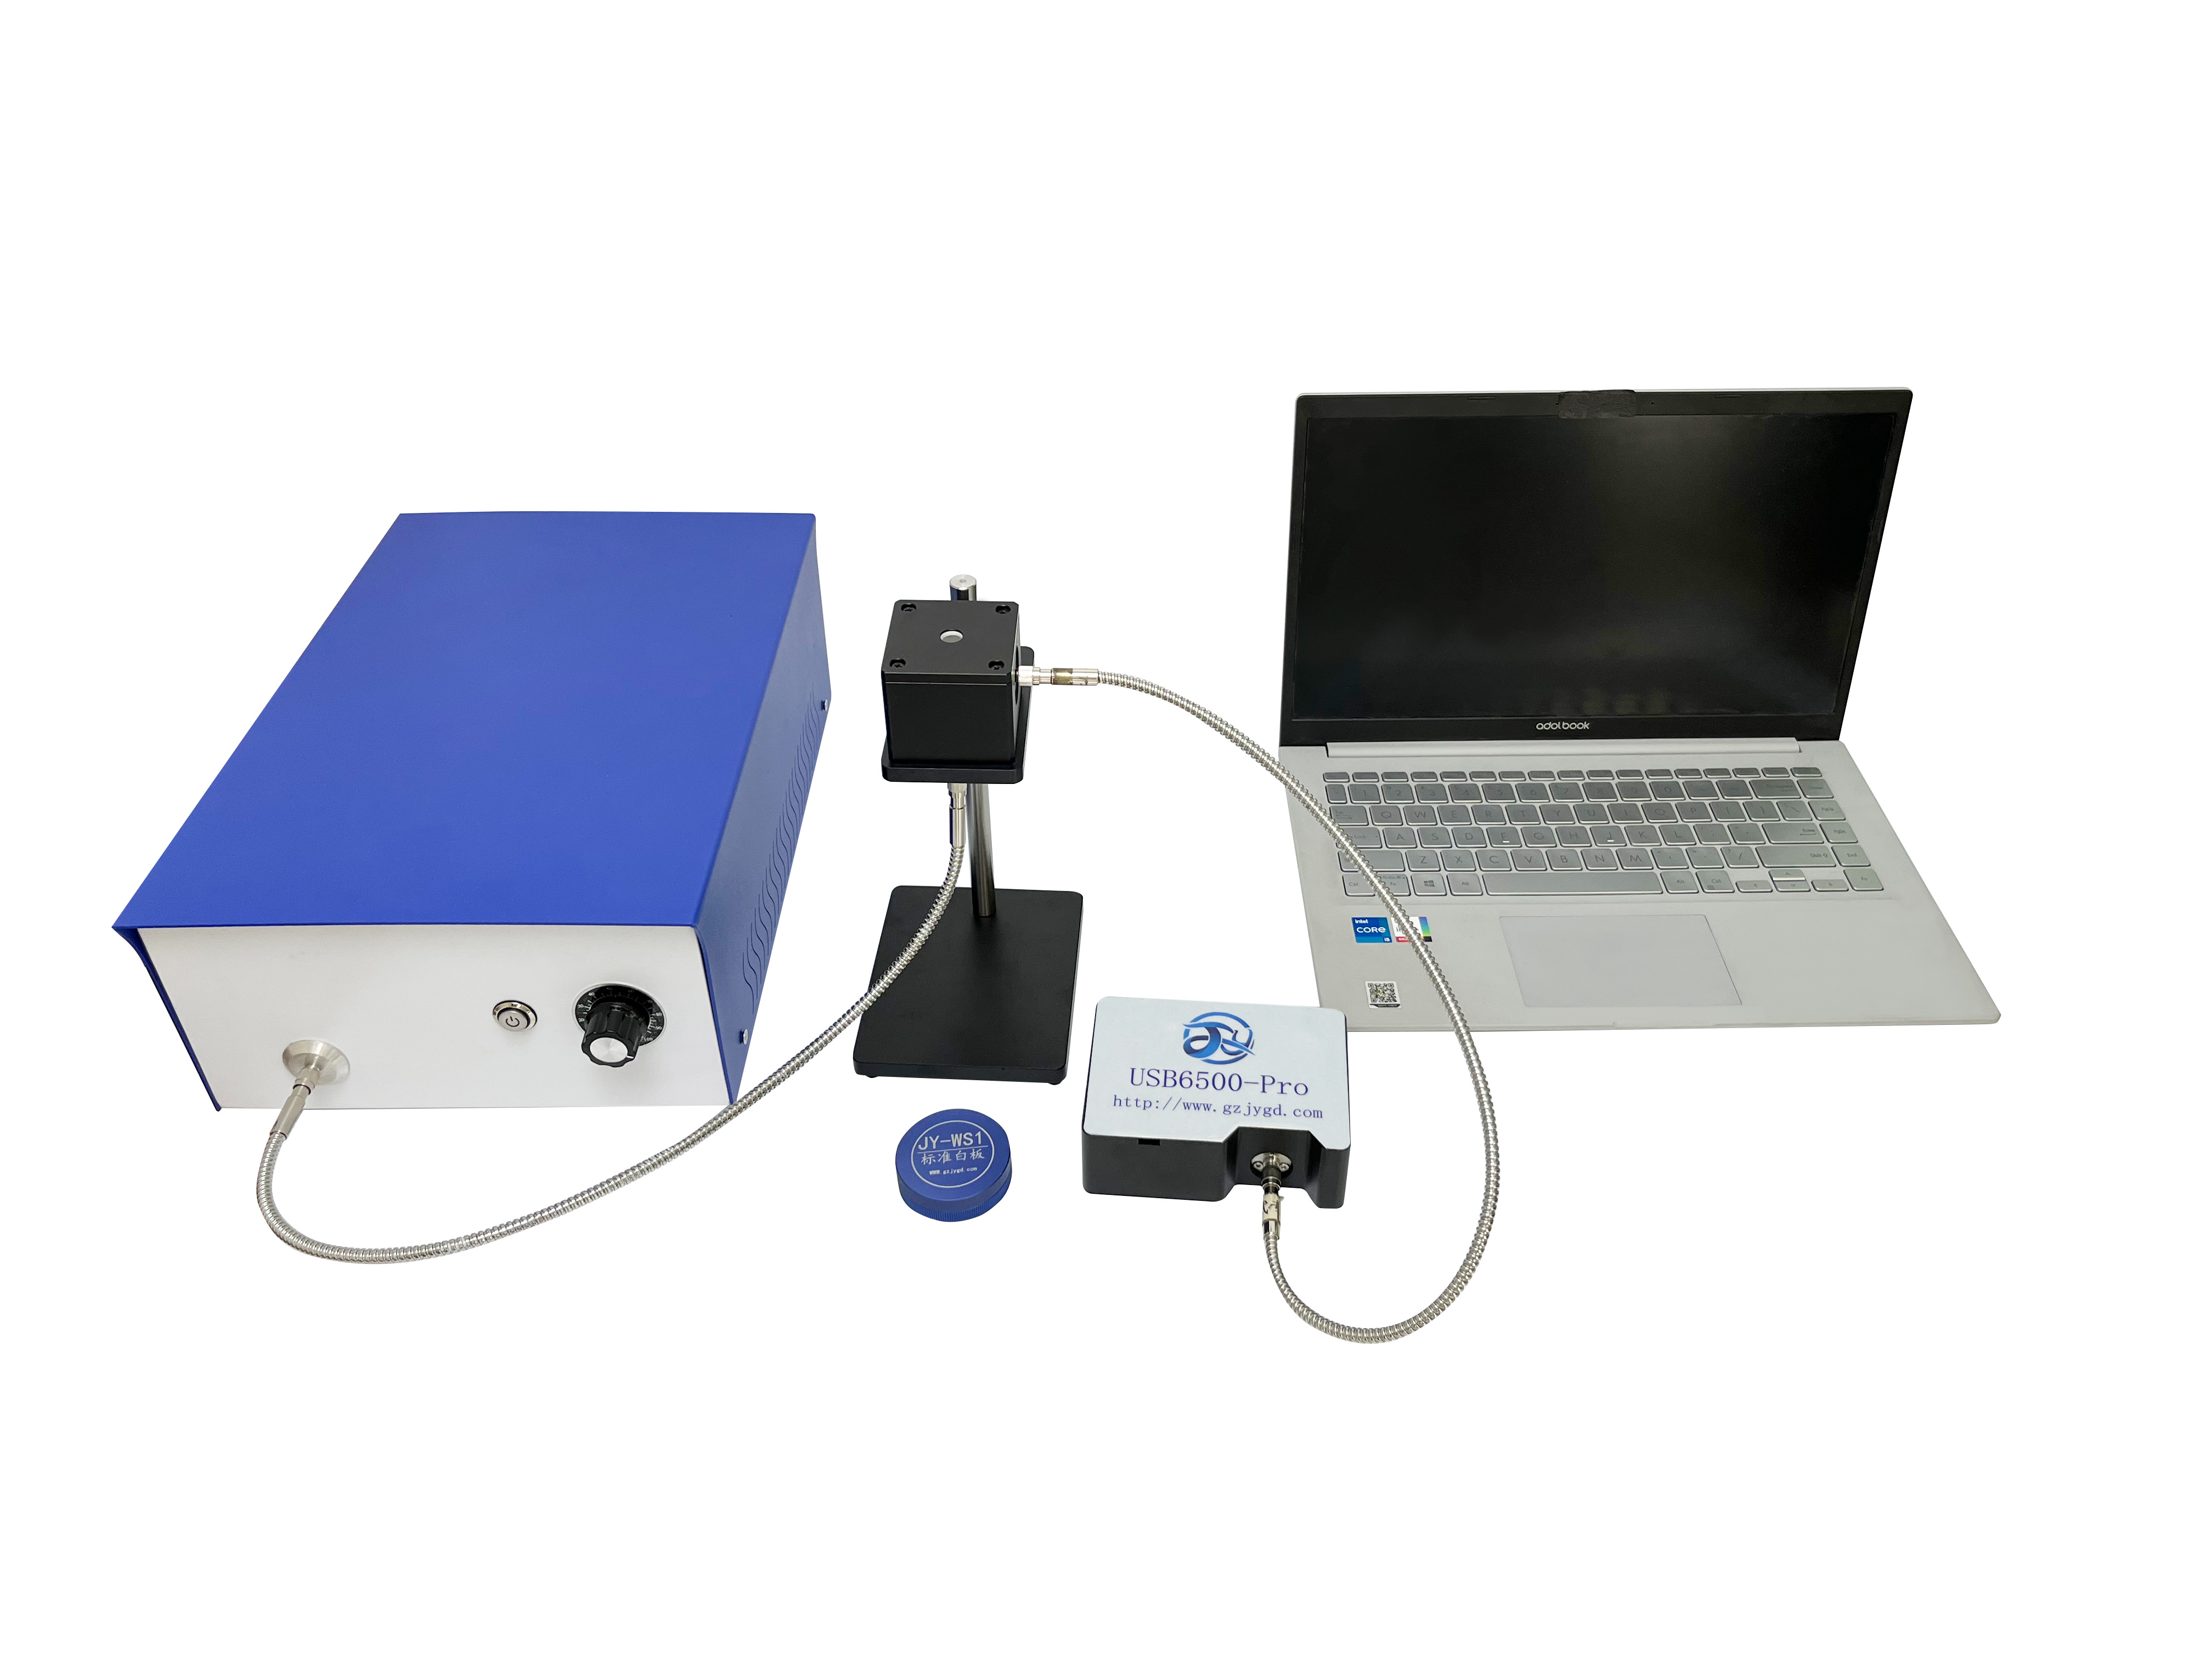
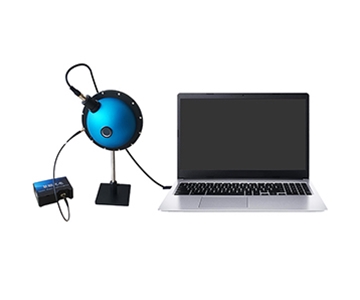
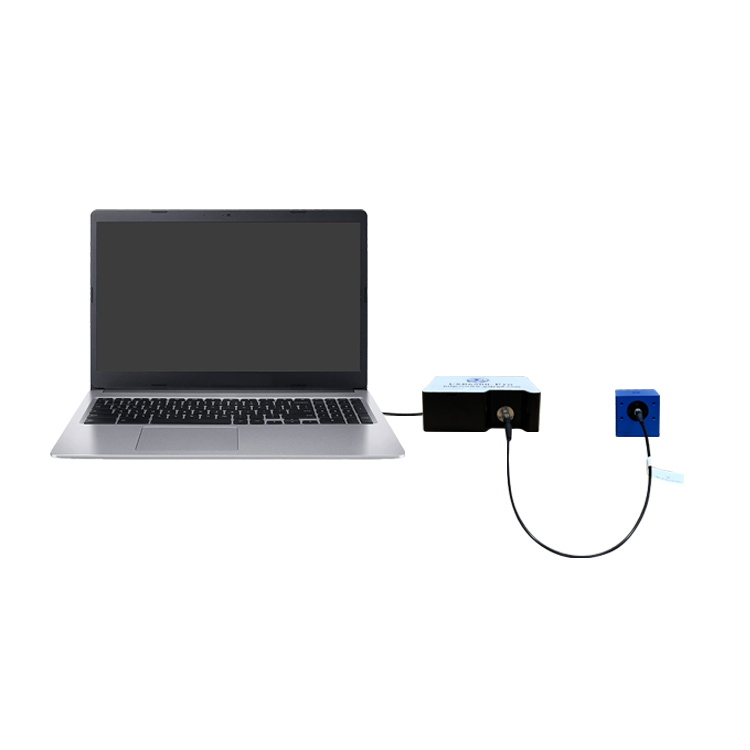
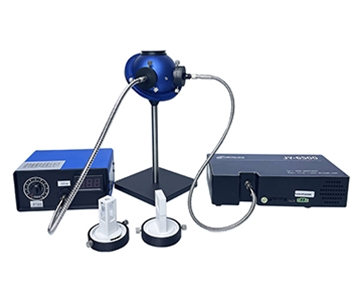
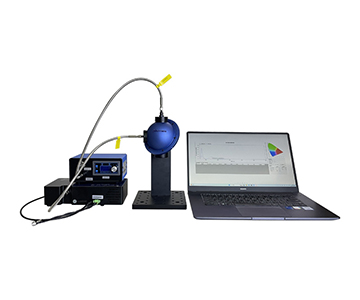
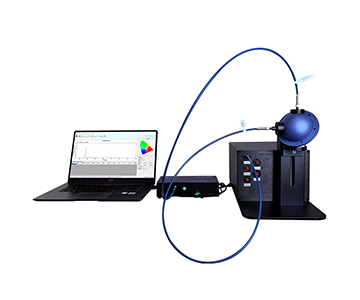
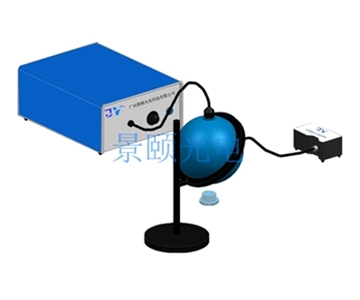
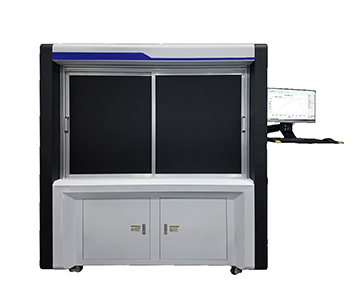
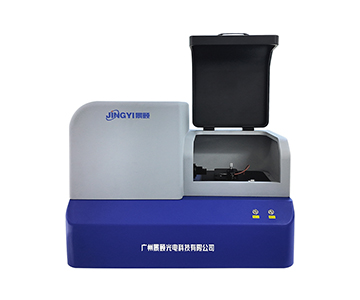
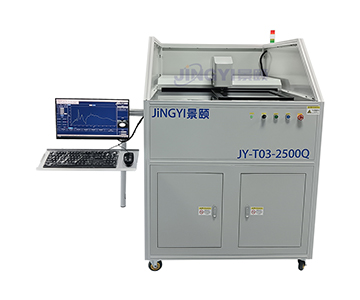
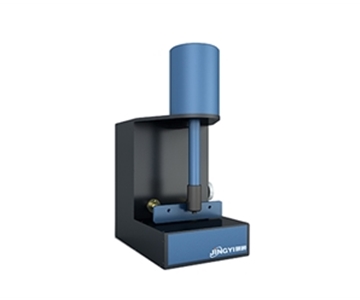
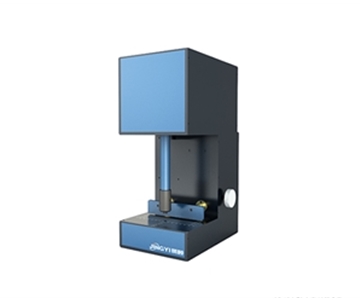
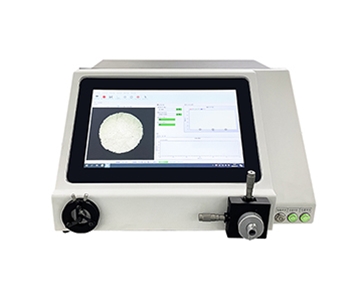
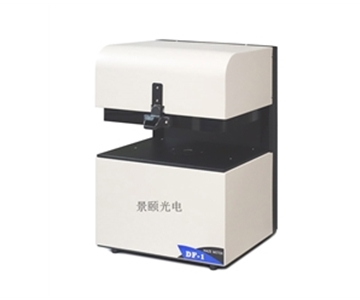
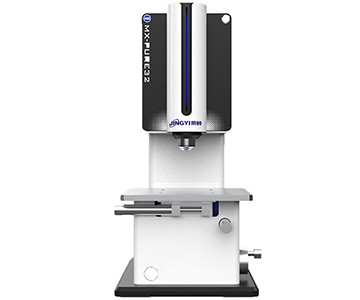
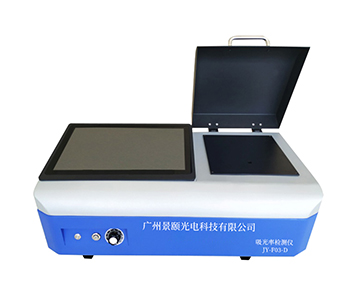
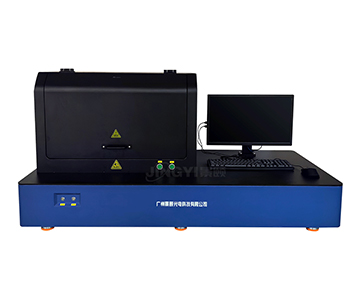
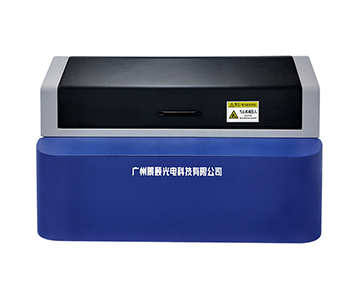
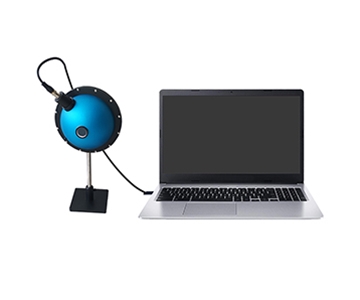
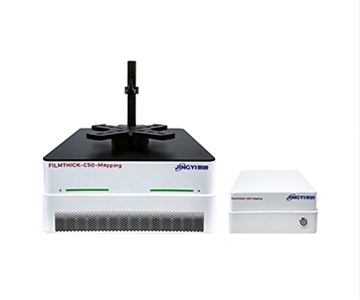
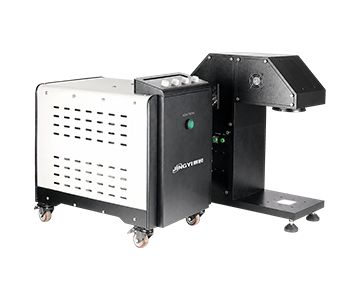
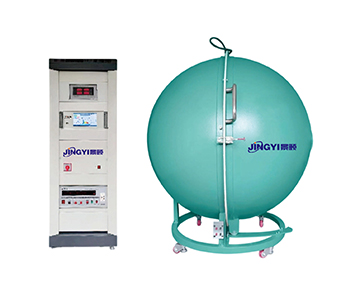
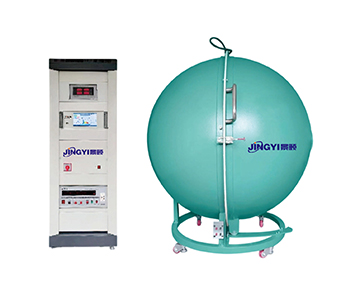
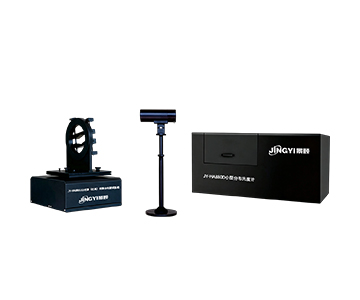
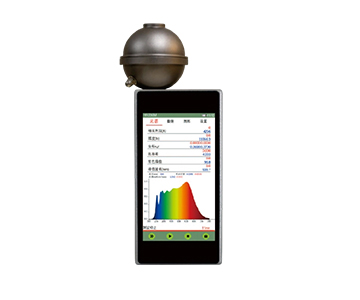
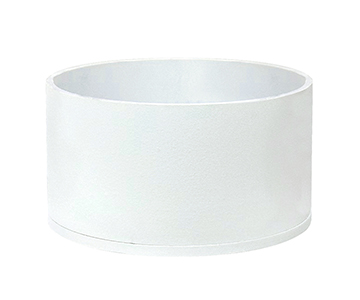
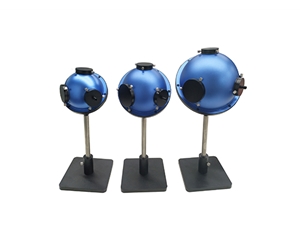
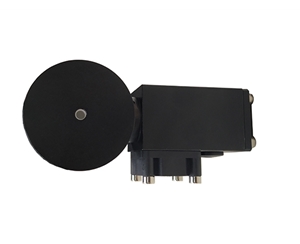
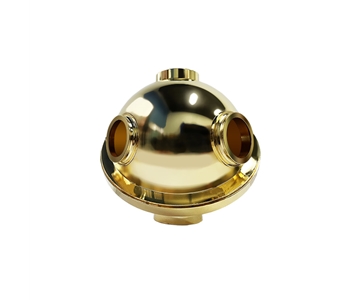
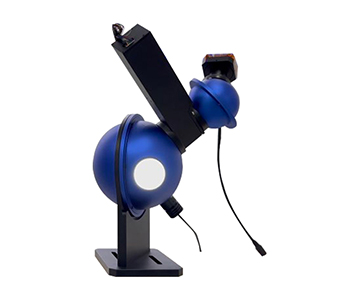
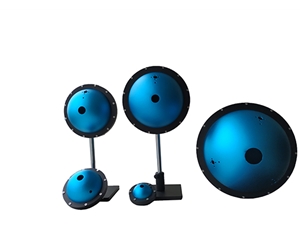
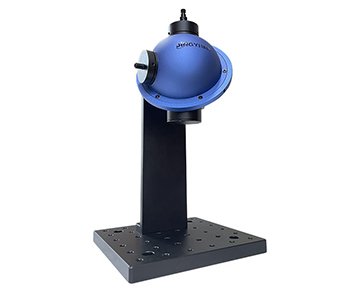
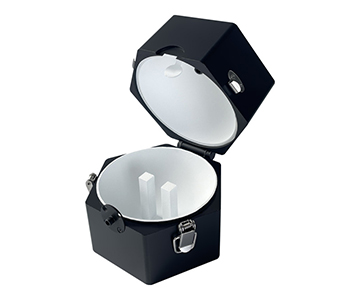
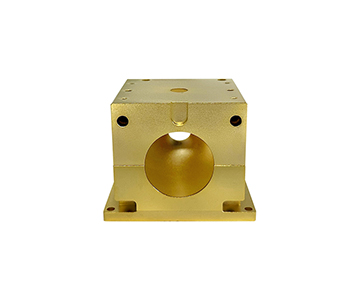
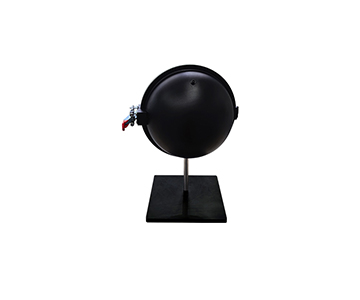
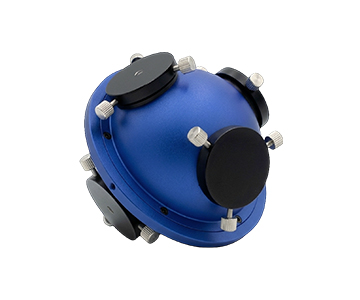
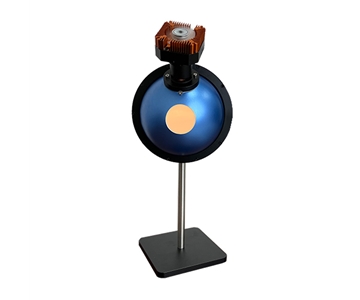
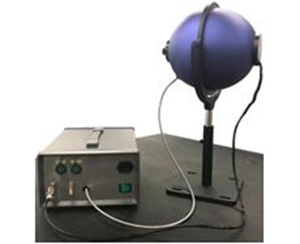
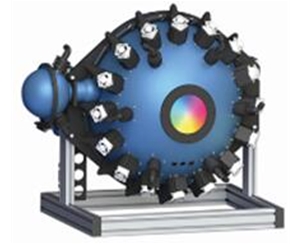
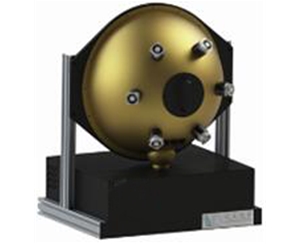
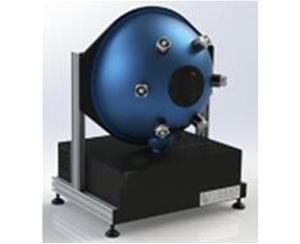
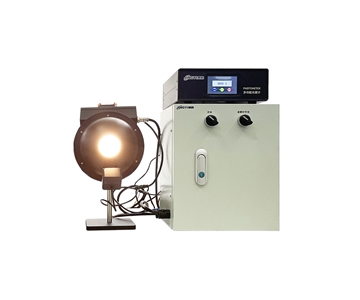
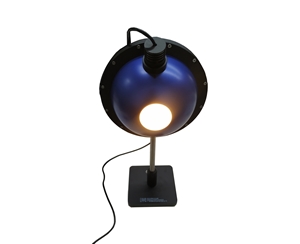
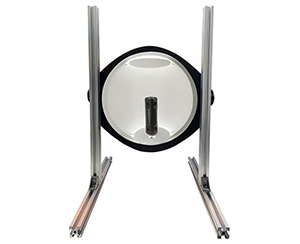
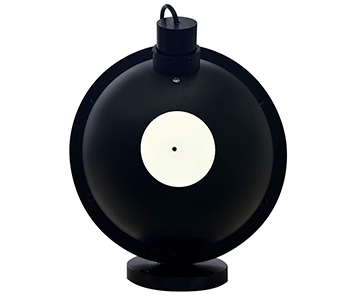
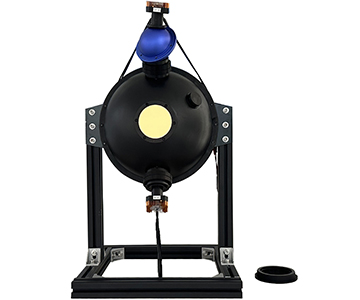
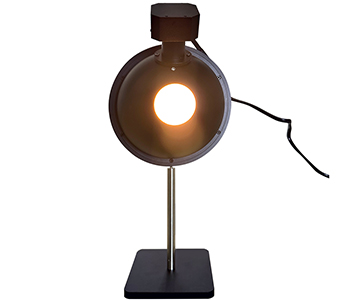
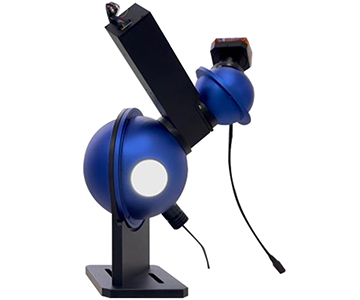
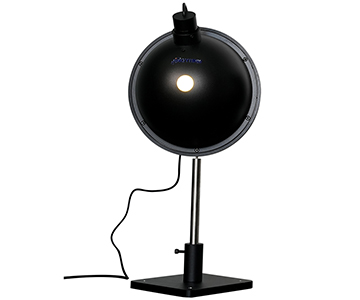
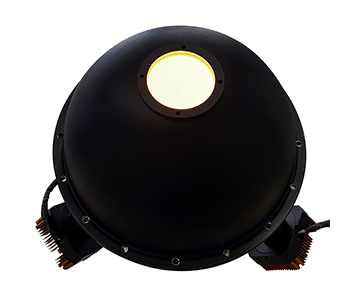
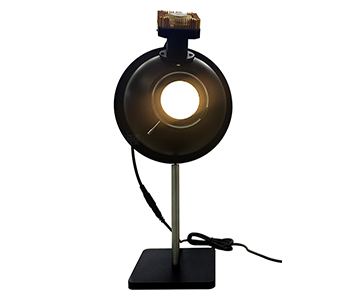
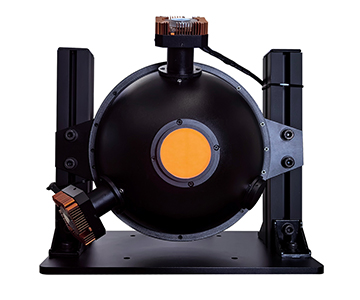
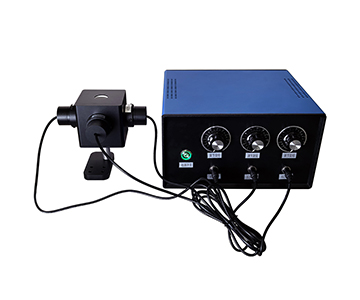
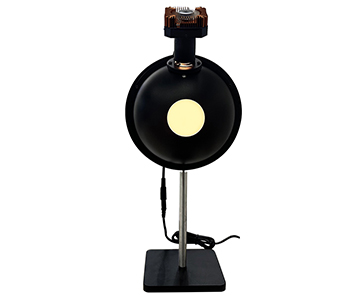
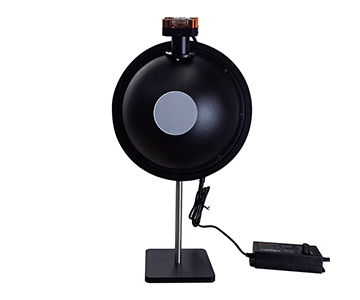
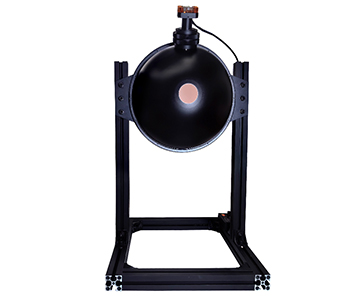
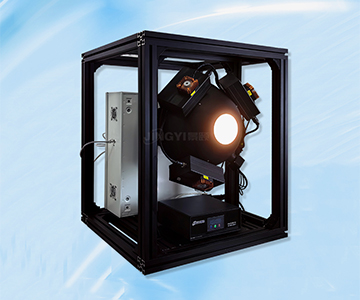
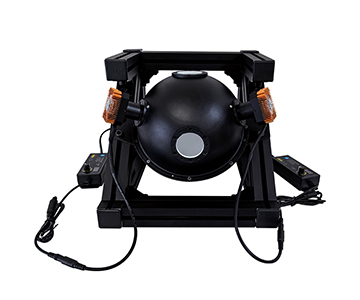
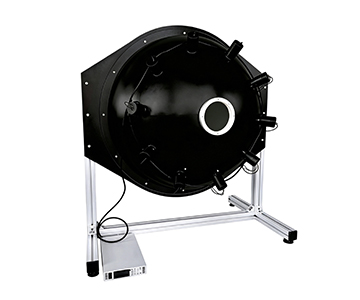
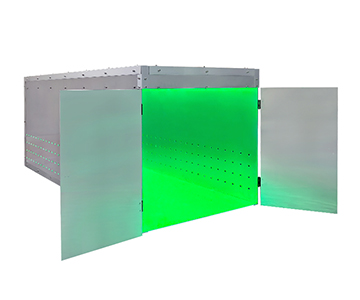
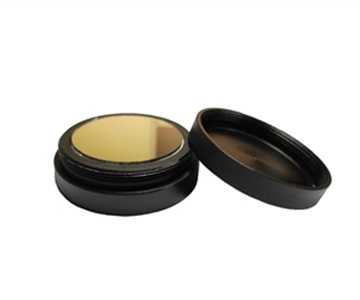
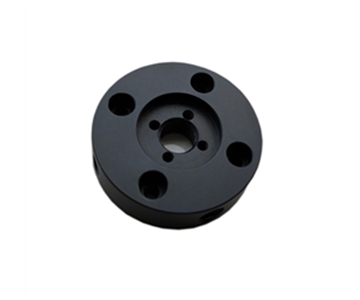
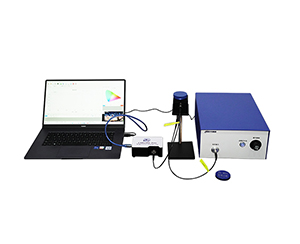
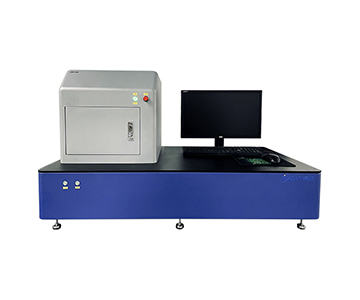
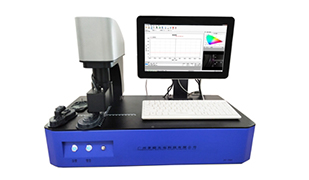
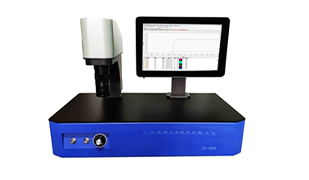
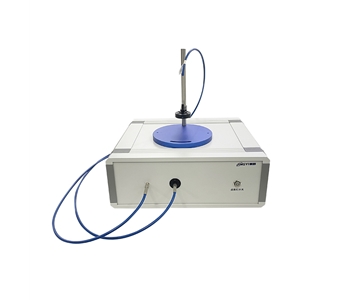
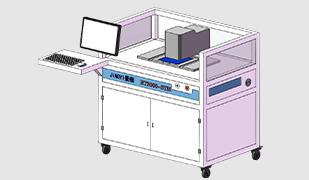
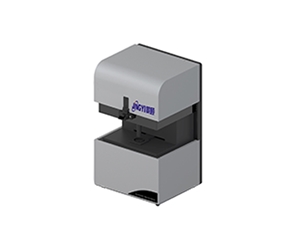
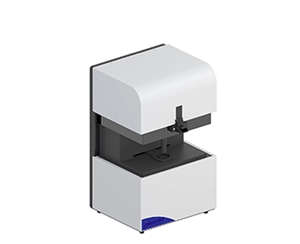
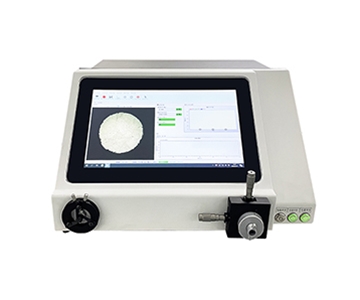
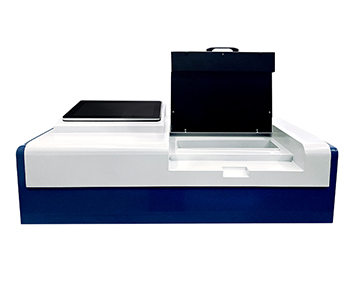
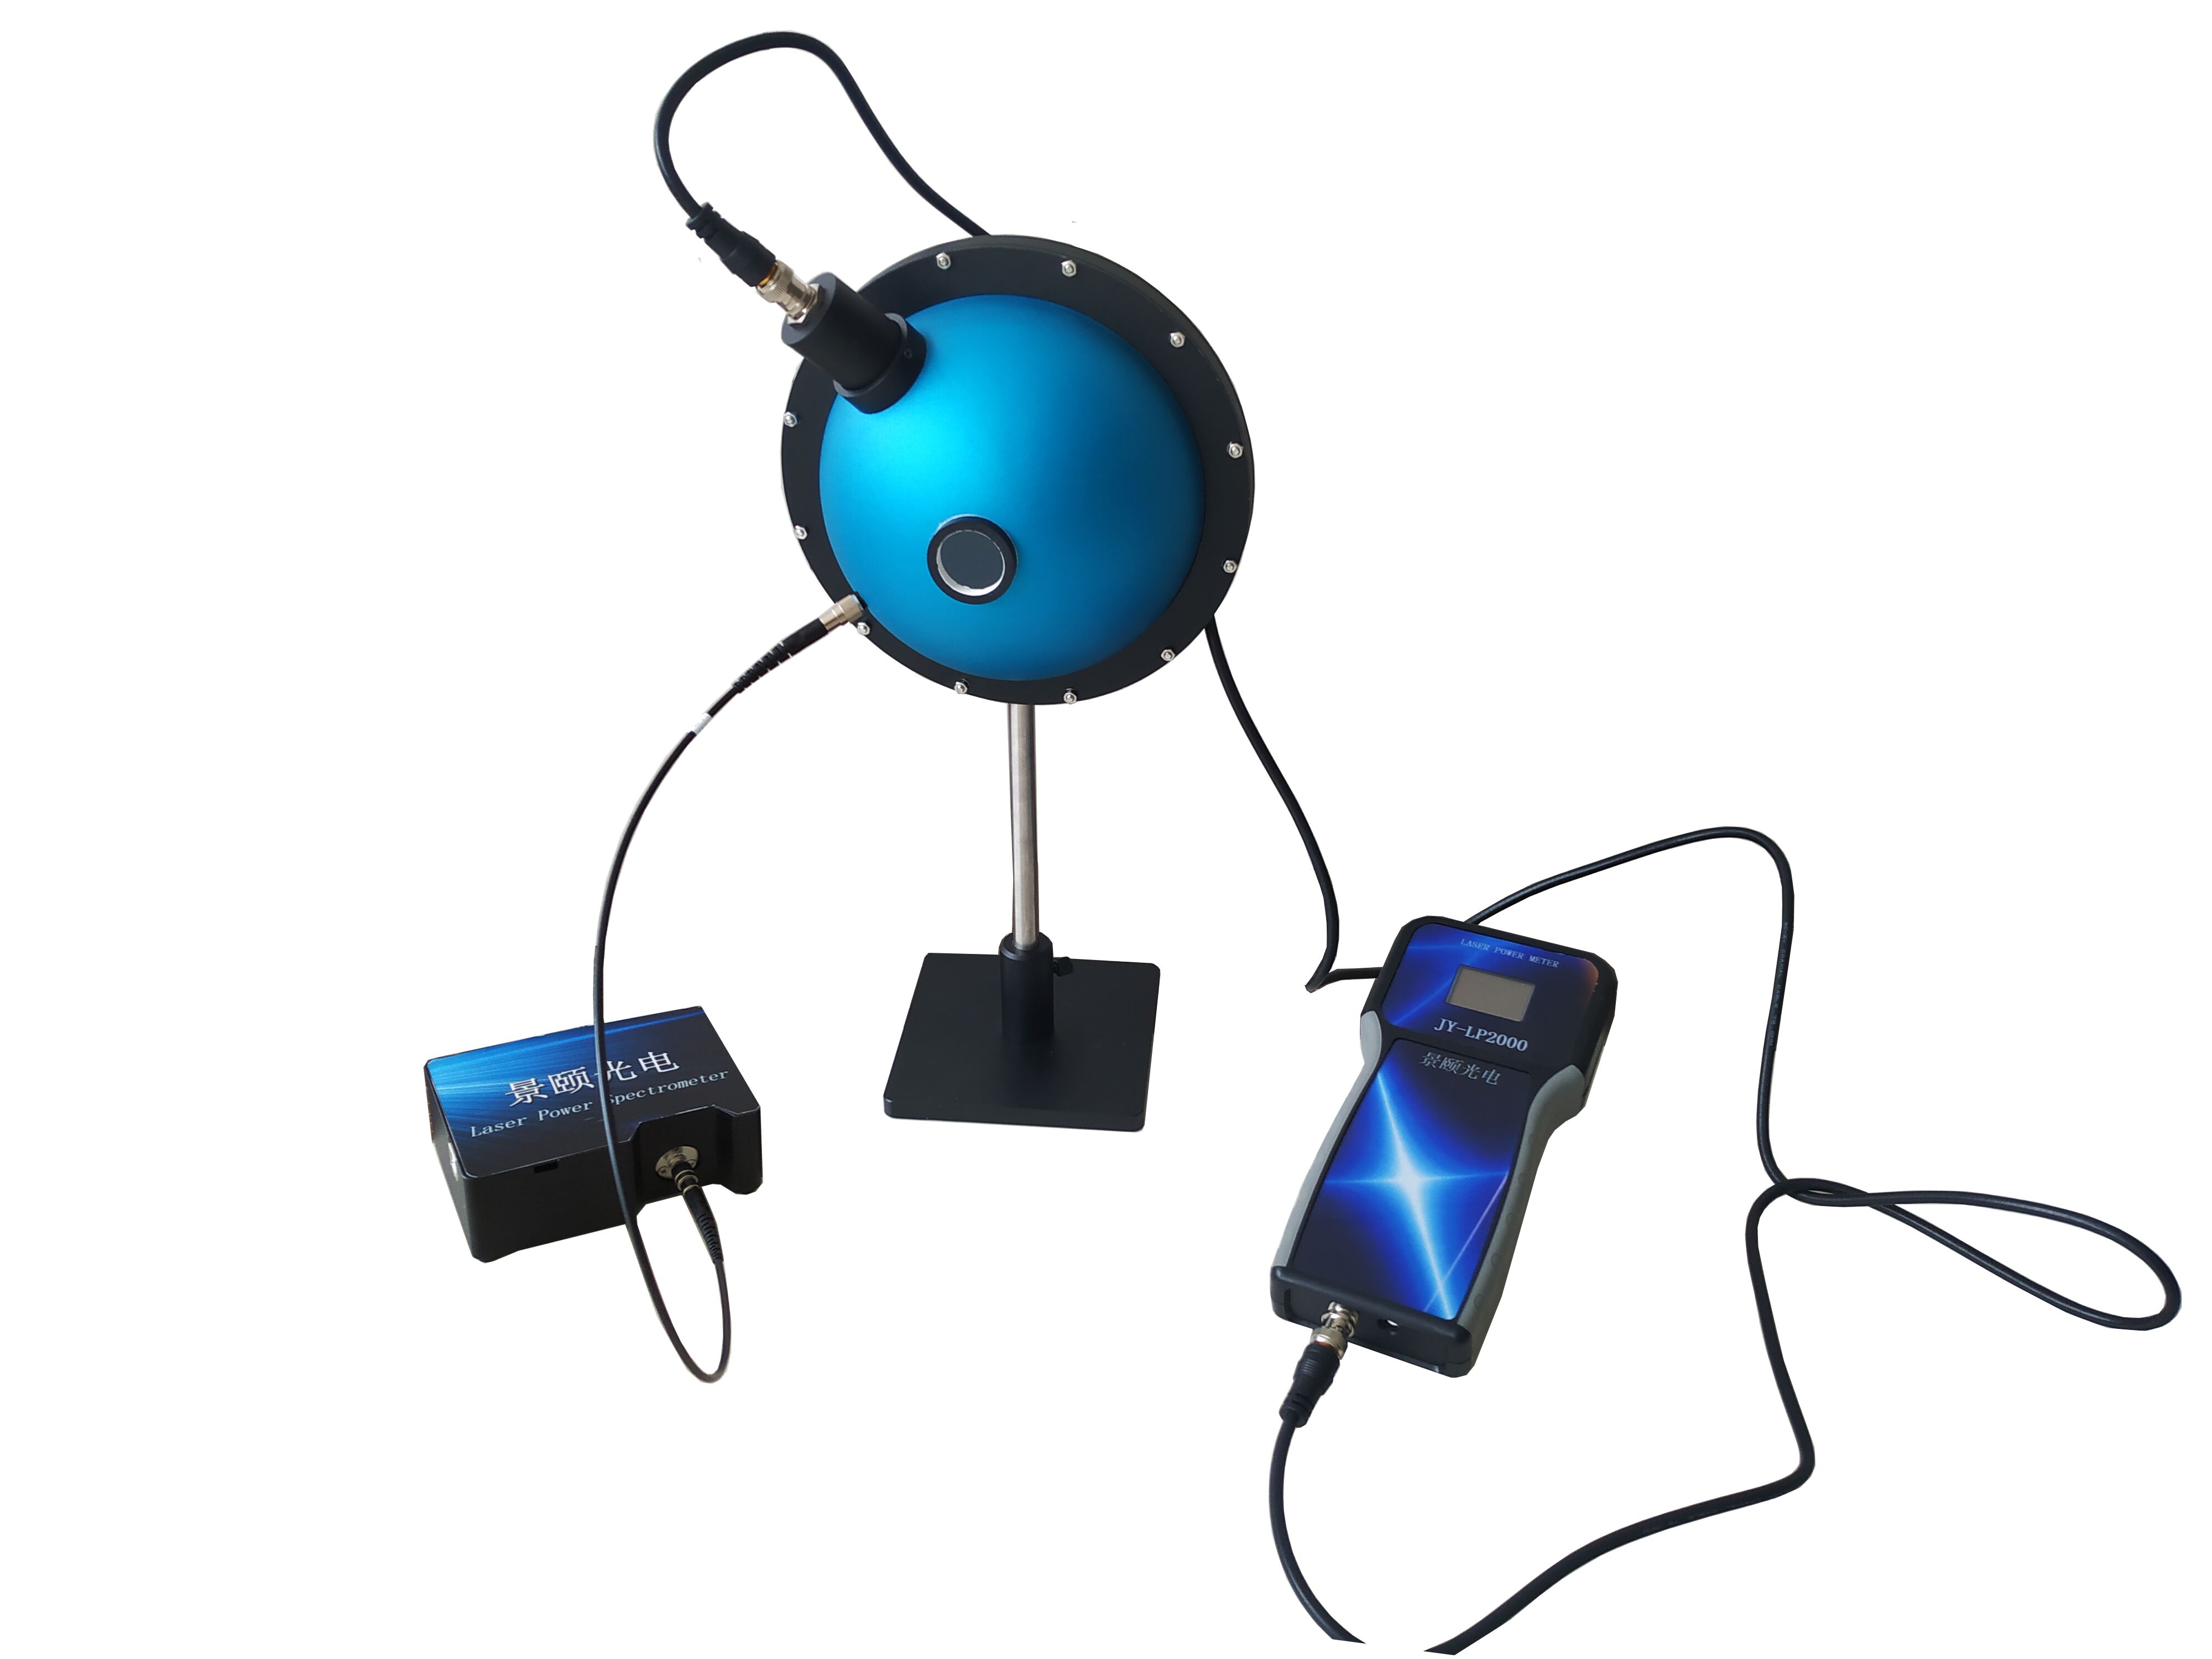
System A, a mainstream benchtop PL quantum yield platform, centers on a 3.3-inch (84 mm) PTFE-coated integrating sphere with a 1.5-inch (38 mm) sample port. PTFE holds reflectance stable across 350–1100 nm and resists moisture better than barium sulfate coatings, which matters for labs running continuous shifts in humid environments.
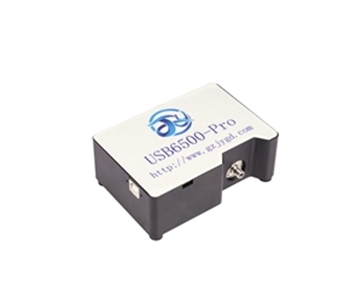
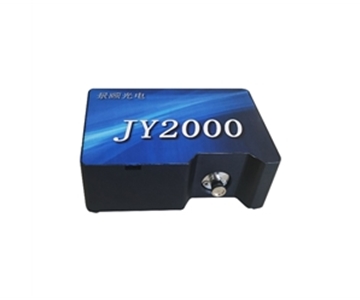
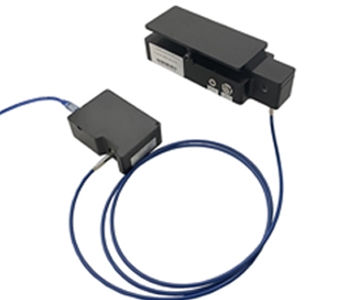
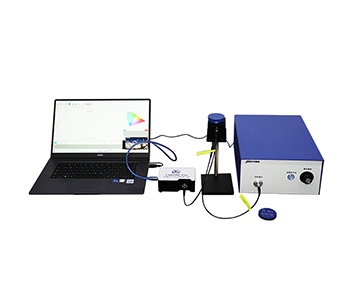
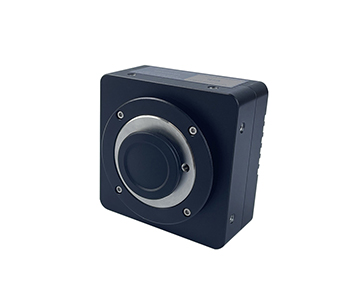
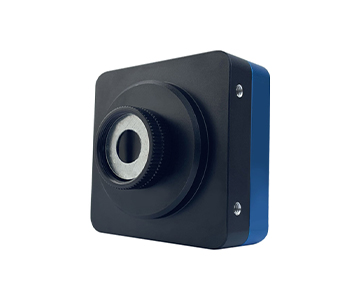
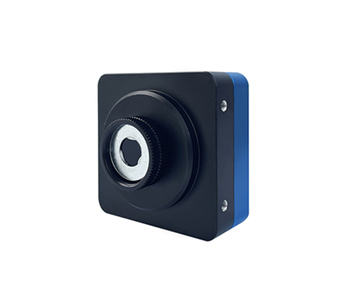
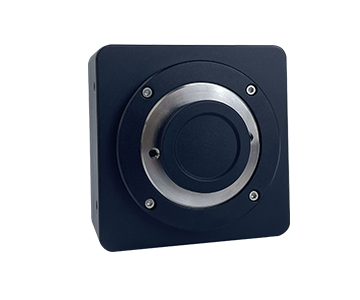
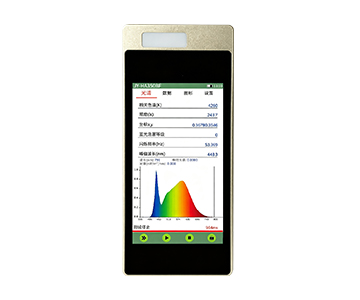
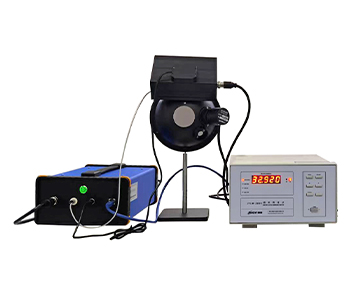
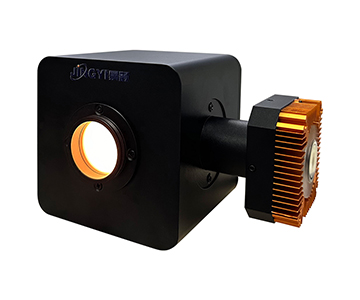
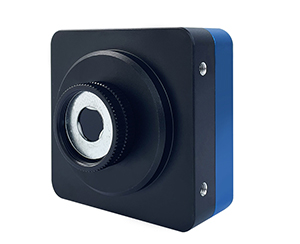
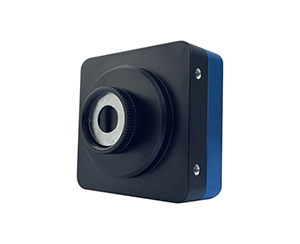
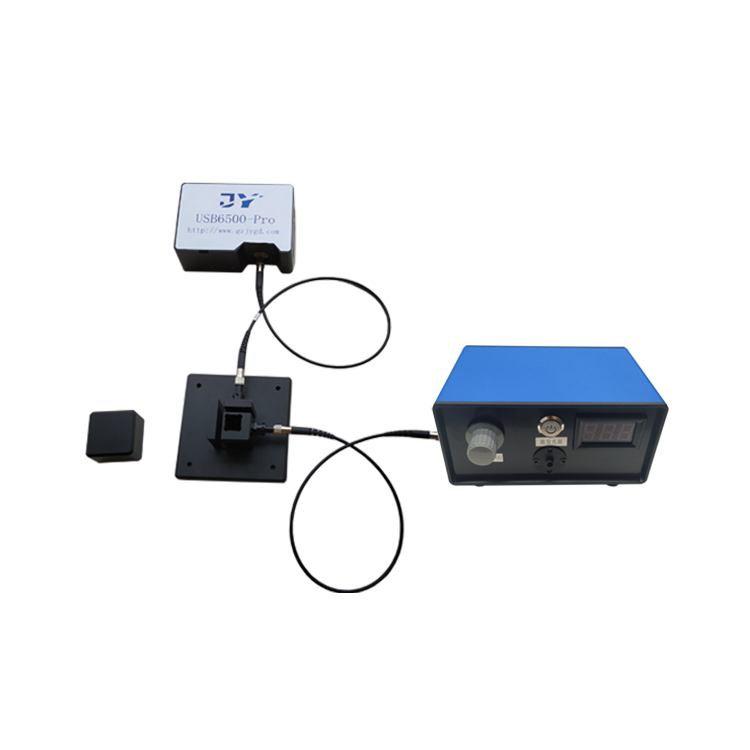
Excitation is delivered through a fiber-coupled LED or laser with adjustable intensity. On the detection side, a fiber spectrometer with 16-bit analog-to-digital conversion delivers a signal-to-noise ratio above 1000:1. That specification is not just a brochure number: it means weak-emitting powders do not get buried in detector noise, so CIE coordinates and peak wavelength calculations stay trustworthy.
Spectral resolution better than 1–2.5 nm becomes critical when measuring narrow-emission fluorophores. It separates adjacent emission peaks that a lower-resolution instrument would merge, preventing coordinate skew. A dynamic range above 100,000:1 allows the same frame to capture strong scatter and faint fluorescence simultaneously—no need to switch integration times mid-measurement.
Spare Part Replacement Cost and Modular Design
The purchase price is only the entry fee. The real cost of ownership for fiber-spectrometer-based systems surfaces at three points: excitation source decay, fiber-endface wear, and integrating-sphere coating aging.
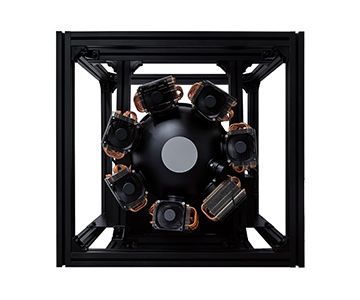
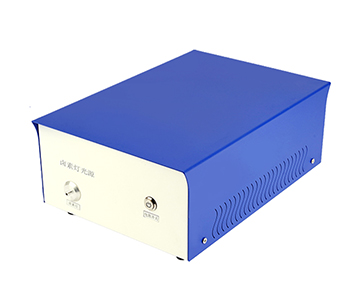
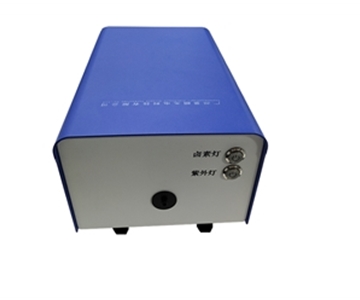
Take the excitation source. System A uses fiber-coupled LEDs covering 365–940 nm at 5 W electrical input. When an LED degrades, a modular design lets you swap the single source module in roughly 30 minutes. A non-modular architecture forces a full optical-head return to the factory, stretching downtime to several days. That difference alone can decide whether a QC line keeps running.
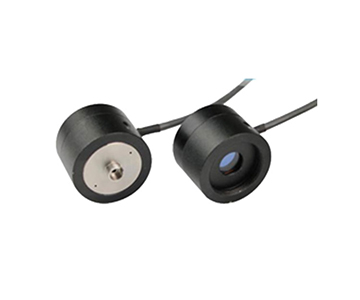
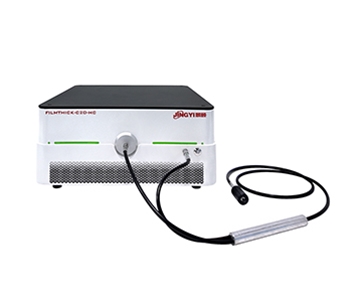
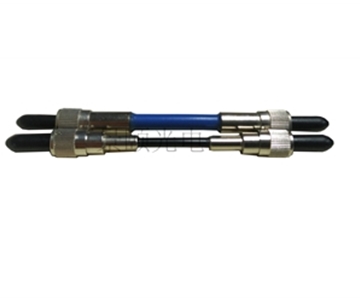
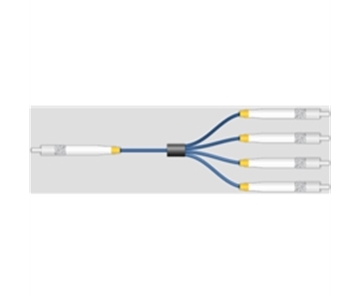
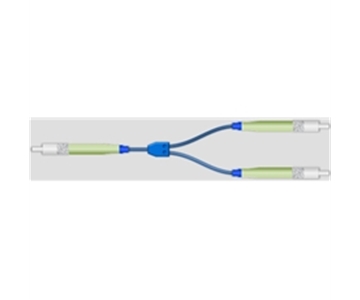
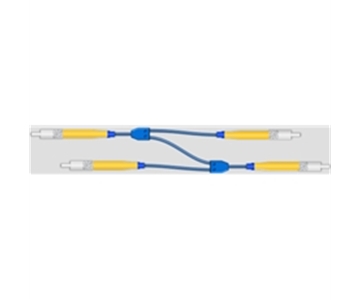
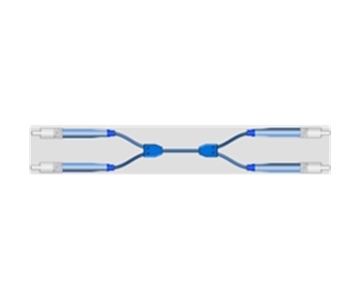
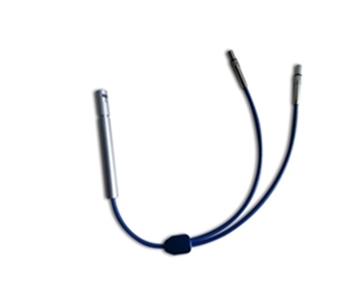
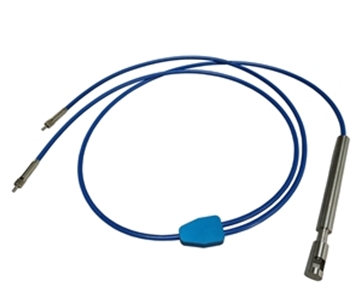
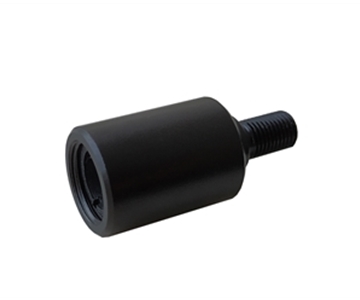
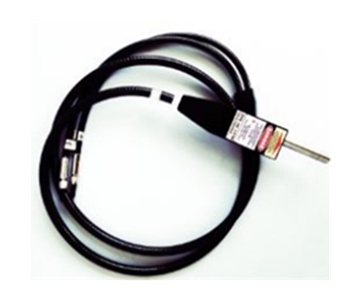
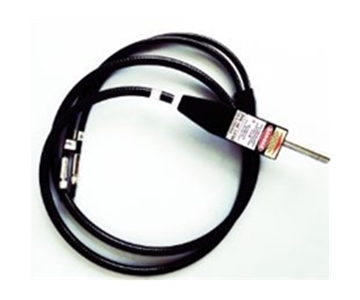
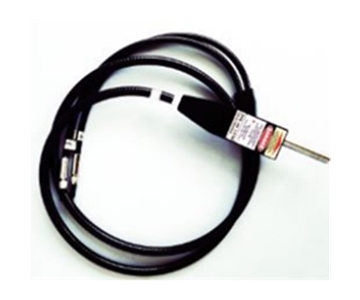
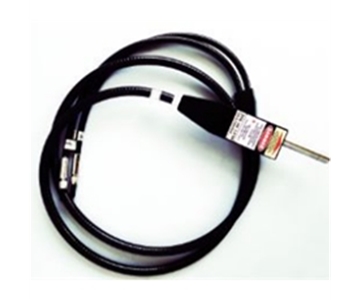
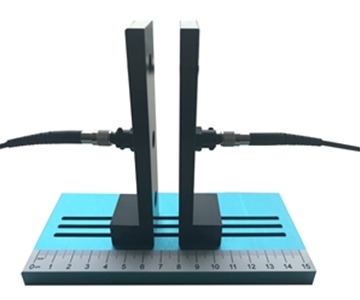
Fibers are the next consumable. Standard configurations use a 1000 µm (1 mm) core, 1 m long. Frequent sample-chamber cycles scratch the endface. If the system uses a universal SMA905 interface, you can buy replacements off the shelf. Proprietary integrated probes, by contrast, inflate spare costs and extend lead times.
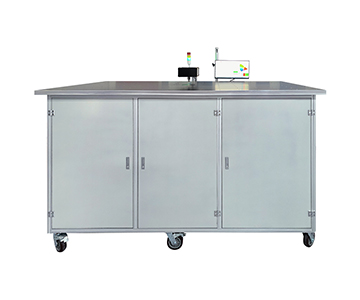
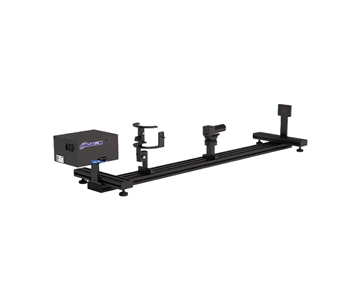
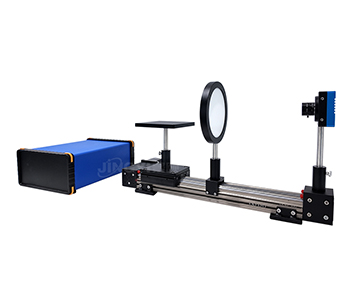
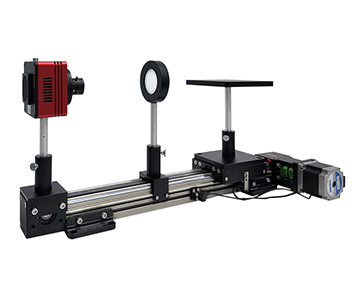
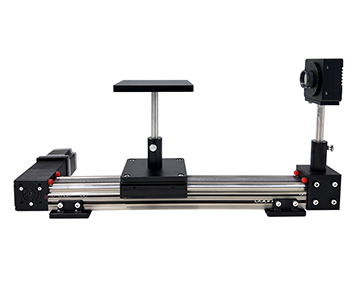
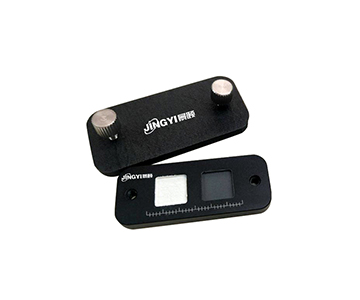
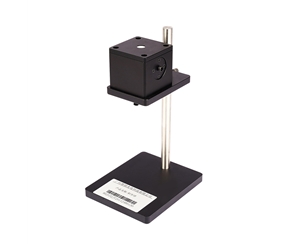
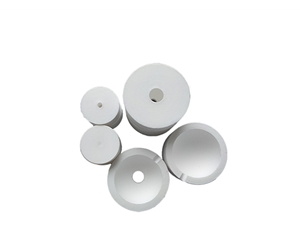
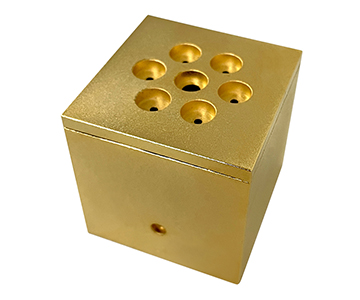
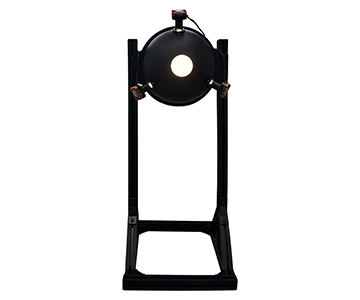
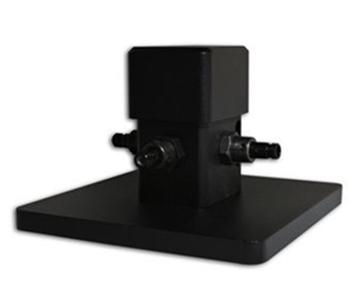
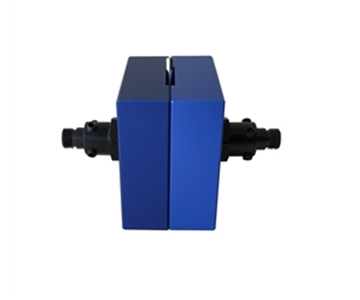
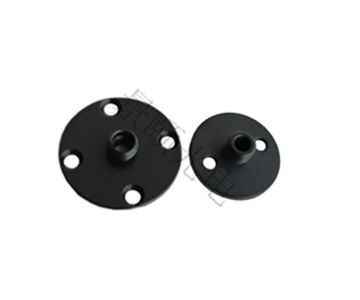
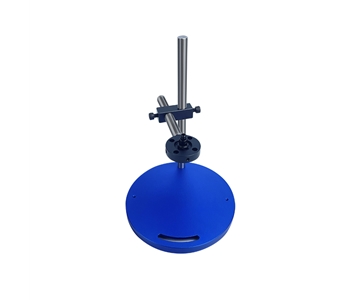
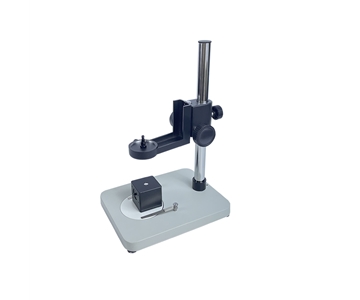
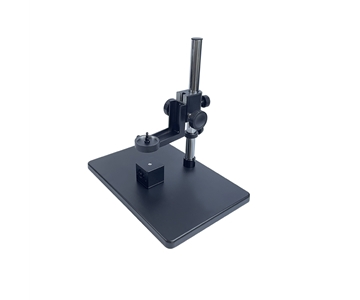
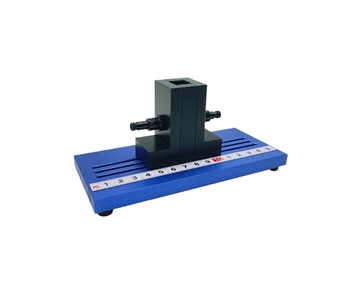
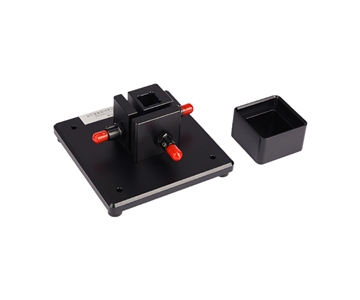
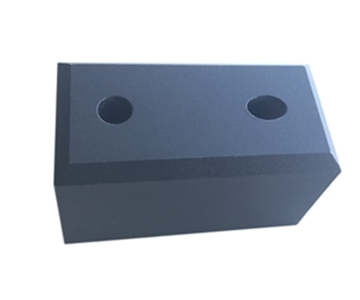
Sample fixtures deserve equal attention. Magnetic or fixed-position holders ensure repeatable placement and lower operator-induced error. Motorized Z-stage fixtures fit unattended lines, but the motor and rails are moving parts—their maintenance interval should be written into the contract. During procurement, quote the lead time and unit price for source modules, fibers, and fixtures separately. A low upfront quote loses its appeal when hidden maintenance fees surface six months later.
PL vs. EL: Where the Configuration Boundary Lies
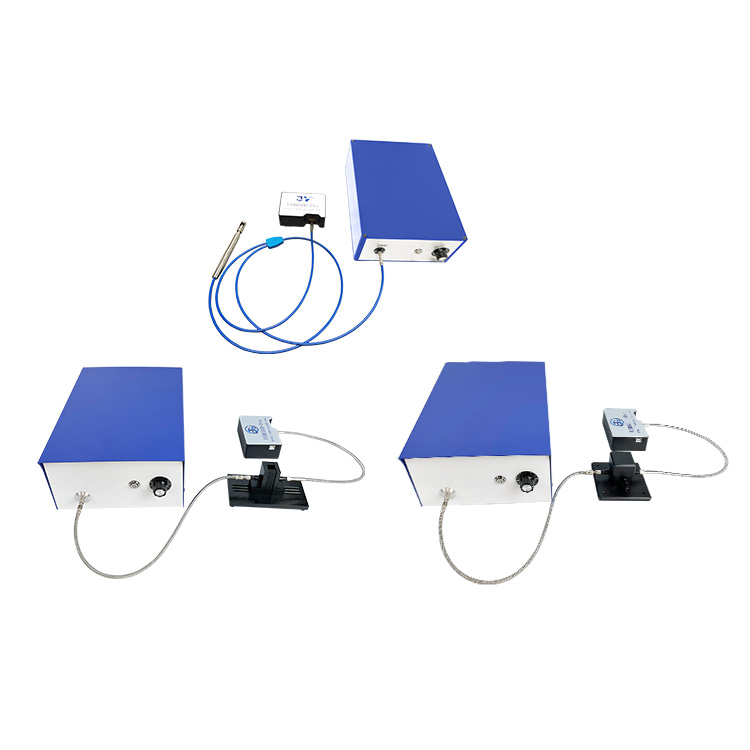
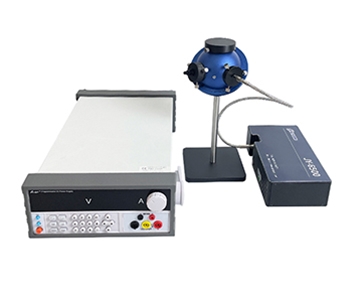
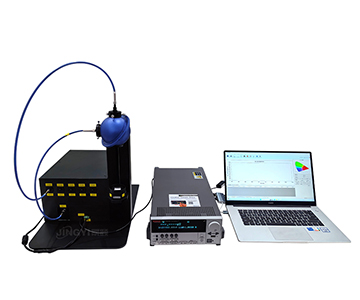
Photoluminescence (PL) routes use external light to probe a material’s intrinsic emission capability. Electroluminescence (EL) routes drive the actual device with a source meter to measure external quantum efficiency under operating current. The spectrometer core is interchangeable, but the excitation end and sample stage differ.
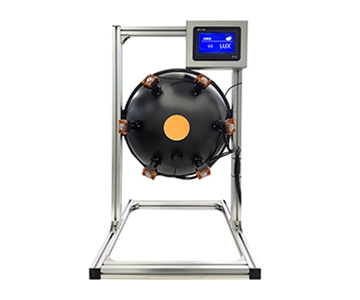
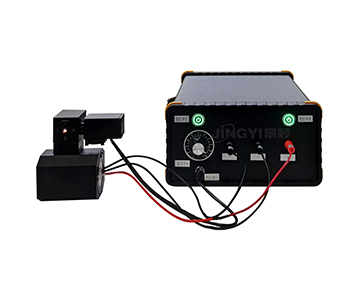
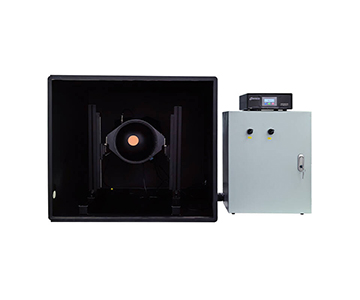
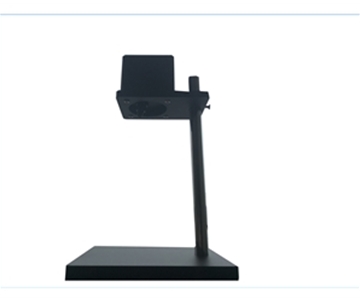
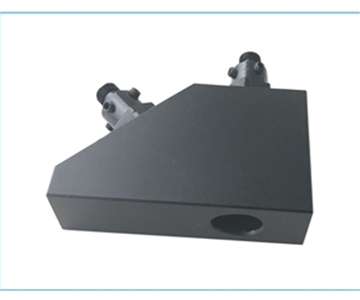
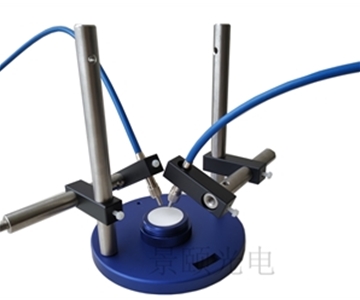
An EL-capable configuration adds a source meter (typically in the 2400/2450 class) and outputs quantum efficiency versus current density curves, targeting OLED and QLED device validation. High-brightness samples use the 3.3-inch sphere; low-brightness or irregularly shaped devices pair a 1.5-inch sphere with a probe station.
For most materials labs, starting with a PL system covers powders, solutions, and films at the lowest total cost. Add EL only when device packaging validation begins. Many PL systems reserve expansion slots, so a source meter and EL fixture can be retrofitted without buying a second full system.
Quantified Deployment Results
One university materials group replaced its manual reference-method workflow—“prepare standard, measure absorbance, calculate ratio”—with the automated absolute method: “load sample, set excitation wavelength, read result.”
•Before: 22.4 minutes per valid sample (including standard correction).
•After: 4.2–5.8 minutes per sample, with software-automated photon counting.
•Improvement: 73.2%–81.3% reduction in operator time.
Traceability also improved. With NIST-traceable source calibration, radiance, CIE coordinates, peak wavelength, and radiant flux appear on one screen, removing transcription errors from multiple instruments. The lead engineer’s feedback was not about speed. The real gain was smaller result variance across multiple operators during night-shift rotations.
Caveat: these numbers reflect a typical lab environment. Actual cycle time on a production line depends on sample absorbance and chosen integration time.
Cross-Environment Migration Rules
Moving from a materials-analysis lab to a QC line follows three non-obvious rules.
First, “absolute methods beat reference methods” only holds when standard management is weak. If your line already runs a strict recalibration schedule, reference methods remain viable—but they consume more labor.
Second, bigger integrating spheres are not always better. A 3.3-inch sphere suits routine bulk films and high-brightness devices. For small or low-brightness irregular samples, a 1.5-inch or even 1-inch port stabilizes light collection and reduces stray light inside the sphere.
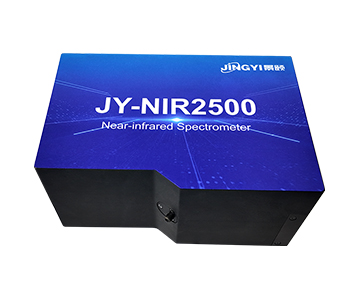
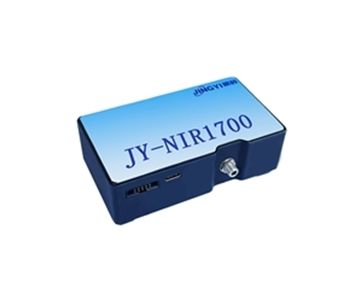
Third, from a spare-cost view, interface universality beats peak specifications. A near-IR system rated to 1700 nm looks attractive on paper, but if its fibers, sources, and software are proprietary, a single point of failure locks you into vendor-dependent repairs.
Operational Boundaries and Real-World Constraints
These systems are not universal. The base spectrometer covers 350–1100 nm. Emitters beyond 1100 nm require a separate InGaAs detector, or the efficiency curve gets truncated.
PTFE coatings age slowly under intense excitation. Reflectance drift introduces systematic error, so recalibration intervals should match your usage intensity. Coating replacement is infrequent, but it is a hidden cost rarely included in the initial quote.
EL configurations raise the operator bar. Source-meter wiring, device fixtures, glovebox interfaces, and current-density sweep logic all require training. If your only task is powder quantum yield, an EL setup is over-procurement—more spare categories to maintain, with no return.
FAQ
Q1: Does measuring powder samples directly in an integrating sphere introduce large errors?
Powder scatters strongly, but the absolute method is actually more stable than reference-based approaches here. The key is fixed sample placement and keeping the light-collection port unobstructed. A magnetic fixture minimizes positional drift between runs.
Q2: How do I select the excitation wavelength?
Match it to the material’s absorption peak. Systems commonly support 365, 405, 455, 520, 532, 620, and 740 nm. Pick the wavelength that aligns with your sample’s absorption—there is no need to buy every option upfront.
Q3: What is the purpose of a quantum efficiency versus excitation power curve?
It reveals concentration quenching or saturation recombination. If efficiency drops sharply as power increases, non-radiative channels are competing for excitons—a direct signal for formulation adjustment.
Q4: How should I split procurement between PL and EL systems?
Choose PL for material screening. Choose EL only for OLED or QLED device efficiency validation. A pragmatic middle path: buy a PL system with confirmed expansion slots, then add the source meter module later.
Q5: How can I independently verify long-term data reliability of the system?
Use a NIST-traceable calibration light source for periodic checks. Log the spectrometer’s dark noise and the sphere’s reflectance drift over time. After any spare part replacement, re-run a blank reference and confirm the blank scatter spectrum shows no offset before returning the system to production.
Editorial Notes
Research Basis
: NIST-traceable calibration protocols and SEMI metrology guidelines, supplemented by product documentation for CHT-QE6500 and JY-QEY6500-PL/EL systems and in-house validation data from a provincial materials lab (n=120 samples).
Reviewed by
: Cai Xiaodong, Senior Application Engineer at Jingyi Optoelectronics, with 8 years of experience in integrating sphere spectroscopy and industrial QC equipment selection.
Sponsorship Disclosure
: Jingyi Optoelectronics manufactures fluorescence quantum efficiency measurement systems. Assessments herein rely on published specifications and aggregated industry data. No third-party compensation was involved.
Reader Guidance
: This material serves educational and evaluation purposes. Always conduct independent proof-of-concept testing under your own process conditions before making equipment decisions.
Publication Date
: October 2026
For detailed specifications and application notes on fluorescence quantum efficiency systems, search "Jingyi Optoelectronics + fluorescence quantum efficiency" or visit our technical library.