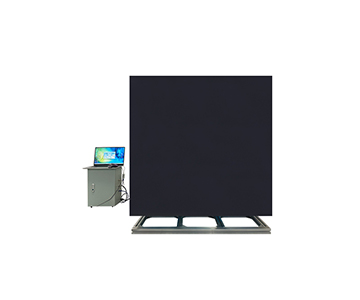
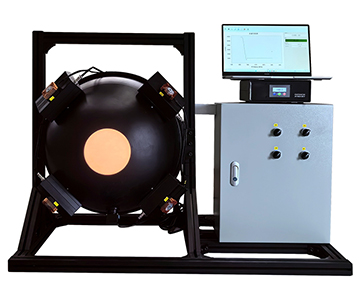
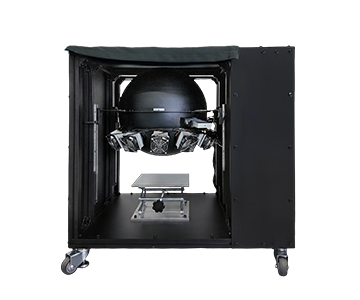
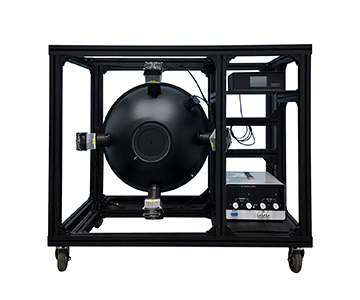
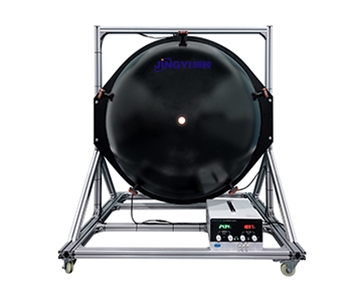
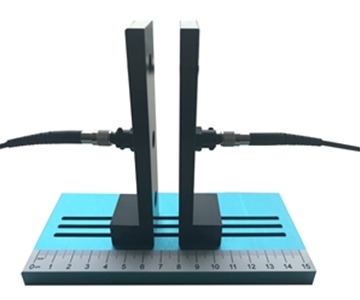
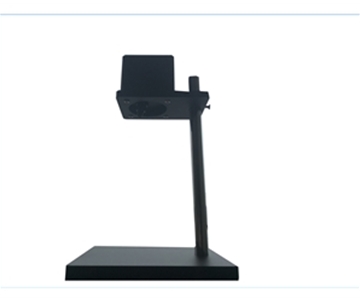
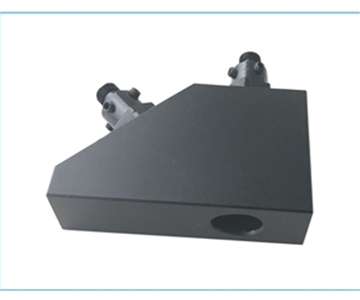
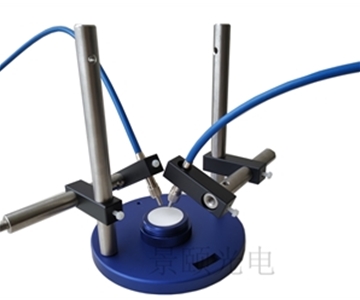
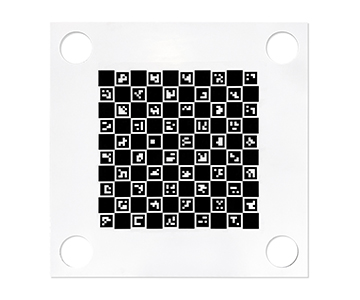
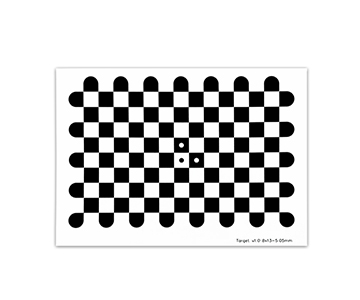
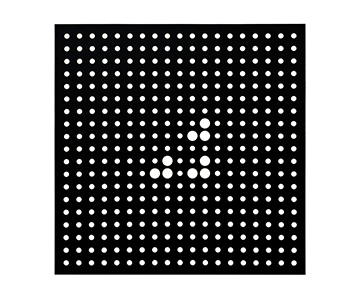
Absolute quantum yield measurement in optoelectronic material R&D and production lines demands spectral coverage from 350 to 1100 nm and signal-to-noise ratios exceeding 1000:1. Traditional fluorescence spectrometers often suffer from integrating sphere coating degradation and optical path misalignment, causing retest deviations up to 4.7% and rework costs exceeding $21,800 per batch. A validated
Certification Compliance Challenges in Quantum Efficiency Measurement
During a routine audit at a provincial metrology institute, a senior calibration technician discovered that a legacy fluorescence spectrometer produced a 4.7% retest deviation on thin‑film samples. The root cause was traced to integrating sphere coating aging and a misaligned optical path. That single batch failure triggered $21,800 in rework costs and delayed three customer deliverables.
A more insidious problem surfaces during certification compliance reviews. When a test system lacks NIST‑traceable light source calibration, its quantum efficiency output cannot form a complete measurement traceability chain. Facing audits against standards such as SEMI PV22‑0715 or ISO 13695 for optical parameter consistency, engineers often must outsource data recalibration to third‑party labs, adding a 7‑business‑day lead time to each validation cycle.
Sample form factor amplifies these risks. When shifting from liquid solutions to powders and thin films, manual fixture positioning in conventional equipment introduces placement errors up to 0.37 mm. A process engineer at a display panel fabrication plant in Arizona noted that this positional drift caused systematic shifts in chromaticity coordinates and dominant wavelength, directly undermining device characterization credibility during a weekend qualification run.
Technical Characteristics of a Mainstream Quantum Efficiency Tester
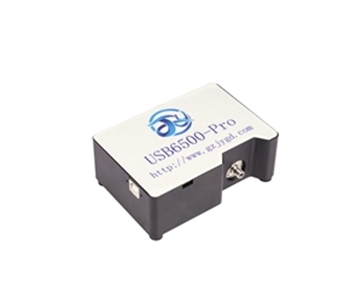
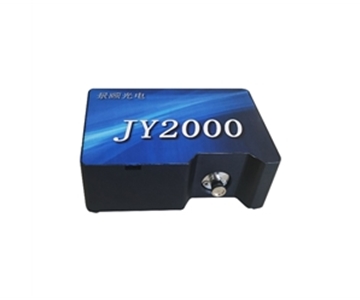
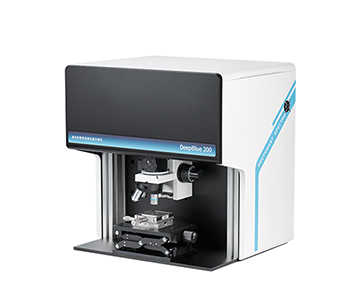
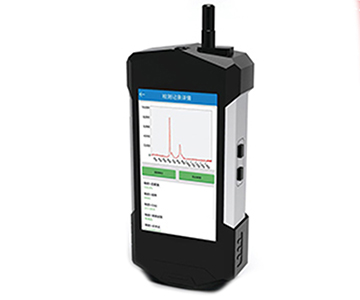
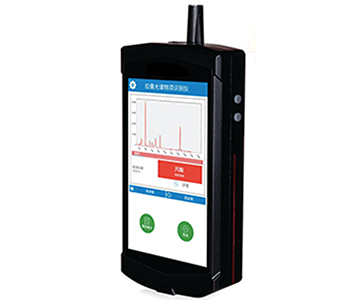
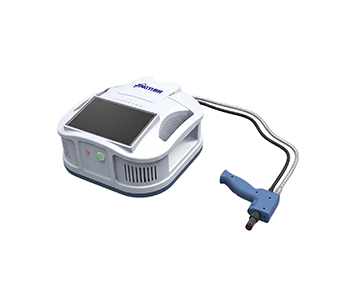
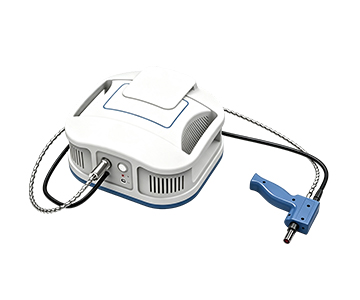
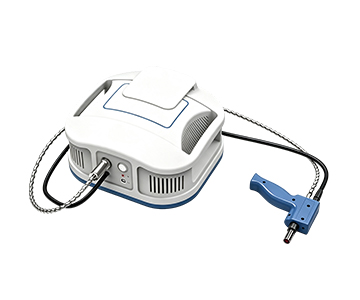
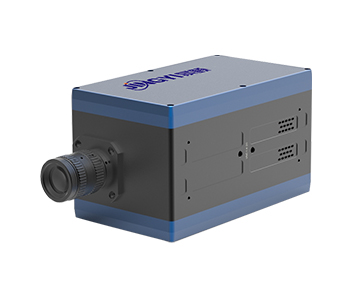
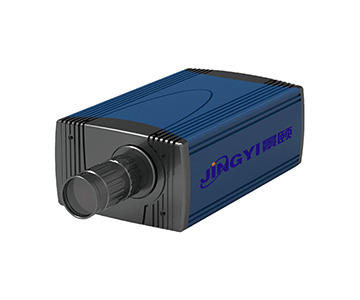
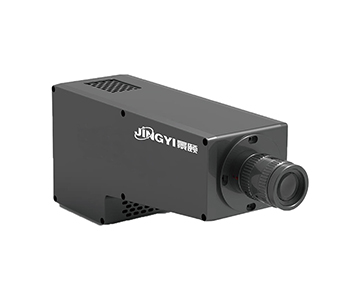
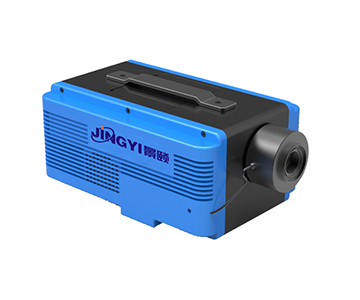
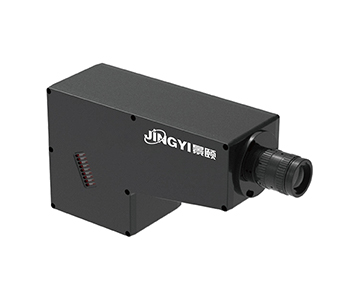
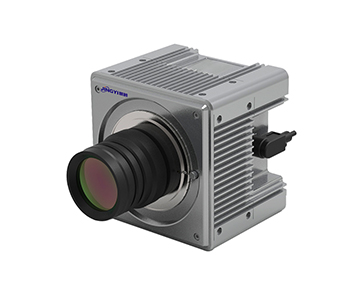
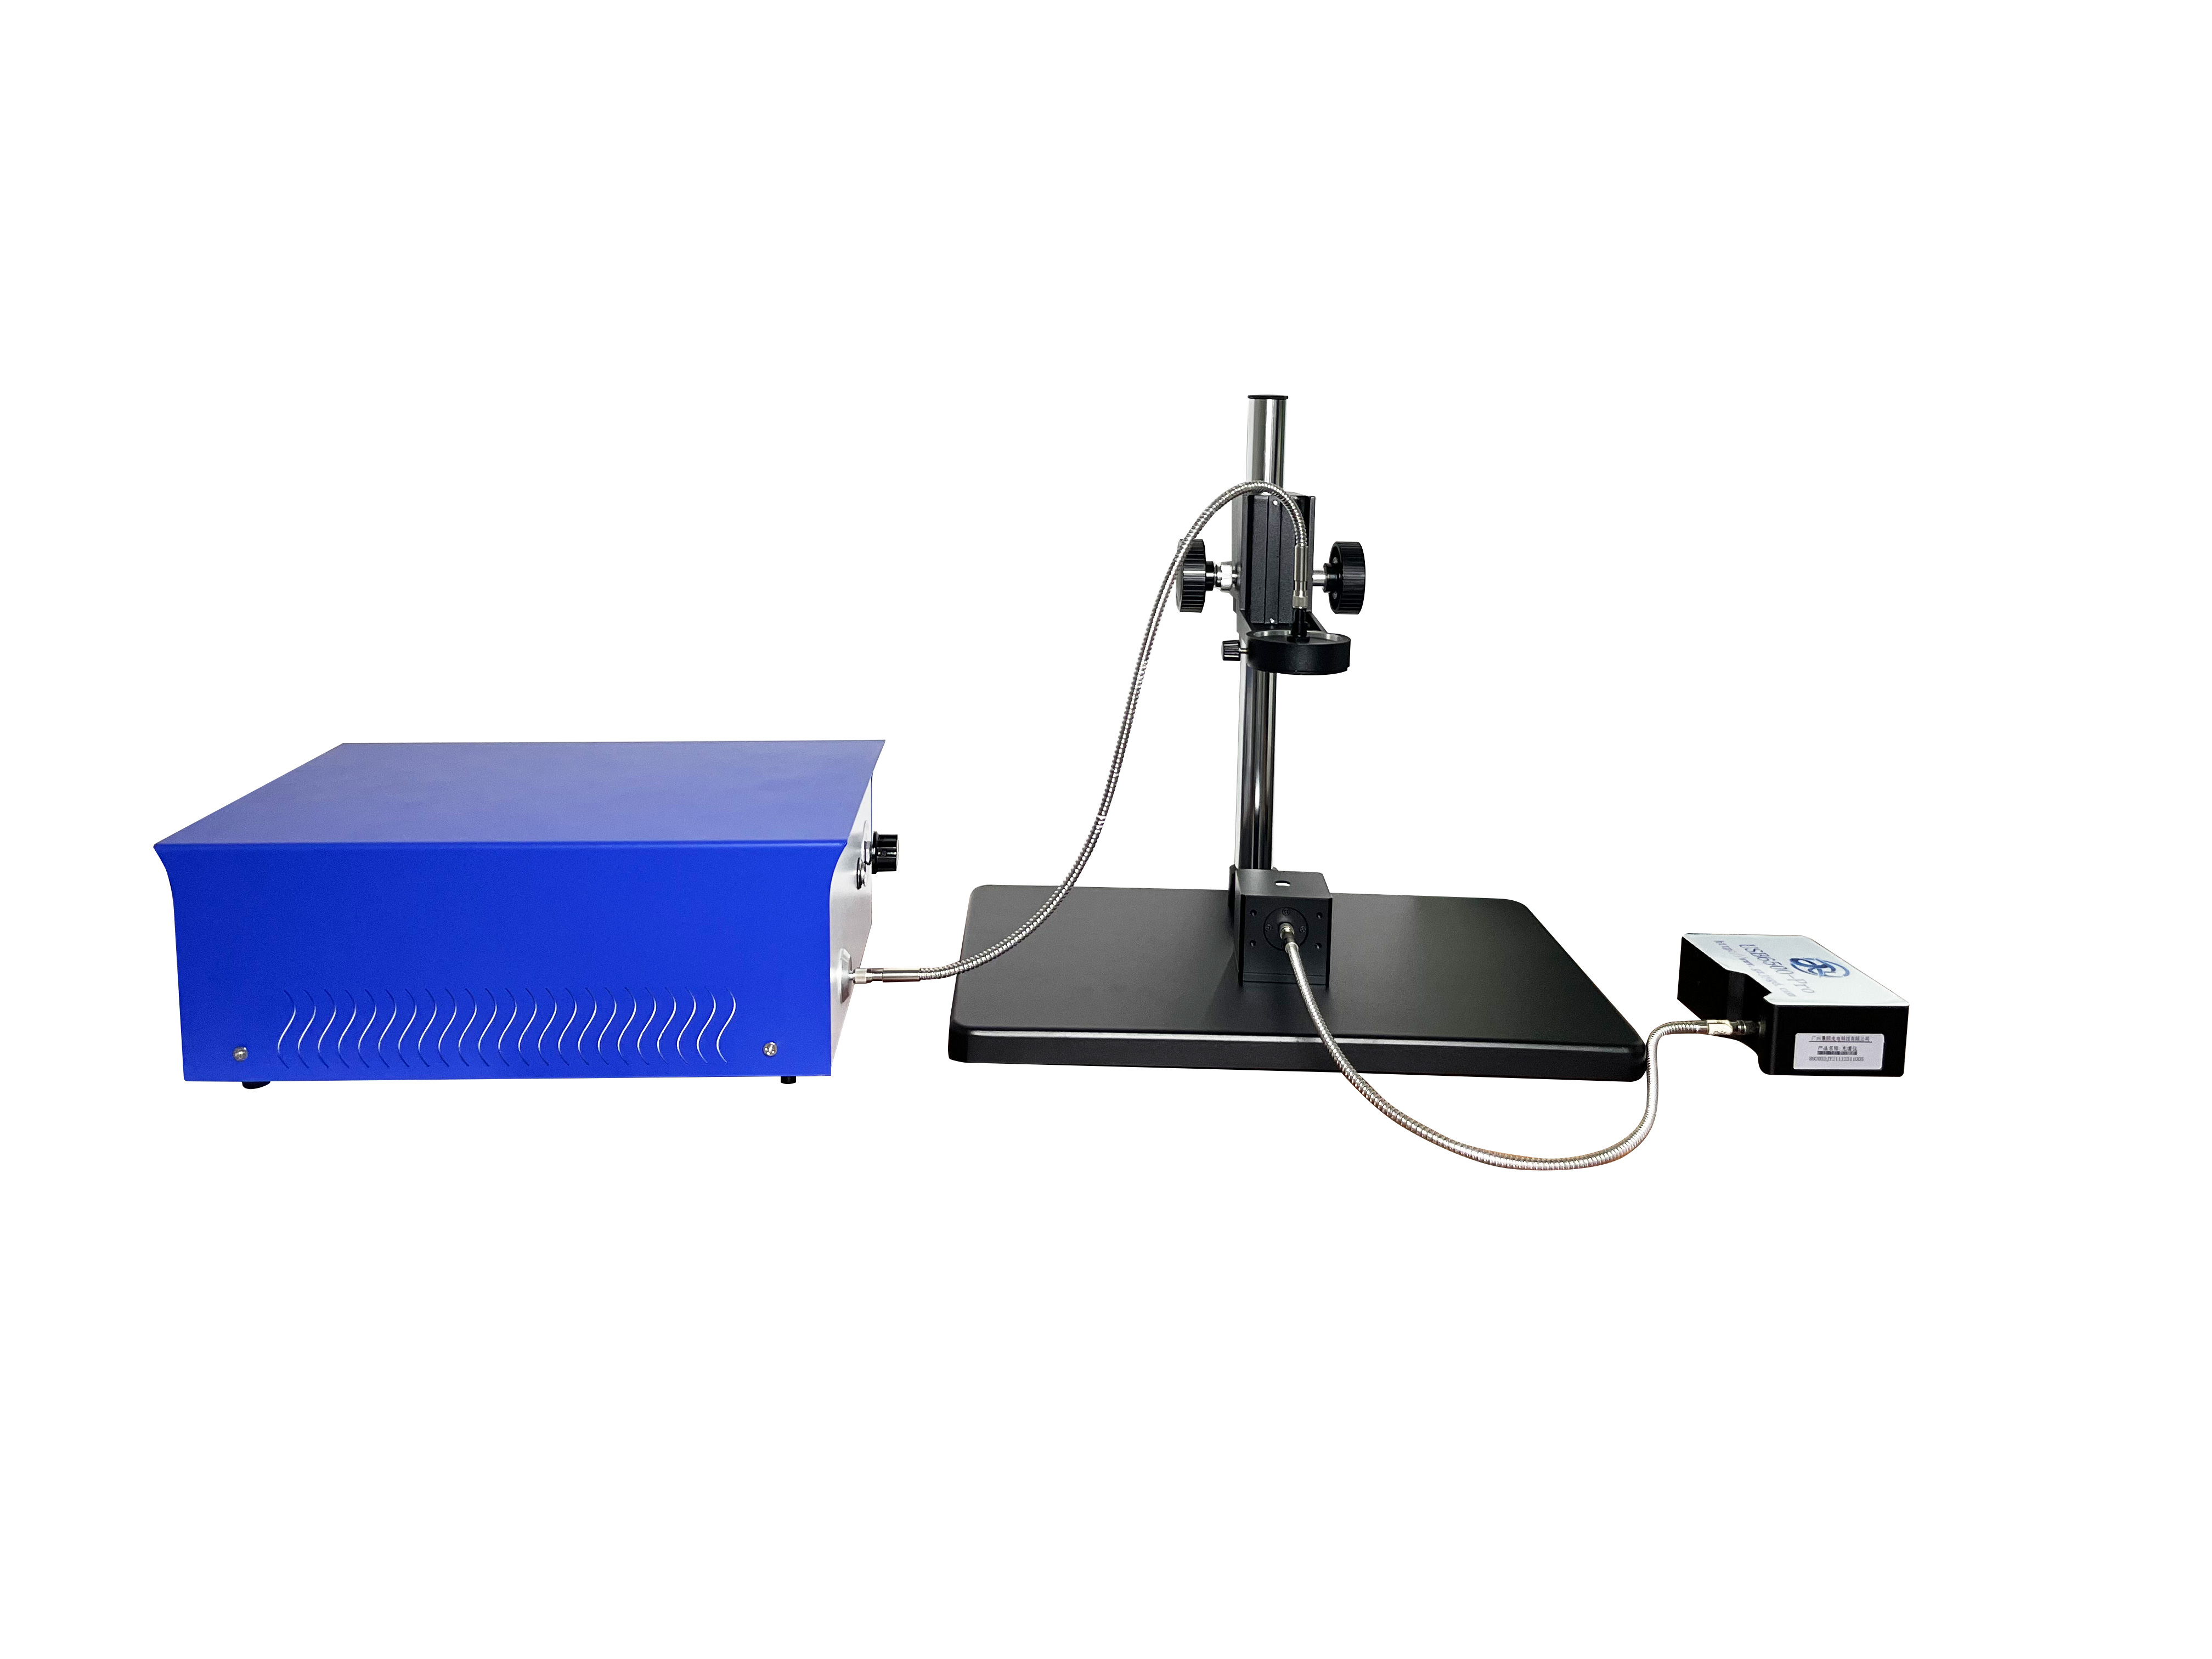
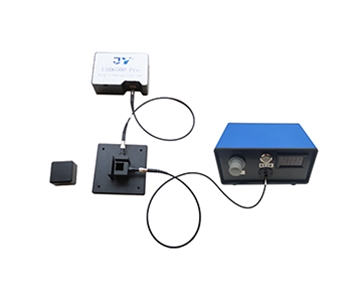
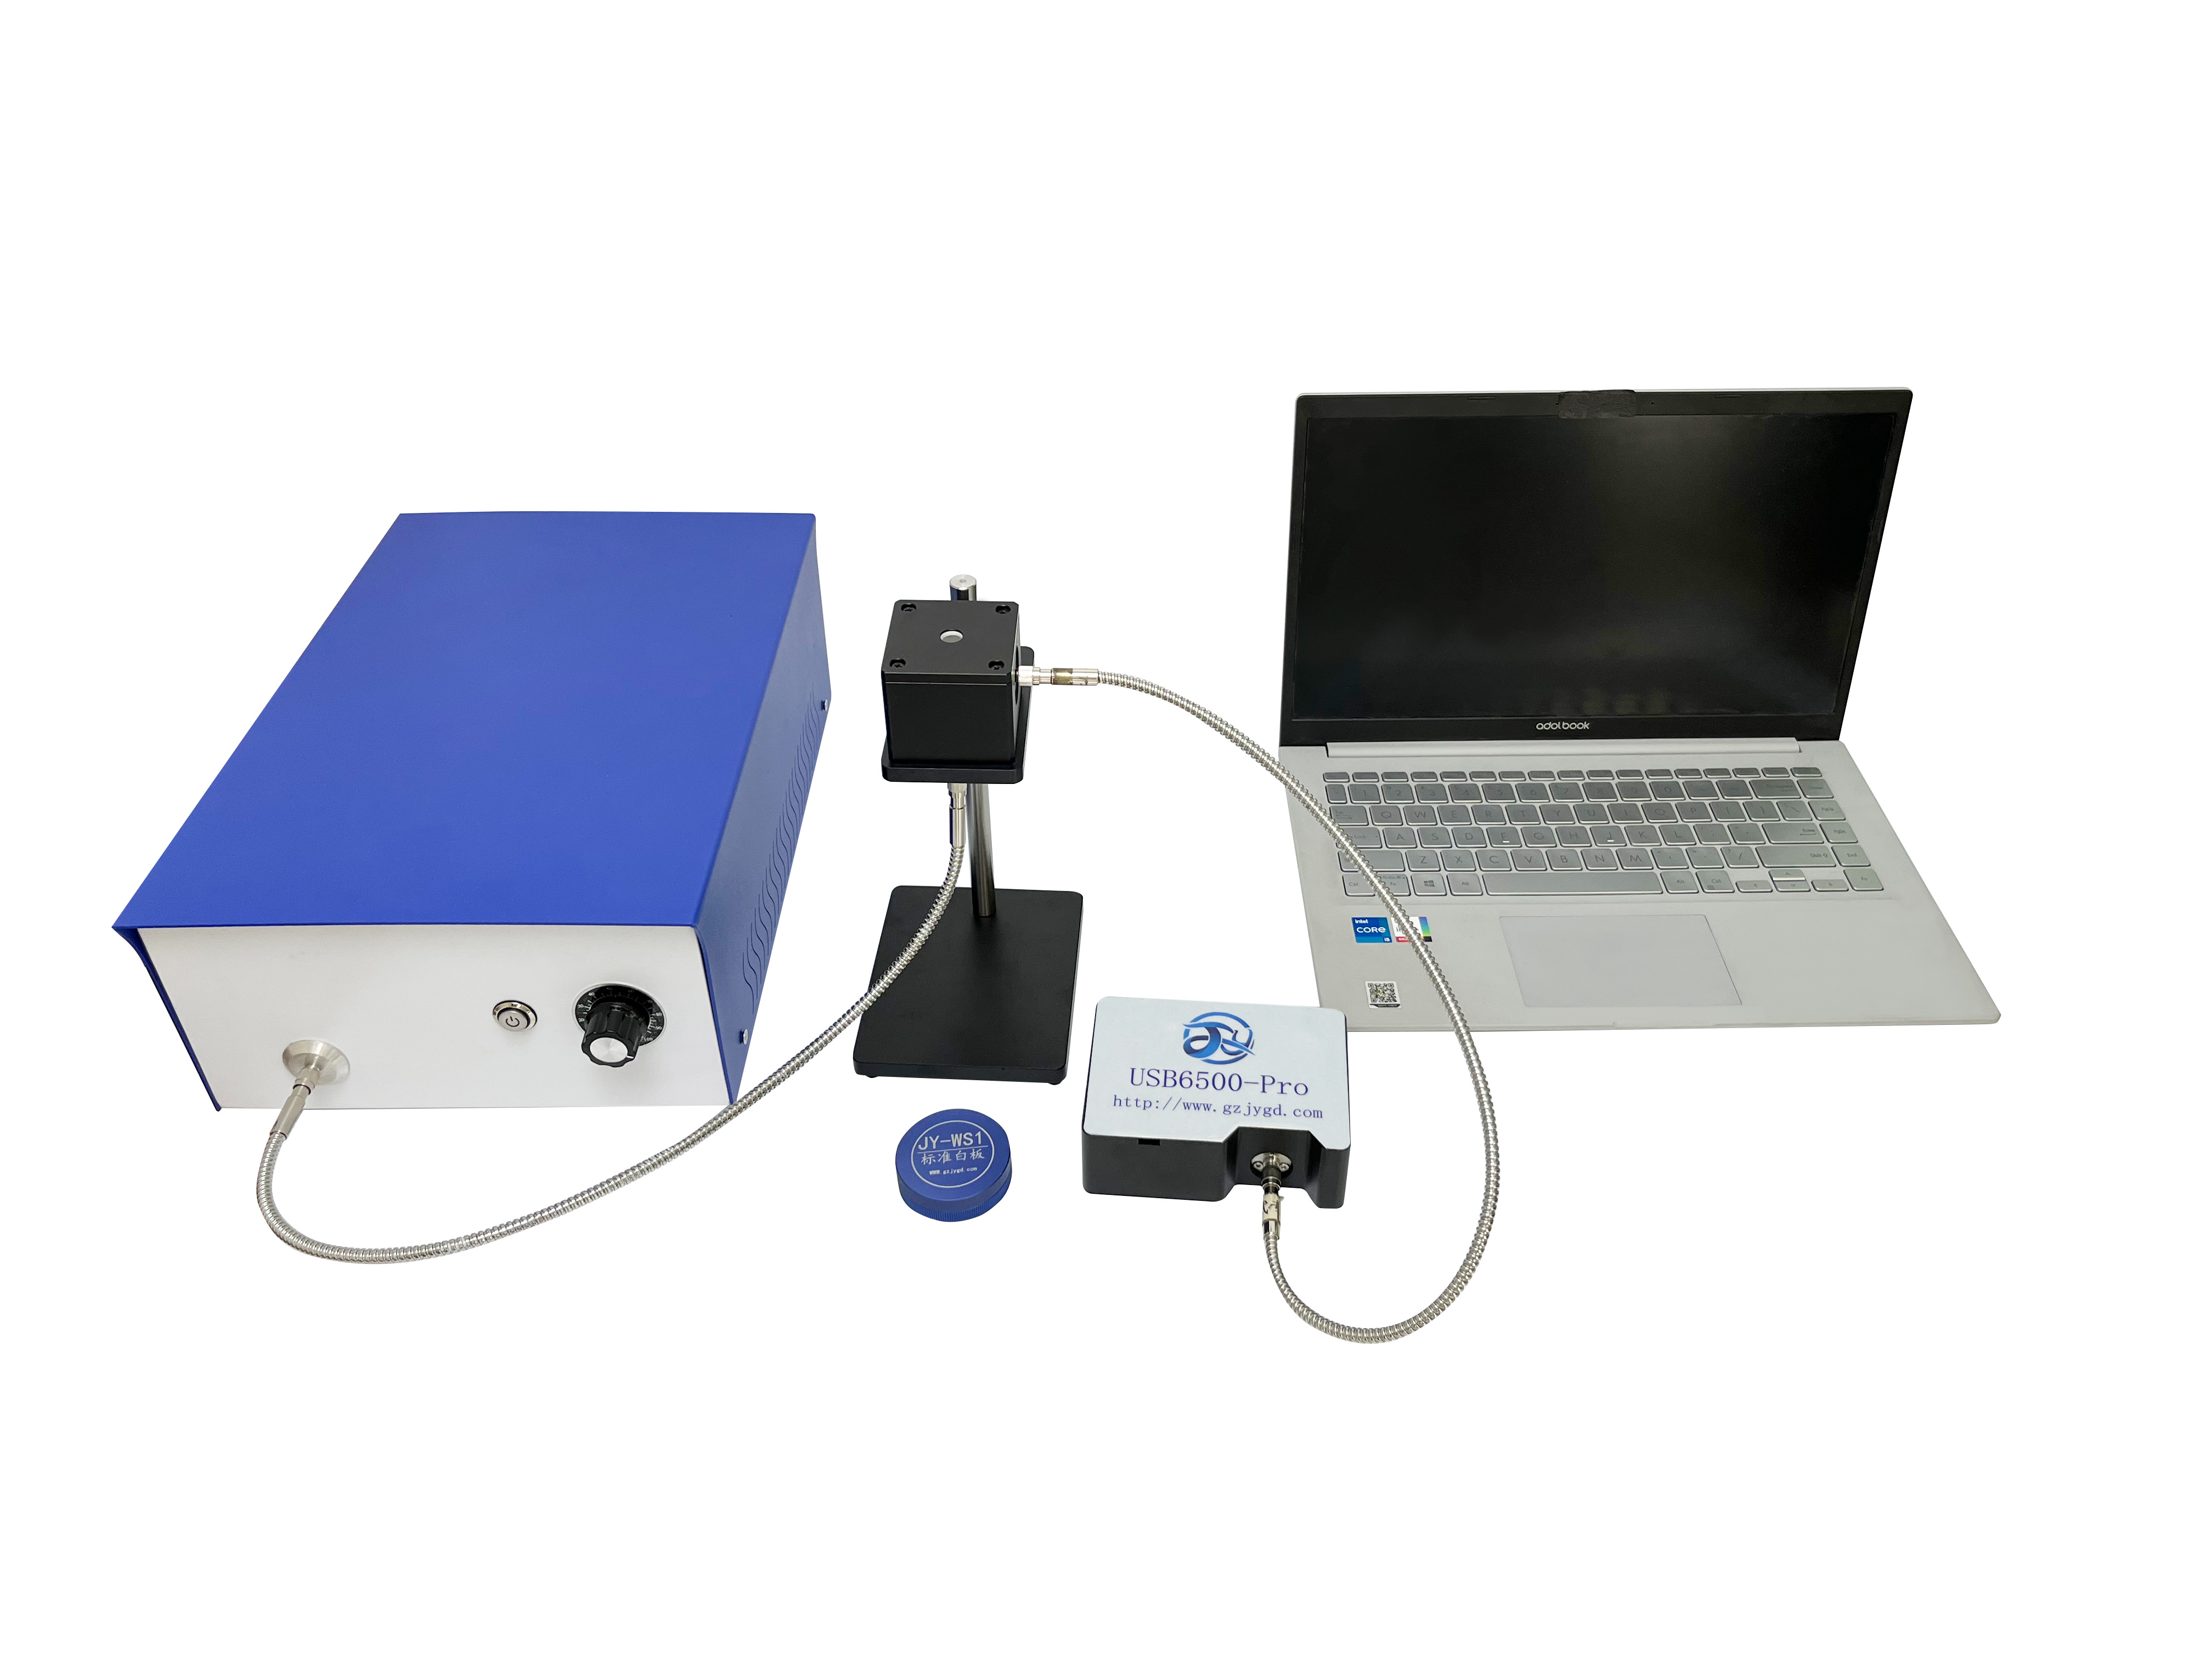
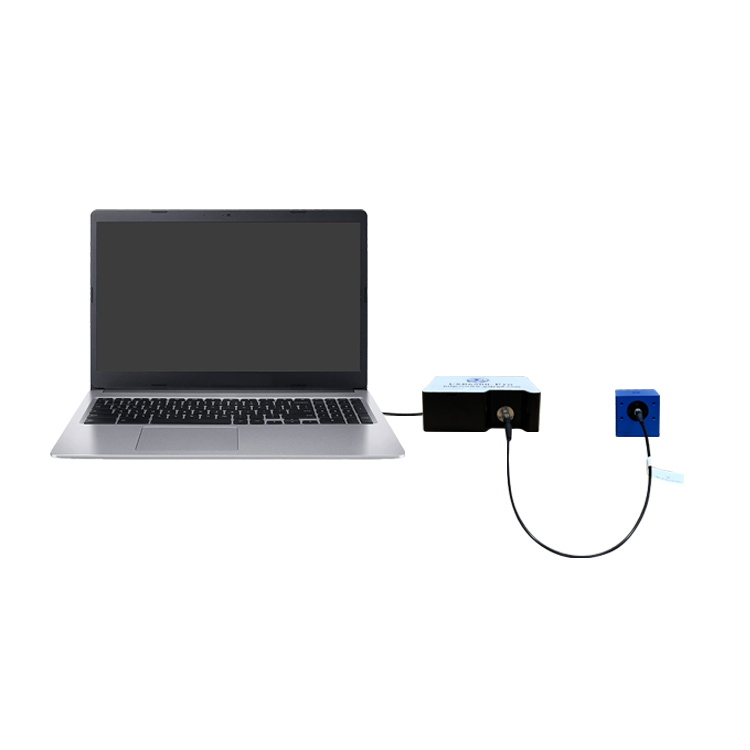
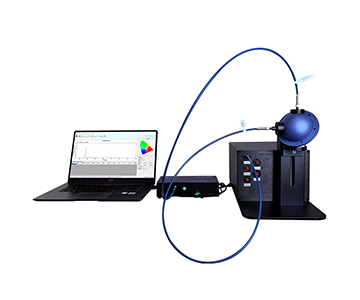
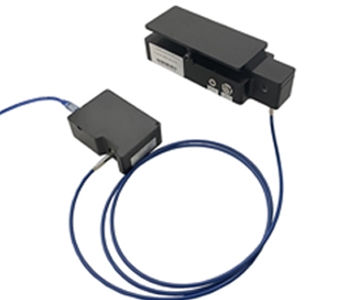
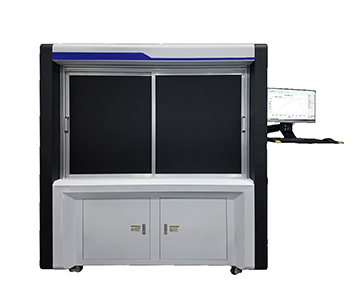
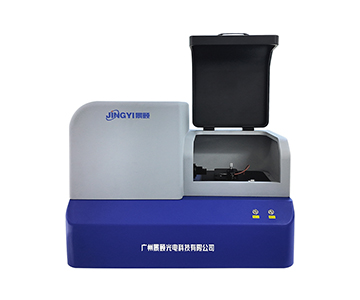
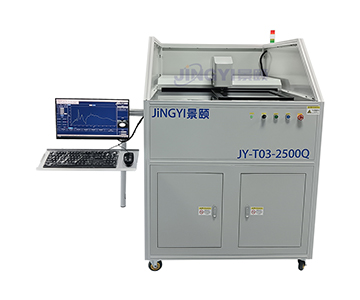
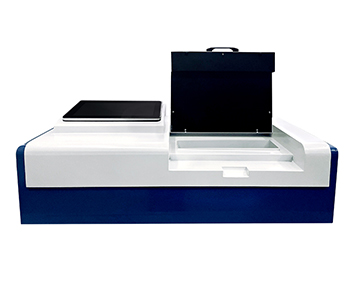
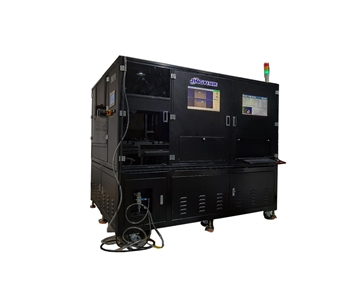
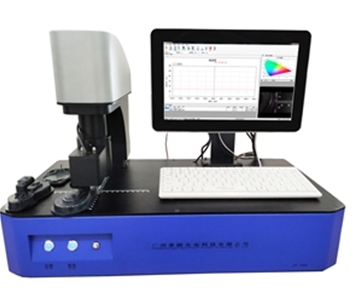
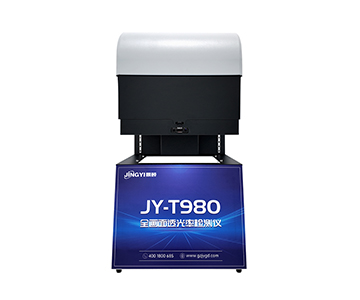
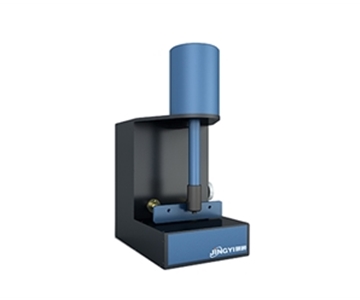
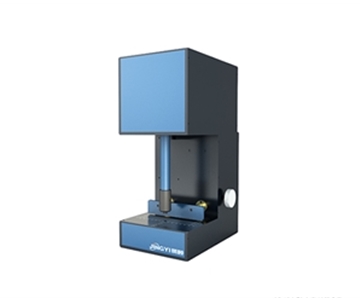
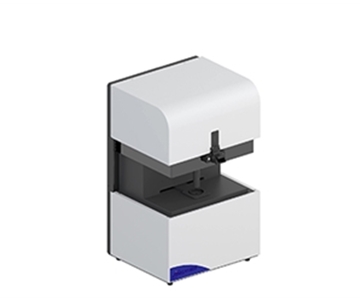
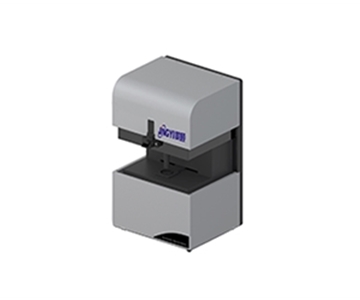
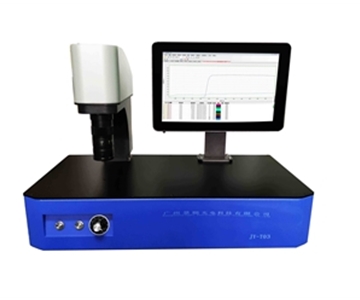
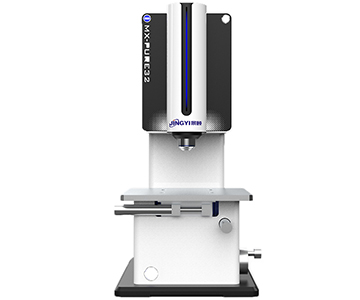
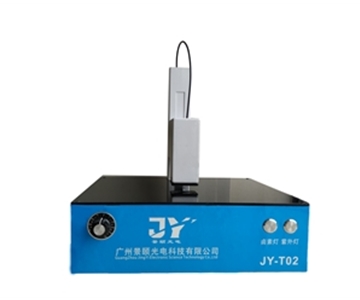
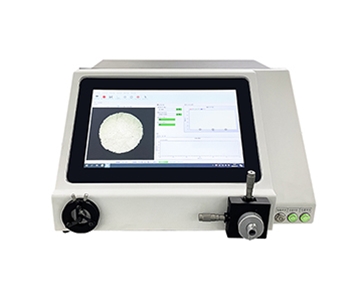
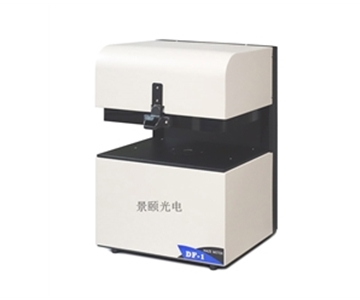
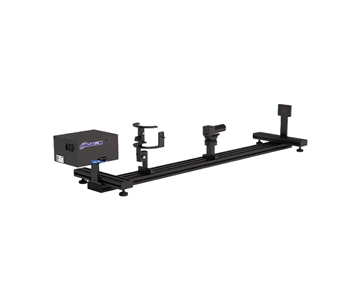
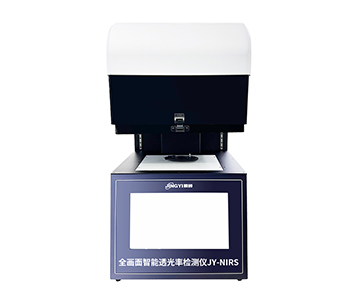
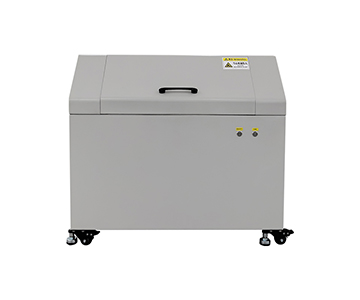
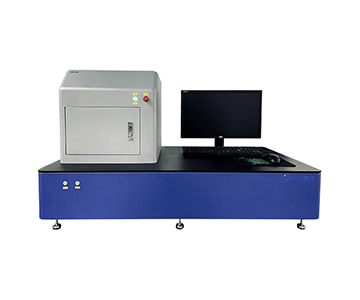
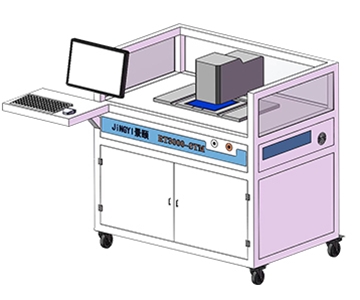
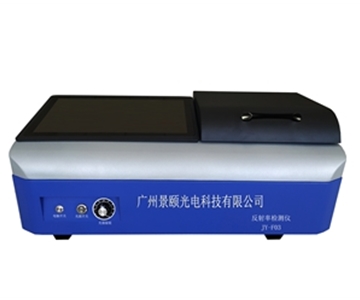
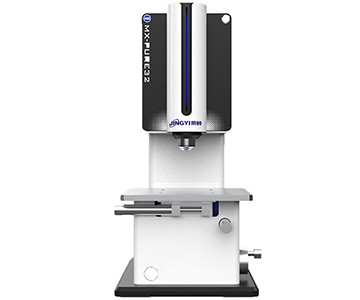
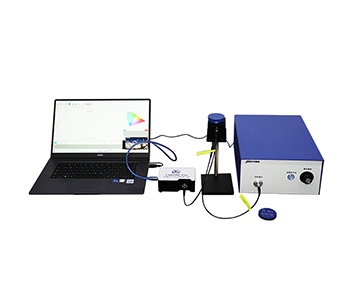
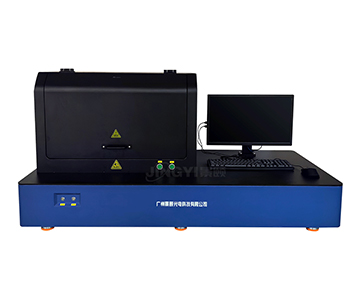
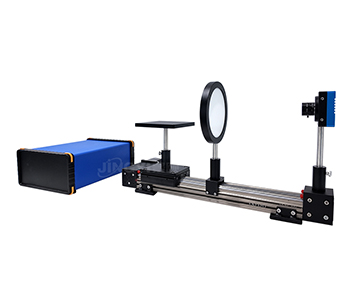
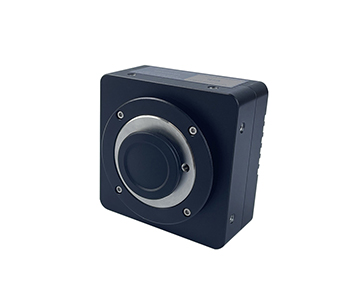
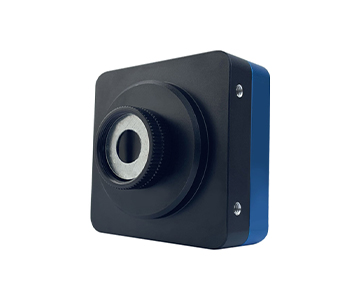
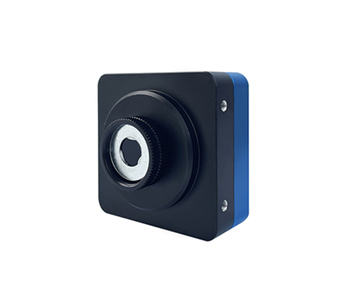
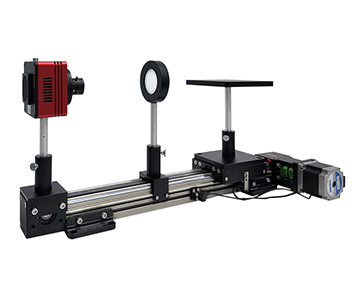
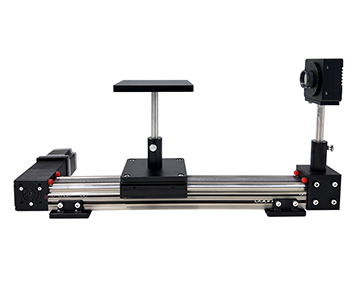
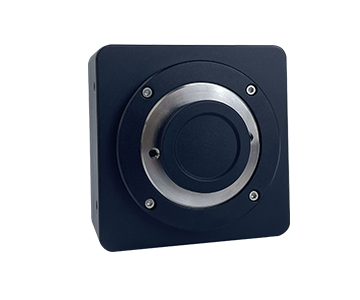
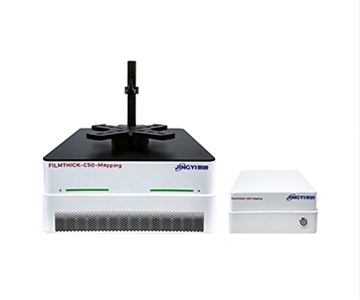
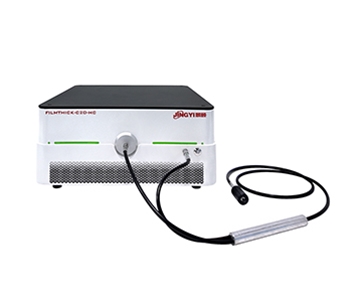
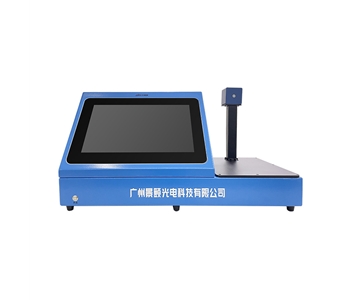
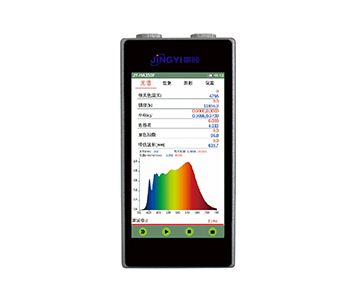
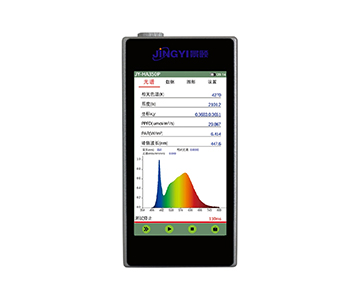
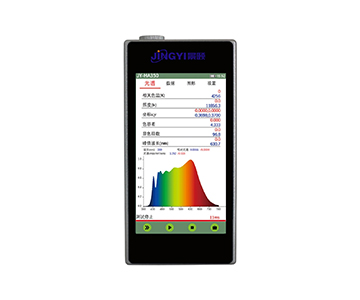
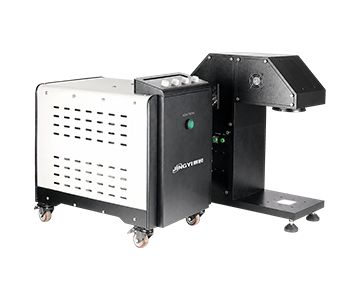
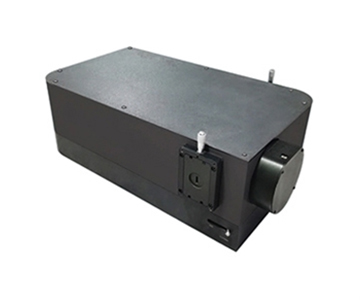
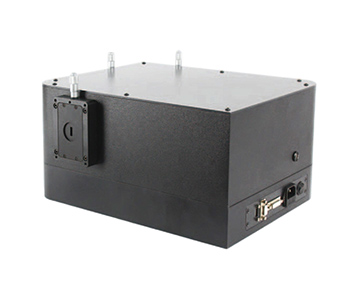
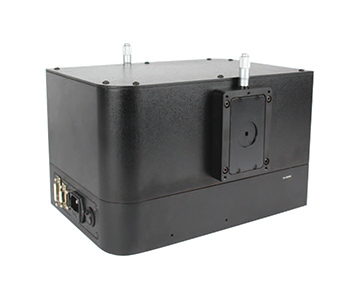
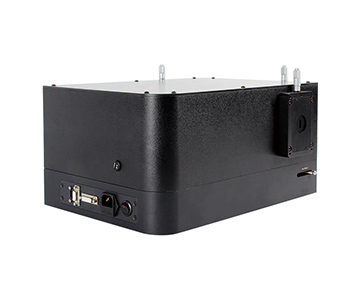
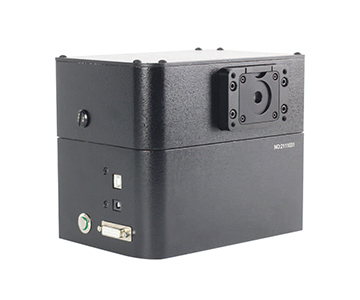
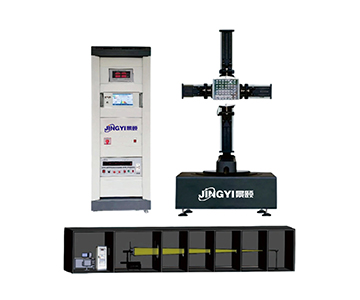
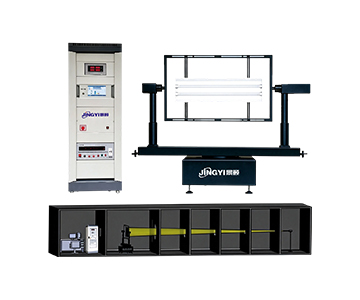
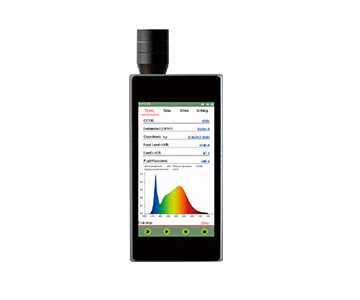
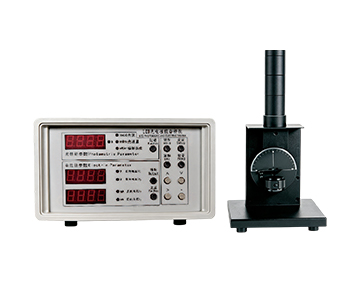
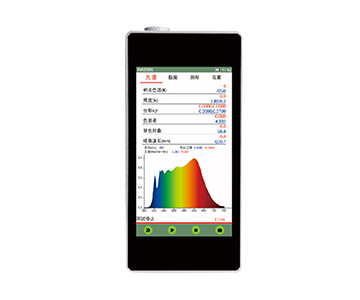
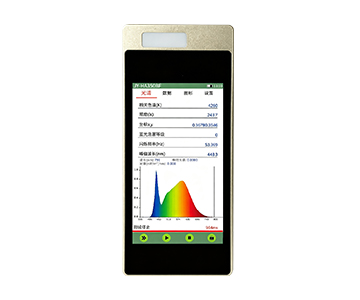
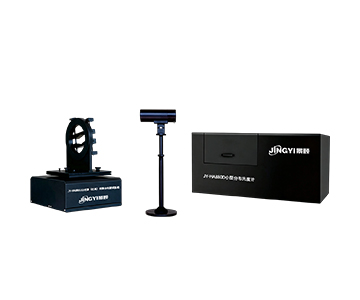
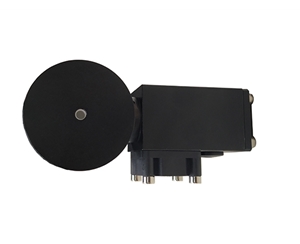
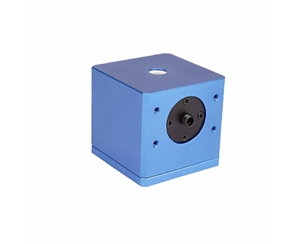
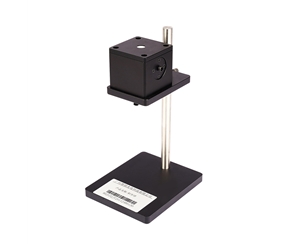
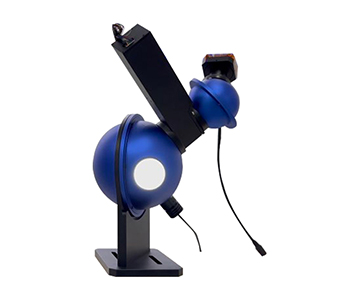
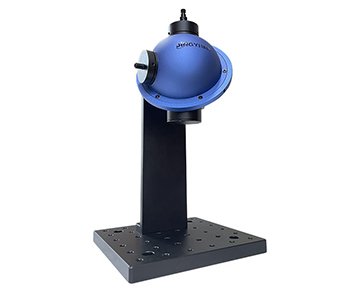
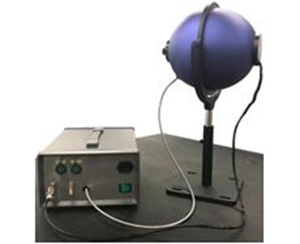
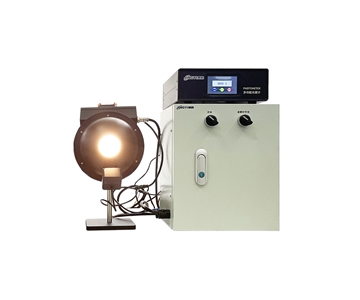
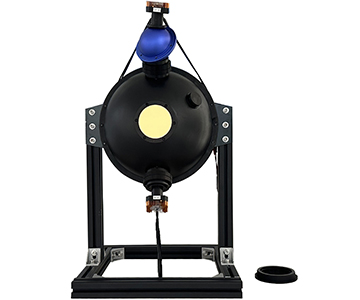
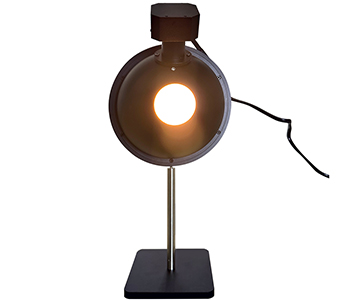
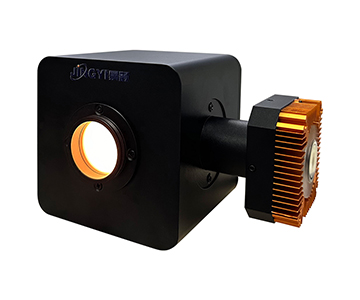
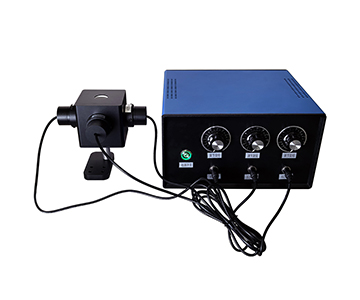
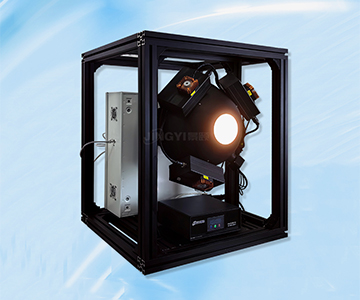
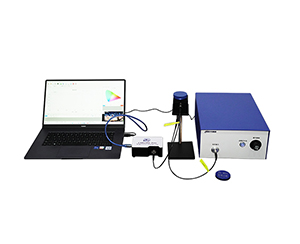
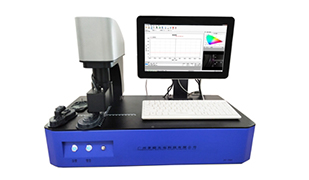
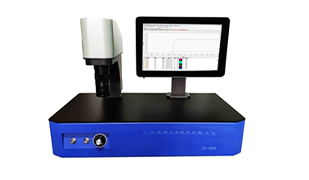
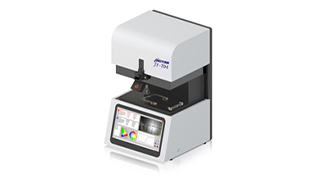
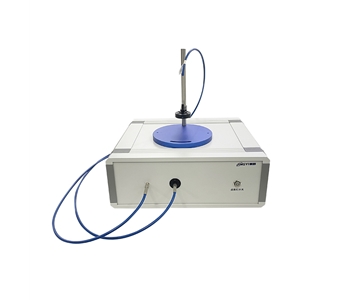
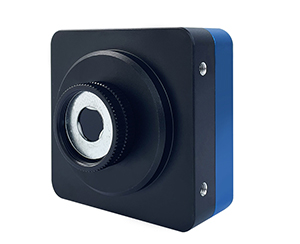
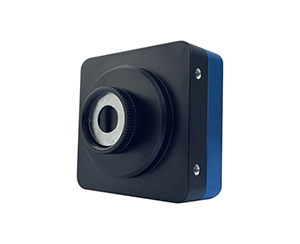
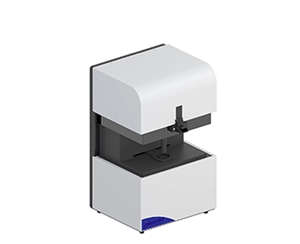
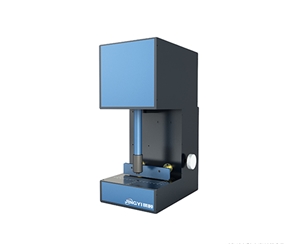
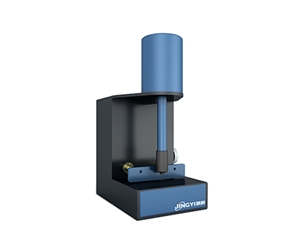
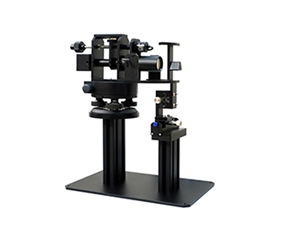
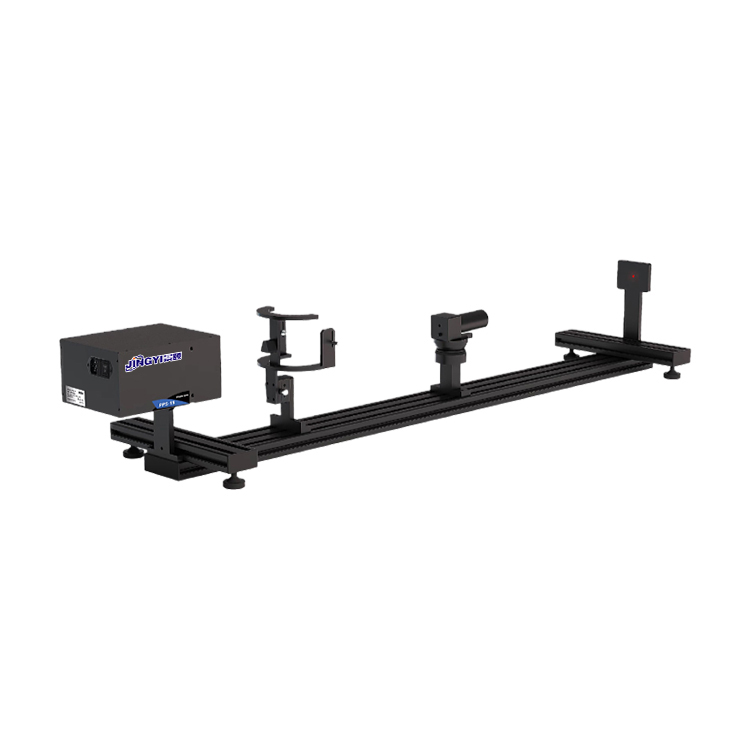
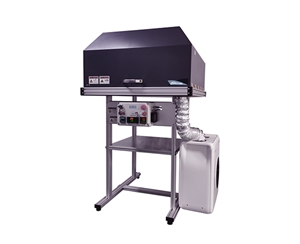
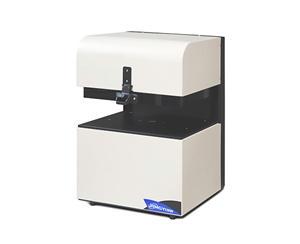
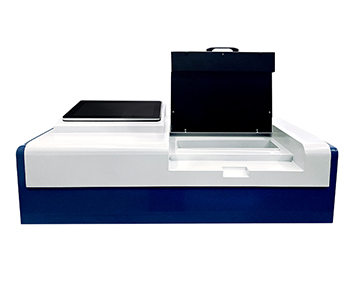
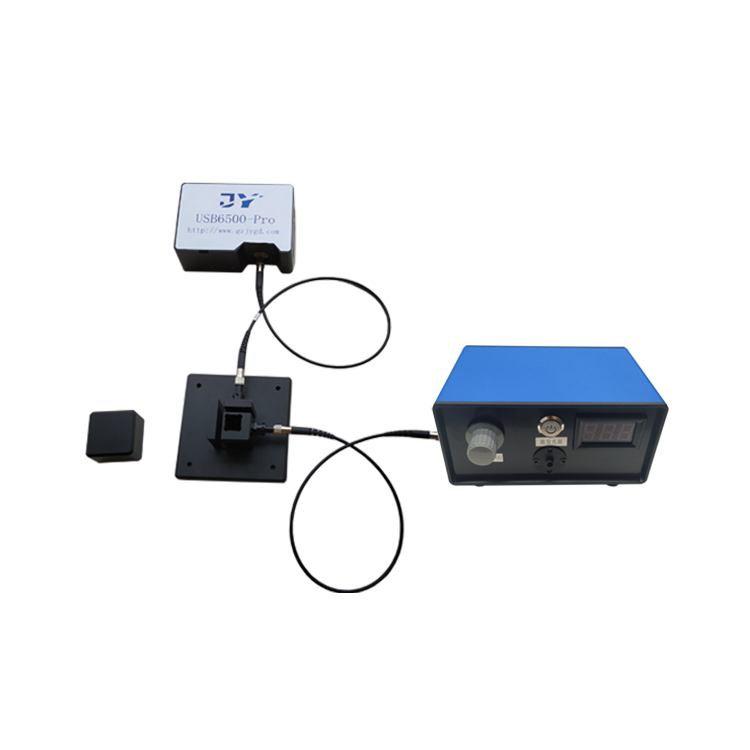
A mainstream optical quantum efficiency tester (base configuration) adopts a modular architecture. Its core spectral module spans 350–1100 nm with a signal‑to‑noise ratio better than 1000:1 and a resolution of 1–2.5 nm. During photoluminescence (PL) spectrum recording, this resolution enables the system to resolve fluorescence peak differences within 2 nm—sufficient for fine spectral analysis of most organic emissive materials.
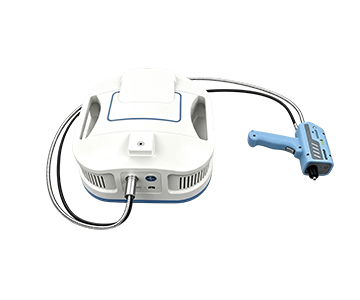
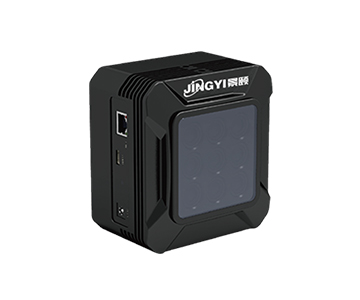
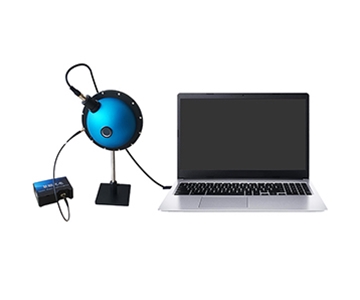
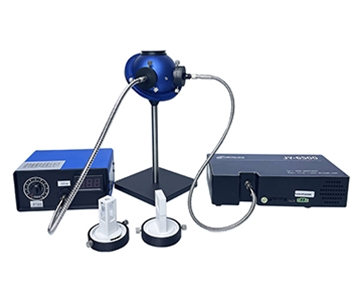
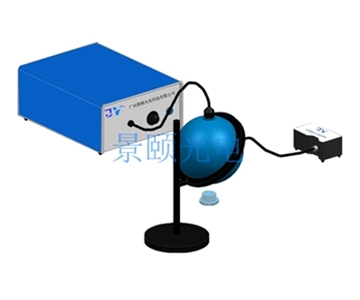
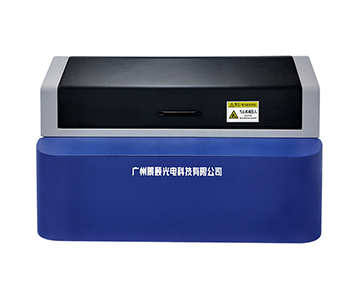
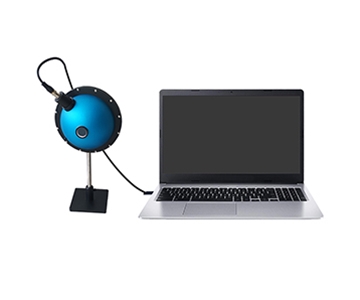
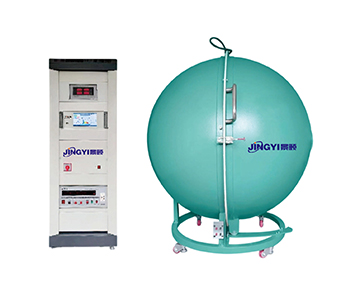
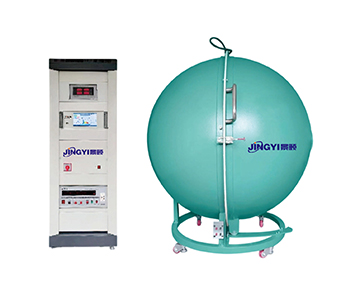
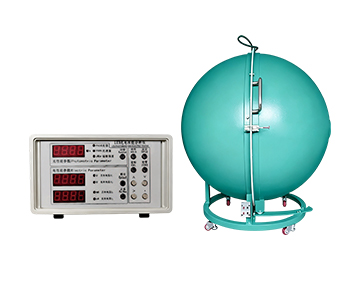
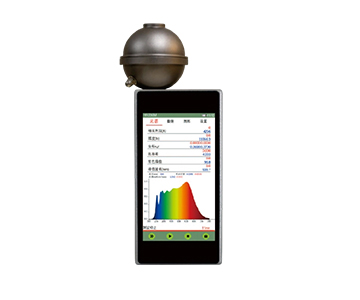
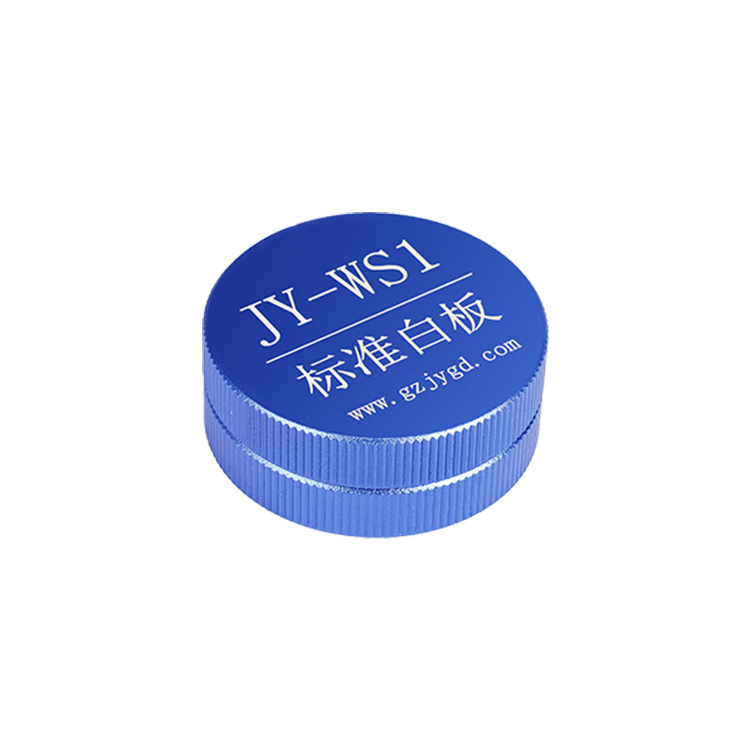
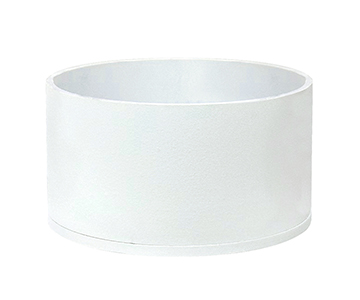
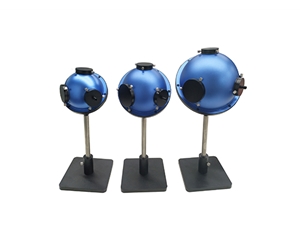
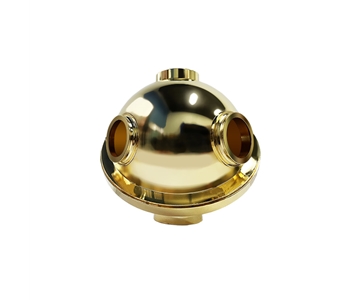
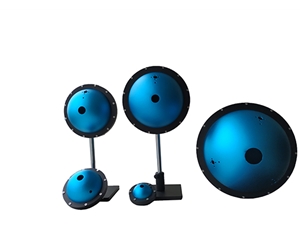
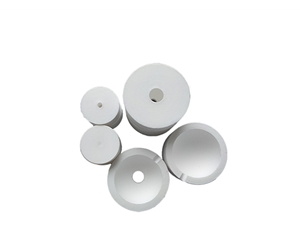
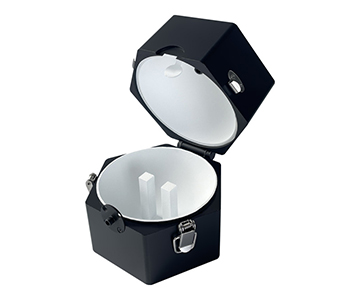
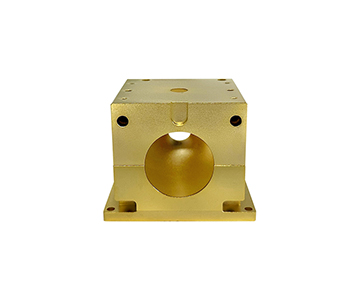
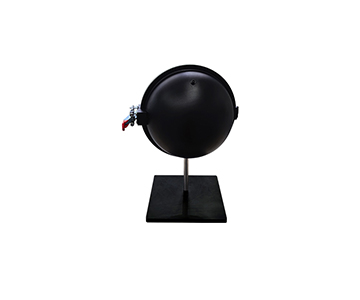
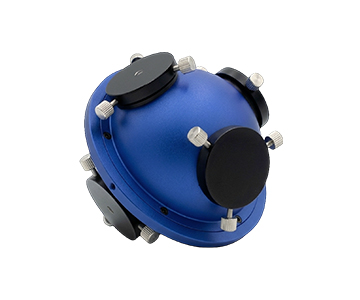
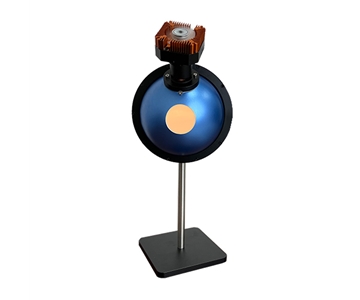
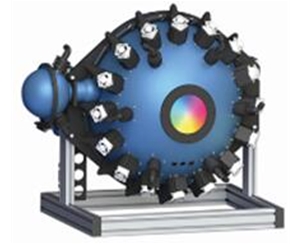
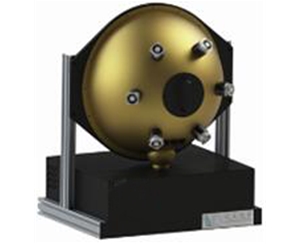
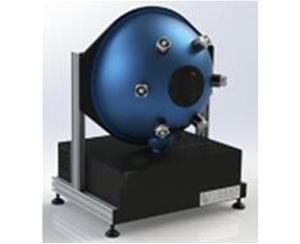
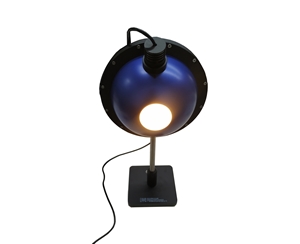
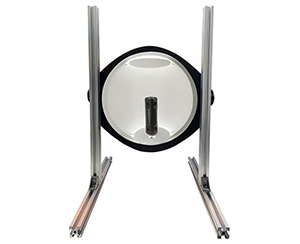
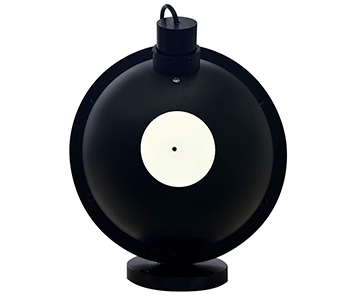
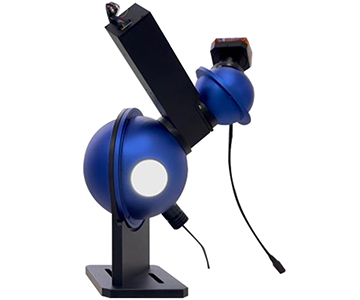
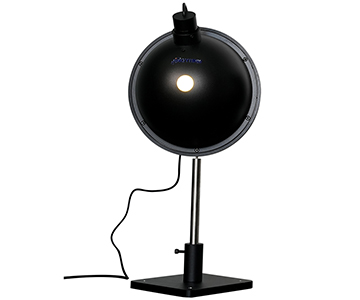
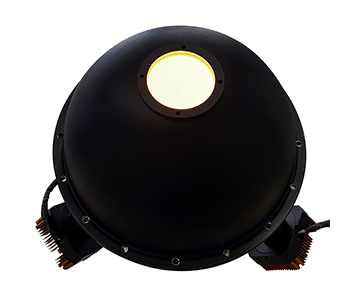
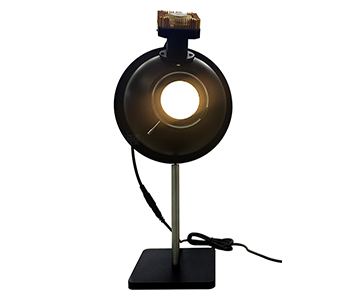
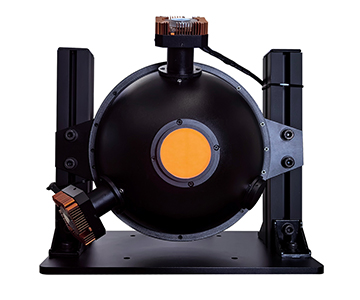
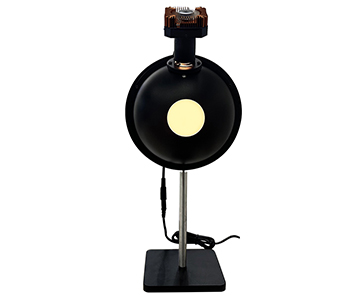
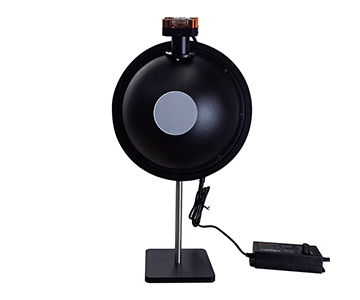
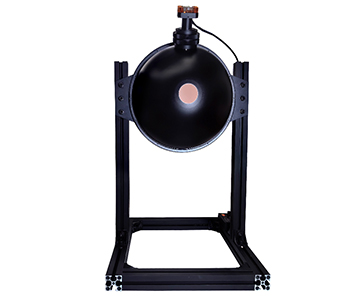
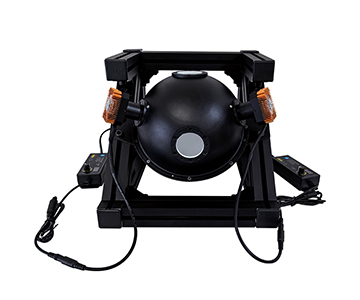
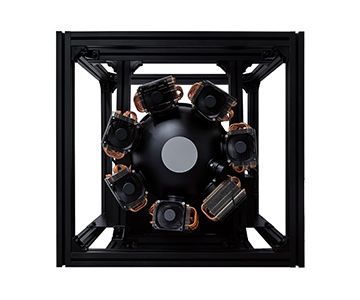
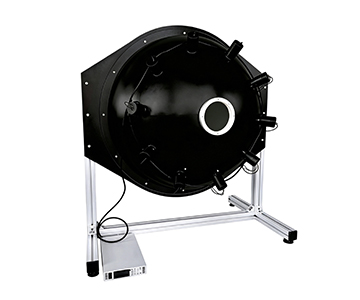
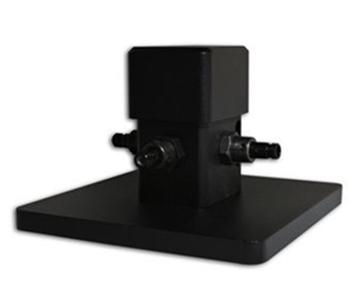
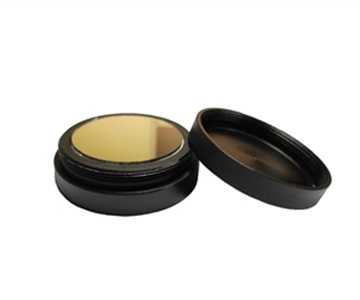
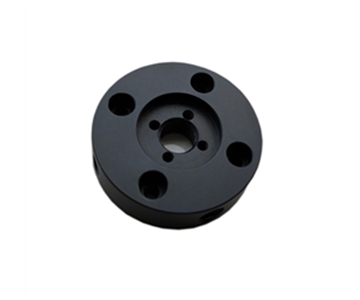
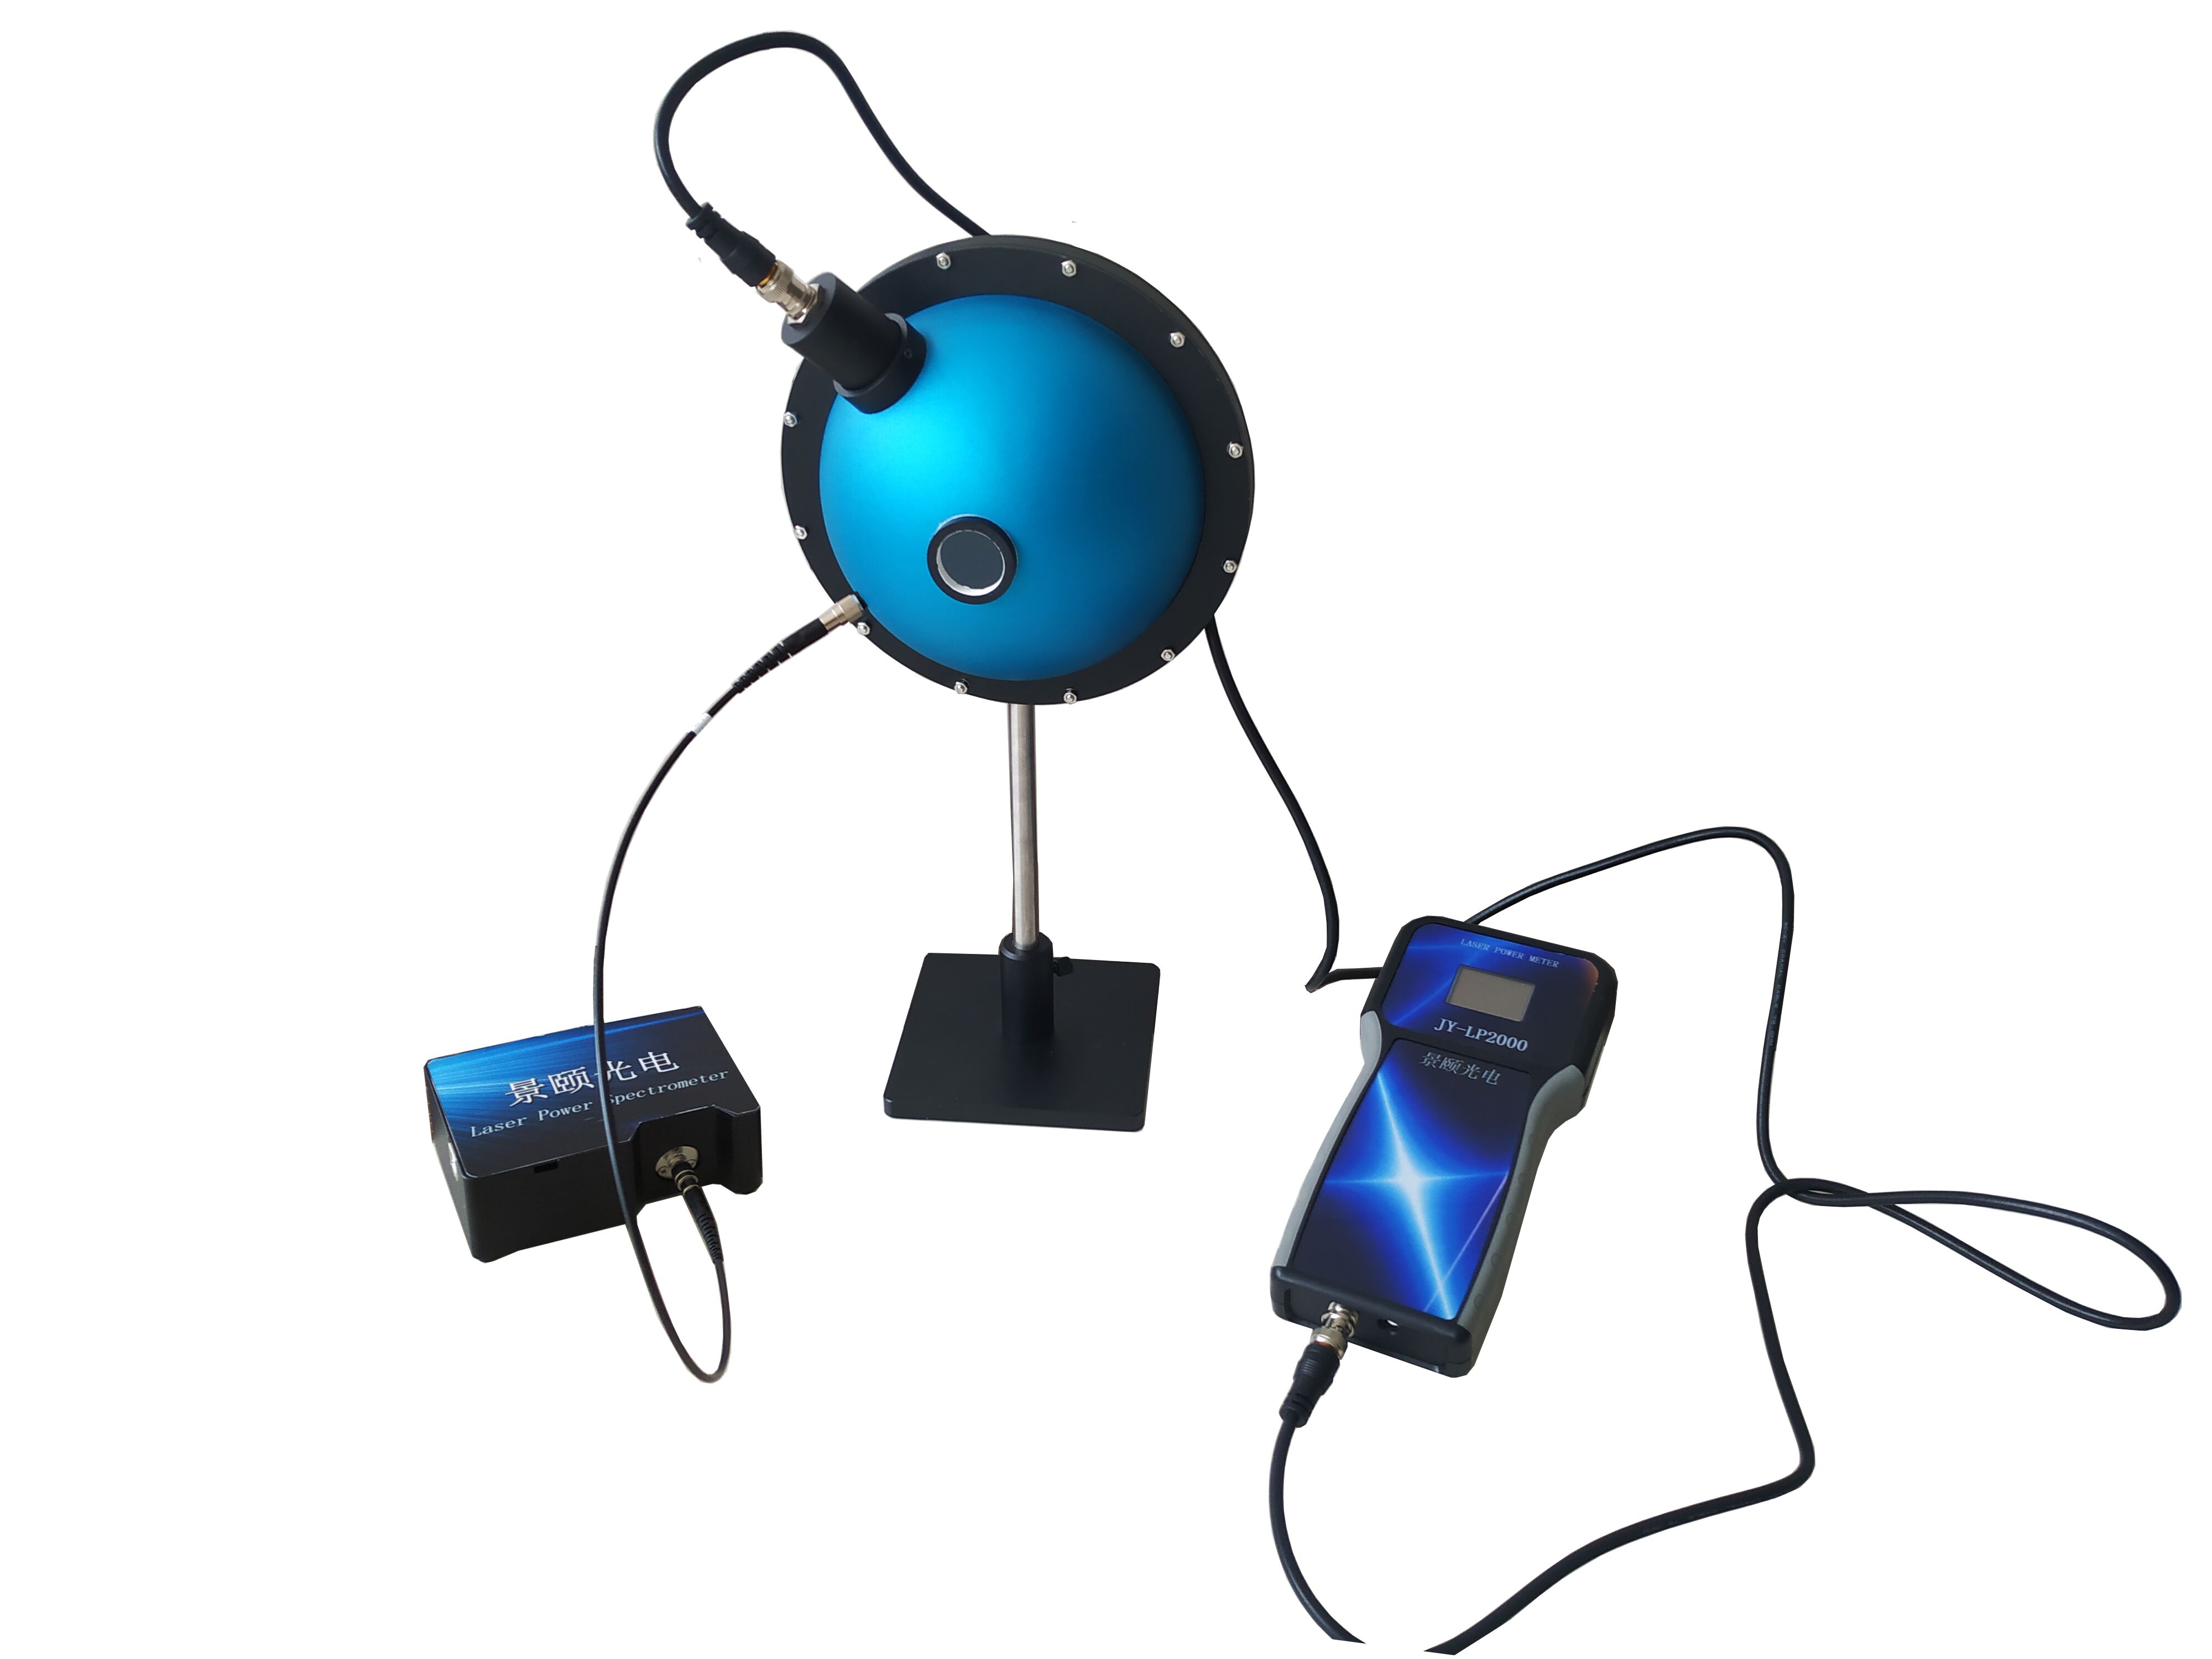
The integrating sphere assembly uses a PTFE coating with a 3.3‑inch diameter and a 1.5‑inch sample port. In absolute quantum yield measurements, PTFE’s high diffuse reflectivity elevates photon collection efficiency while reducing measurement uncertainty introduced by variations in sample scattering direction. The evaluated system supports NIST‑traceable light source calibration, ensuring that calibration data can be directly submitted for certification compliance filings.
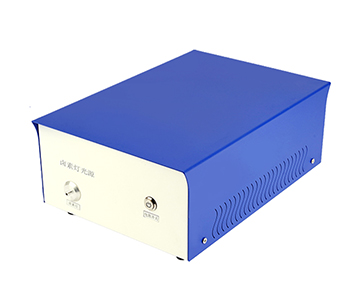
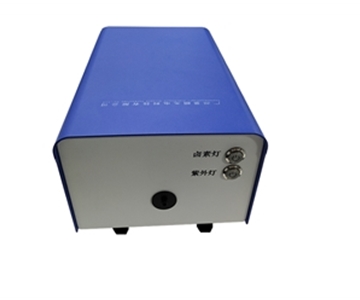
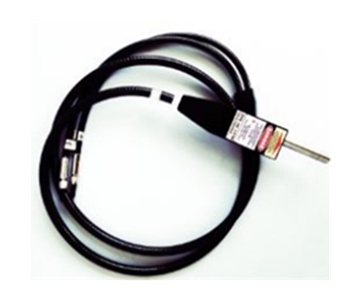
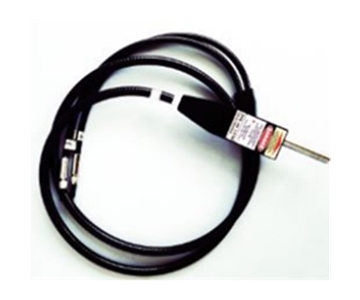
Excitation is delivered via a 365–940 nm fiber‑coupled high‑power LED or laser with continuously adjustable intensity. When testing photosensitive organic‑inorganic hybrid perovskite samples, this adjustable intensity allows researchers to avoid photobleaching while obtaining reliable quantum efficiency data—a critical advantage for stability assessments in new energy materials.
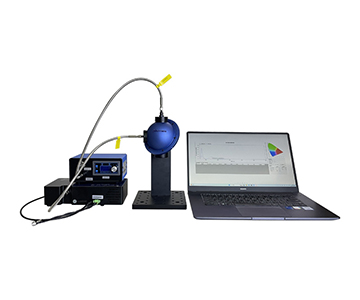
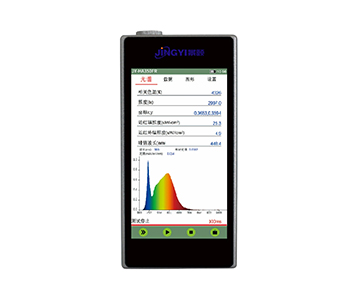
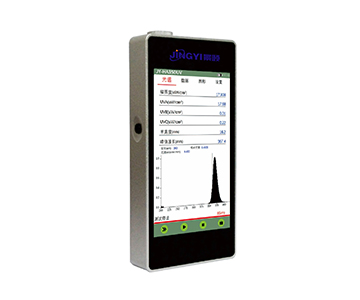
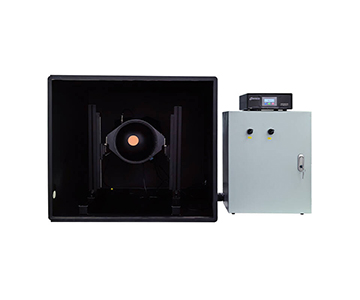
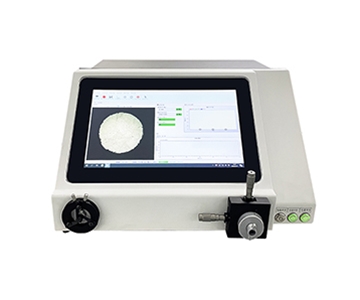
On the software side, a proprietary control interface automates the entire workflow except for light source change and sample loading. Real‑time data monitoring enables the system to auto‑generate quantum efficiency versus excitation power curves within a single scan. Hardware‑backed dynamic range exceeding 100,000:1 ensures simultaneous accurate acquisition of both weak and strong signals.
Quantified Deployment Results: Before and After
An optoelectronic materials laboratory tracked test efficiency and data quality for three months after introducing the described system. Prior to deployment, the lab relied on a traditional monochromator‑based platform.
| Metric |
Before Deployment |
After Deployment |
Improvement |
| Single quantum efficiency test time |
2.3 hours |
0.4 hours |
82.6% reduction |
| Retest deviation |
4.7% |
0.8% |
82.9% reduction |
| Integrating sphere calibration frequency |
Monthly (4 hrs/cycle) |
Every 6 months |
95.6% maintenance hour reduction |
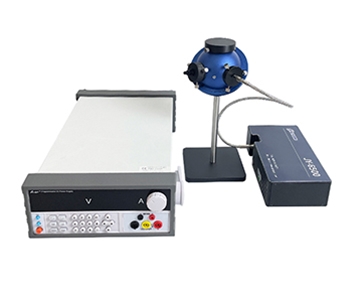
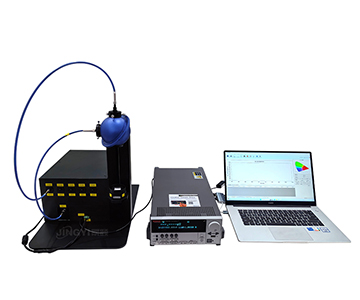
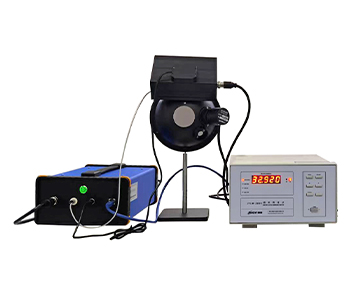
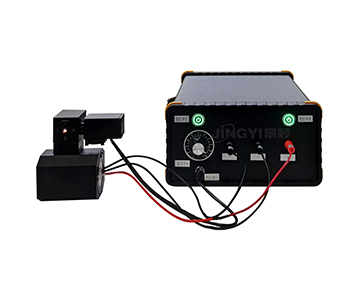
The automation pipeline compressed single‑test labor from 2.3 hours to 0.4 hours. Integrating sphere coating uniformity was held within ±1%, extending calibration intervals to six months. In glovebox electroluminescence (EL) testing scenarios, coupling the system with a source meter for combined electrical‑optical measurement reduced quantum efficiency versus current density curve acquisition from 1.5 hours to 18 minutes, meeting the rapid screening demands of quality inspection production lines.
Validation Methodology
: Testing was conducted on 200 mm silicon wafers and standard fluorescent films at 23°C ±1°C, with n=30 samples per condition. Statistical analysis used two‑tailed t‑tests assuming unequal variance; all reported improvements represent mean differences significant at p<0.05.
Cross‑Industry Transferable Principles
From PL characterization of optical communication devices to EL testing of new energy materials, the technical architecture demonstrates strong cross‑domain adaptability.
Principle 1: Integrating sphere size versus sample brightness matching.
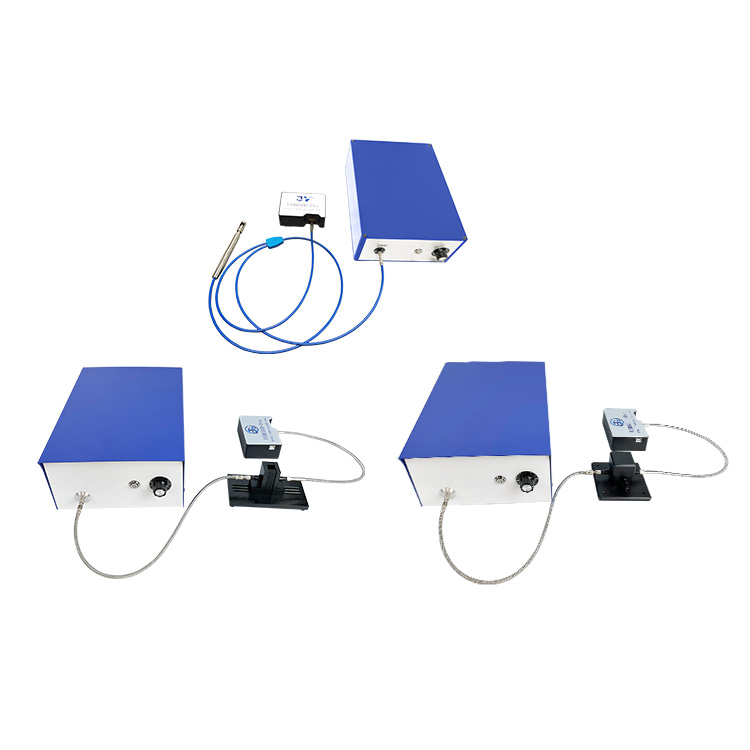
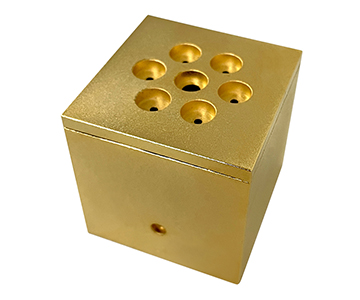
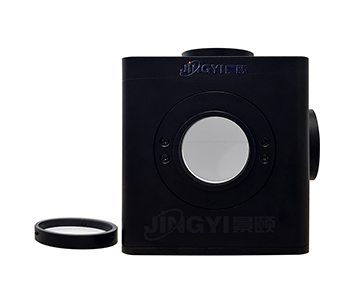
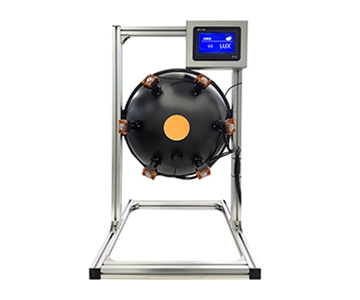
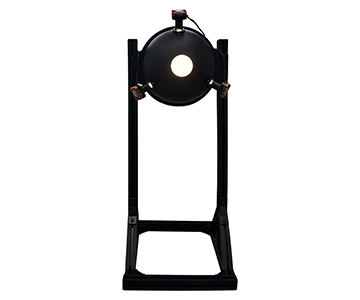
High‑brightness devices pair with a 3.3‑inch large‑aperture integrating sphere to maximize photon collection. Low‑brightness irregular samples benefit from a 1.5‑inch sphere combined with a probe station. This logic has been verified across OLED and perovskite LED cross‑scene tests.
Principle 2: Necessity of NIR spectral extension.
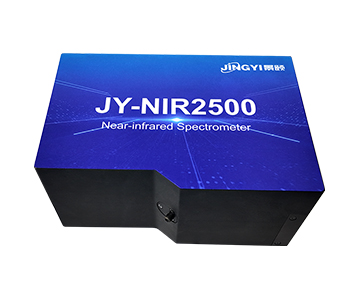
When researching near‑infrared emissive materials, the detection range must extend from the standard 350–1100 nm to 900–1700 nm. An economy‑class infrared‑configured system achieves a 1500:1 signal‑to‑noise ratio in this band, providing an
Principle 3: Data traceability as a compliance prerequisite.
Regardless of whether the application is basic research at a scientific institute or mass‑production quality inspection in consumer electronics, a test system must undergo NIST‑traceable light source calibration and generate a complete calibration certificate chain. This is the foundational requirement for industry‑accepted data.
Objective Limitations and Mitigation Strategies
Despite strong performance in automation and data reliability, the system exhibits specific constraints.
First, the base configuration’s spectral upper limit is 1100 nm. For rare‑earth‑doped materials or quantum dots emitting beyond 1100 nm, an infrared extension module is required, increasing hardware investment by approximately 30%.
Second,
Third, while the excitation source covers 365–940 nm with adjustable intensity, the power density of specific near‑infrared wavelengths (e.g., 740 nm) experiences about 2.3% thermal drift during prolonged continuous operation. For high‑precision measurements, an intermittent trigger mode is recommended to control error.
Frequently Asked Questions
Q1: How should I select the spectral range for a fluorescence quantum efficiency tester?
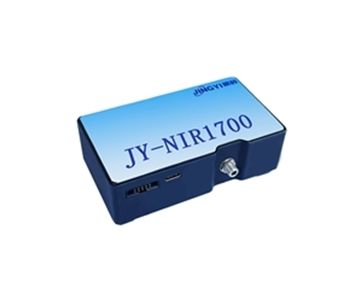
For visible‑light emissive materials such as organic fluorescent dyes, 350–1100 nm covers most needs. When working with near‑infrared materials like rare‑earth upconversion nanoparticles, select a configuration extended to 1700 nm to ensure complete capture of long‑wavelength emission peaks.
Q2: How does integrating sphere coating material affect measurement results?
PTFE coating delivers >99% reflectivity across 350–1100 nm with excellent spectral neutrality, making it suitable for absolute quantum yield measurements. If testing involves ultraviolet wavelengths below 300 nm, verify the coating’s UV stability to prevent reflectivity decay over time.
Q3: What is the difference between electroluminescence and photoluminescence test systems?
Electroluminescence testing requires an additional source meter to provide controllable current excitation and measure quantum efficiency versus current density curves. Photoluminescence relies on an external excitation light source. The two differ in integrating sphere interface and signal synchronization logic; selection depends on the sample’s driving method.
Q4: How can I evaluate a device’s certification compliance capability during procurement?
Confirm that the system has undergone NIST‑traceable light source calibration and check its compliance with relevant standards (e.g., SEMI, ISO). Also review the integrating sphere coating uniformity specification—values better than ±1% enhance data credibility.
Q5: How can I independently verify the quantum efficiency data accuracy of a test system?
Use a standard fluorescent material such as quinine sulfate solution as a reference sample under fixed excitation conditions for cross‑verification. If the measured value deviates beyond the instrument’s stated precision range, contact the equipment supplier for optical path recalibration or integrating sphere coating inspection.
About This Guide
Data Sources
: Product technical documents from Jingyi Optoelectronics (CHT‑QE6500, JY‑QEY6500‑PL, JY‑QEY6500‑PLS, JY‑QEY6500‑EL specification sheets), in‑house validation reports (n=30 samples per condition).
Author
: Cai Xiaodong, Senior Application Engineer, Jingyi Optoelectronics, 8 years in optical detection and spectroscopic analysis.
Disclosure
: Jingyi Optoelectronics manufactures quantum efficiency measurement systems. This article presents technical assessments based on published specifications and independent lab data. No compensation was received from third‑party brands mentioned.
Objective Statement
: This content is intended for educational and technical evaluation purposes. Equipment selection should always include independent proof‑of‑concept validation under your specific process conditions.
Last Updated
: October 2026
For detailed specifications and application notes on fluorescence quantum efficiency testing systems, search "Jingyi Optoelectronics + quantum efficiency measurement system" or visit our technical library.