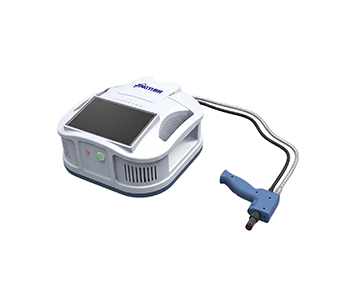
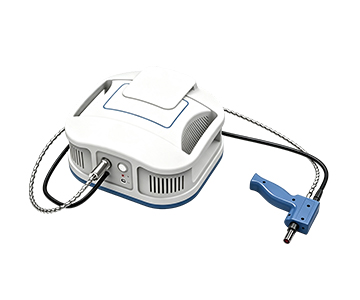
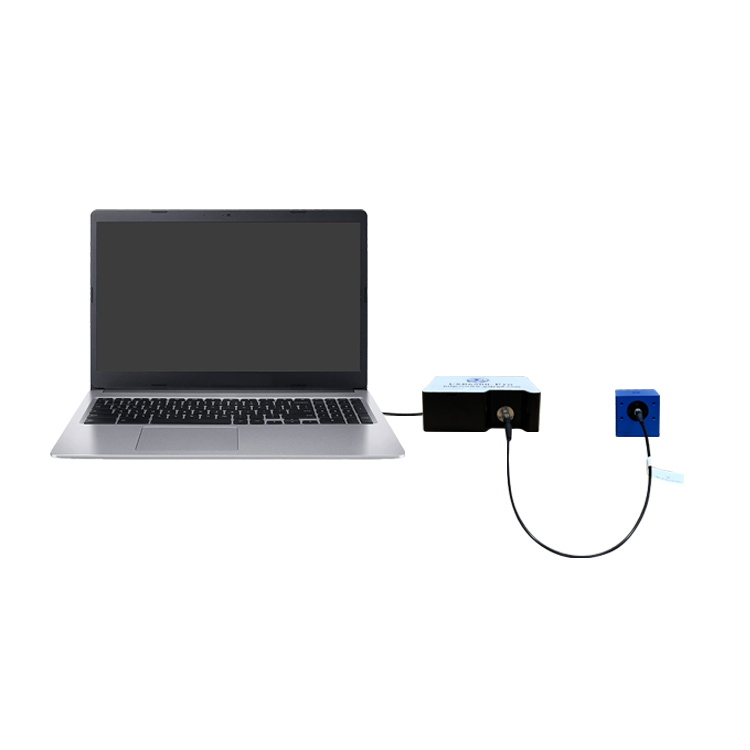
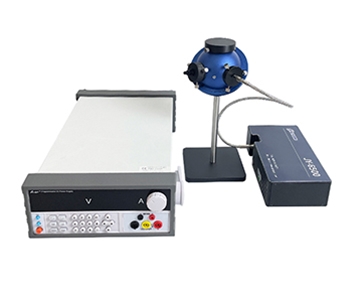
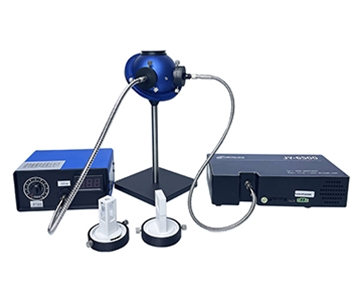
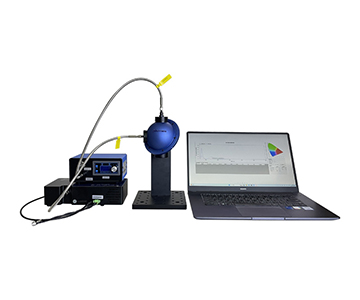
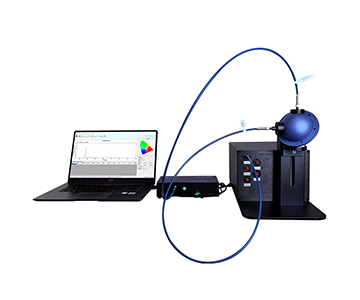
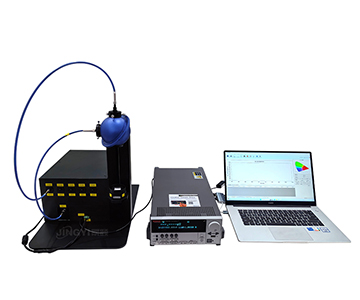
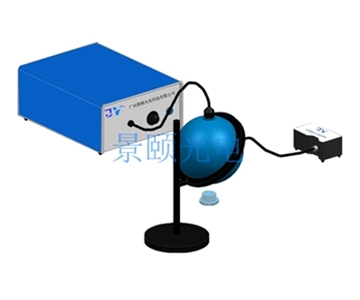
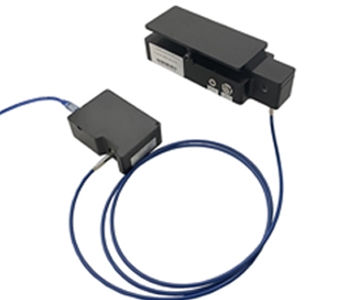
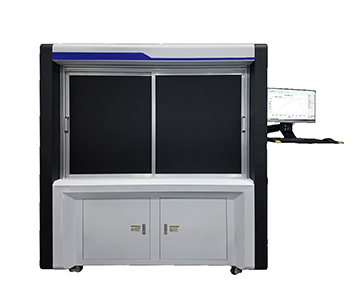
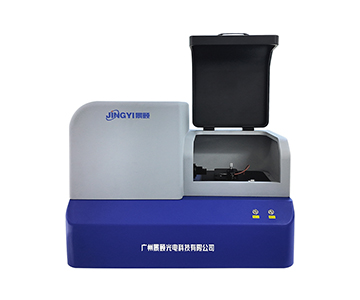
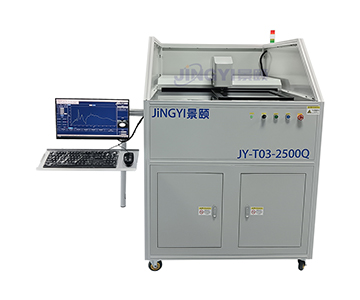
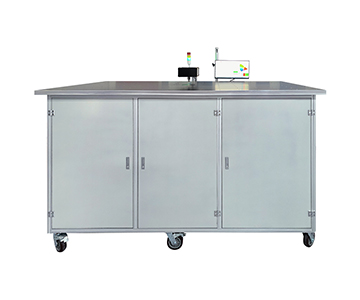
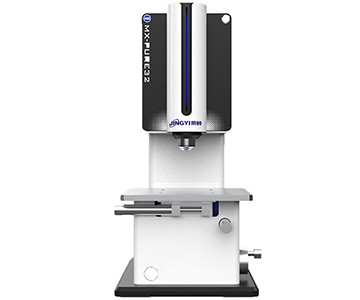
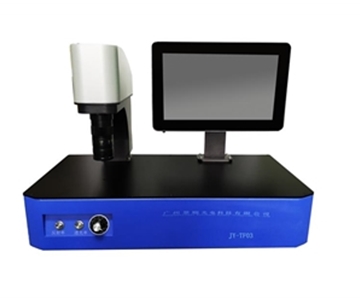
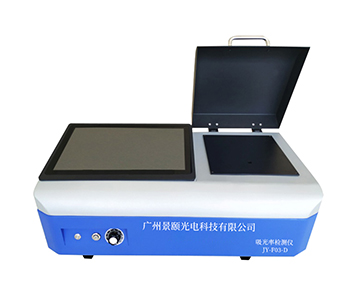
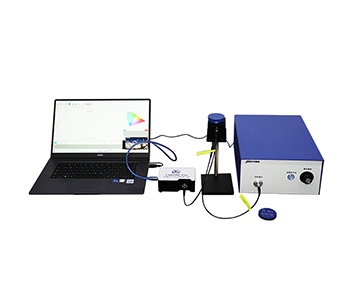
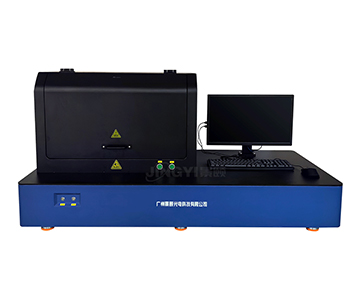
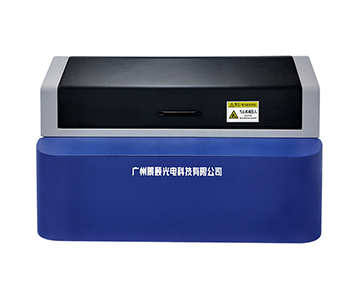
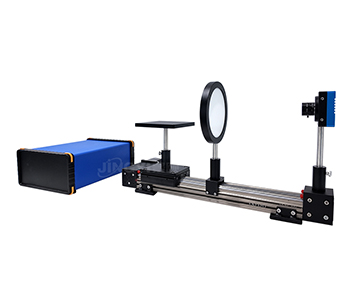
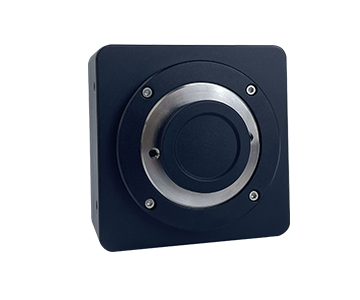
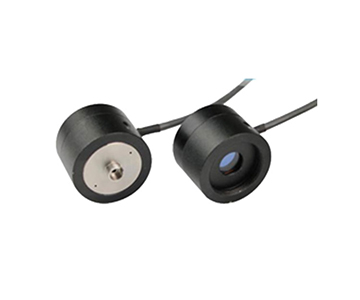
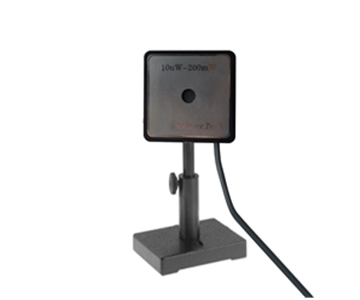
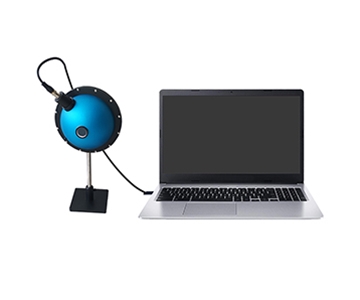
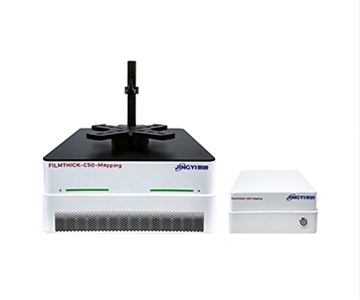
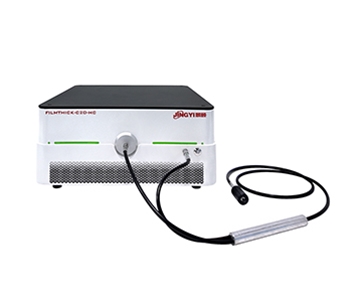
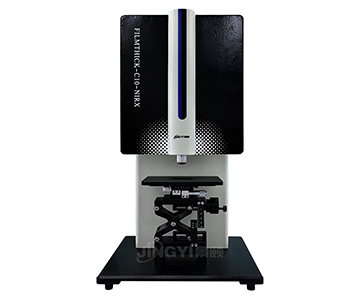
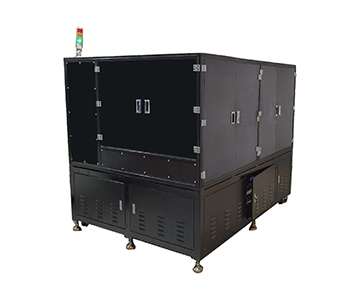
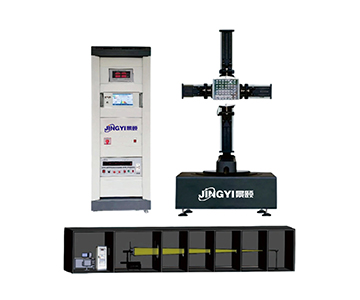
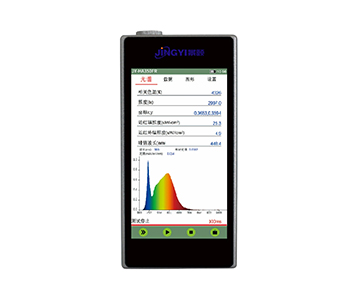
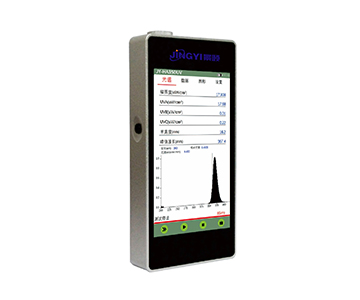
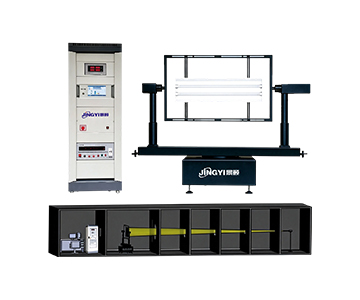
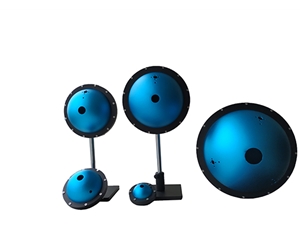
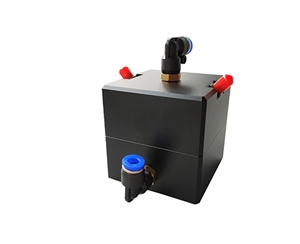
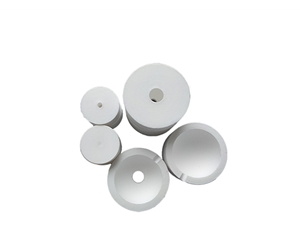
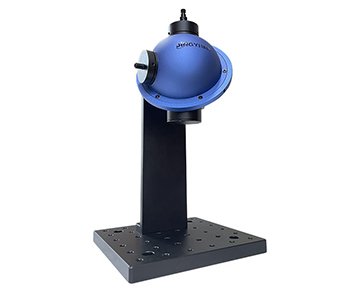
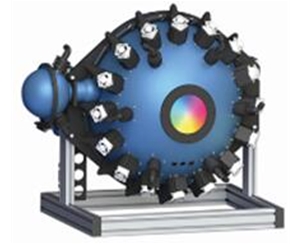
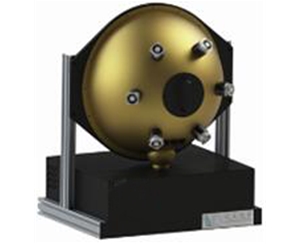
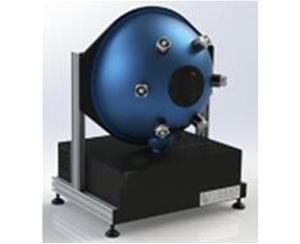
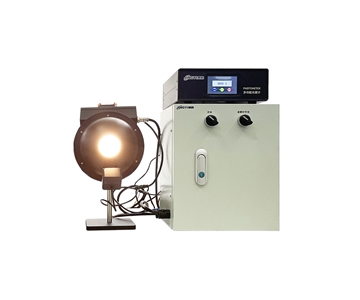
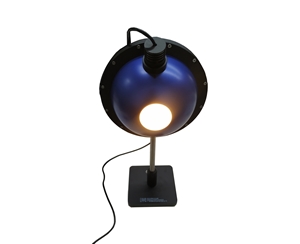
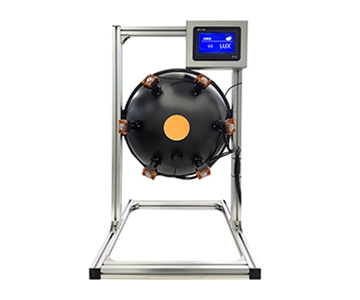
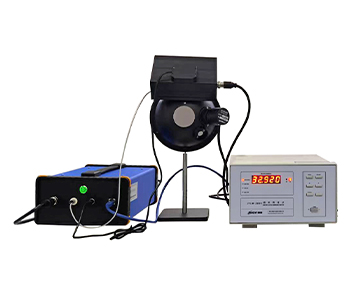
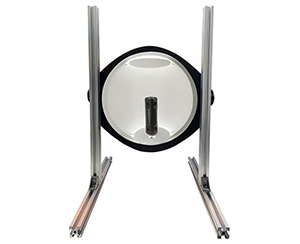
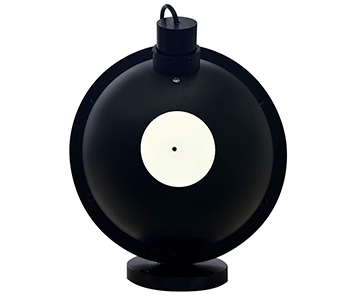
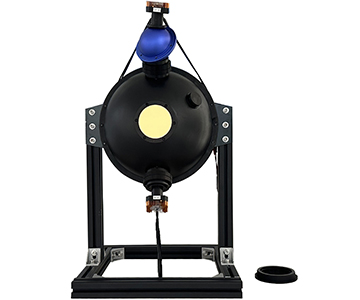
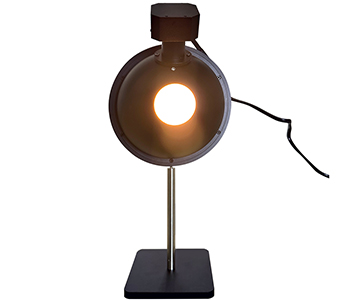
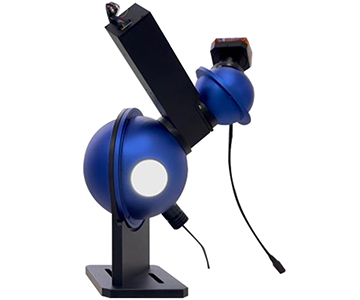
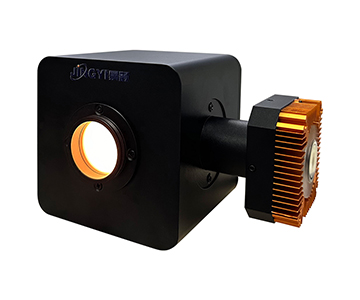
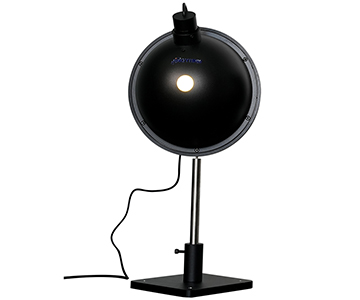
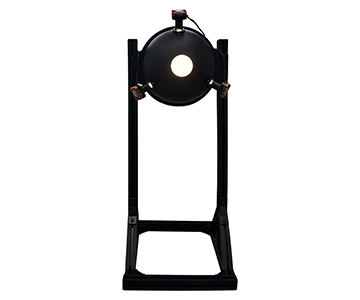
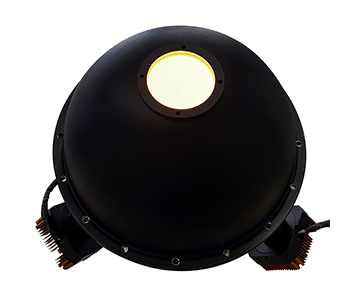
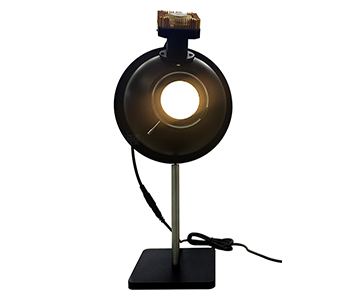
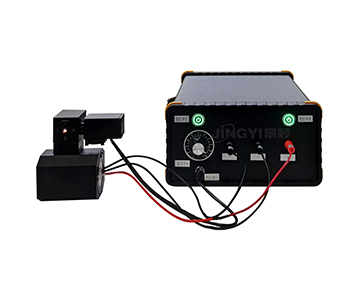
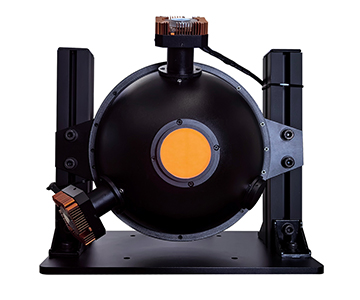
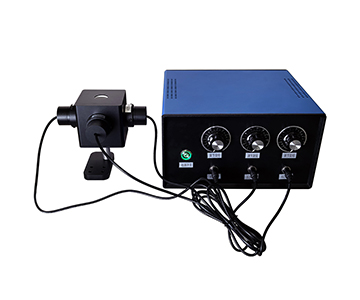
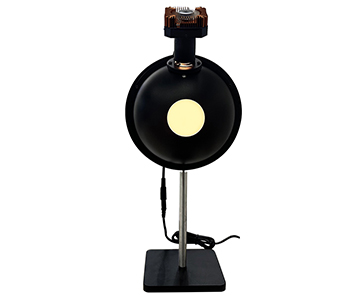
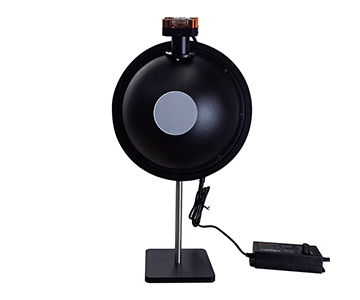
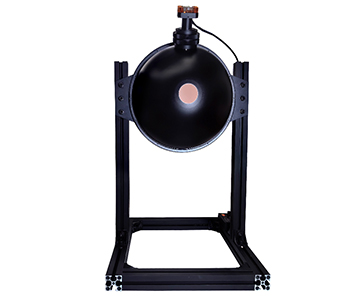
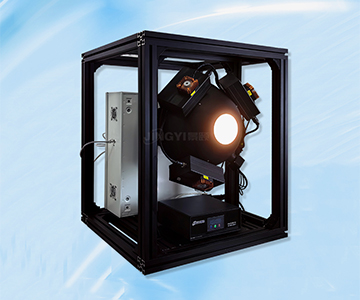
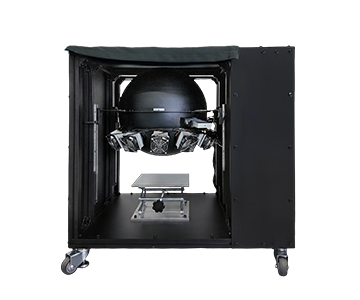
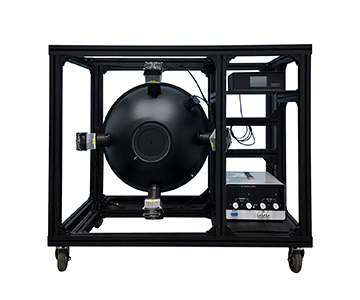
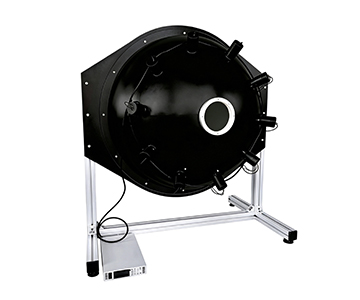
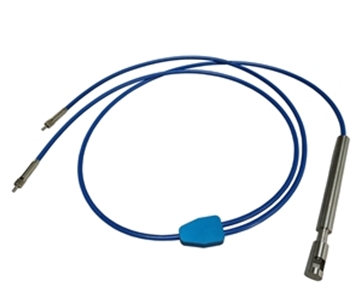
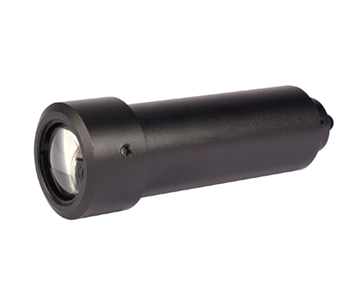
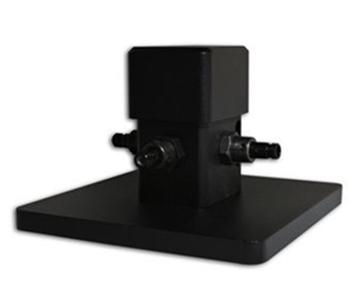
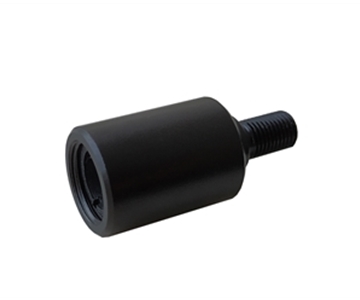
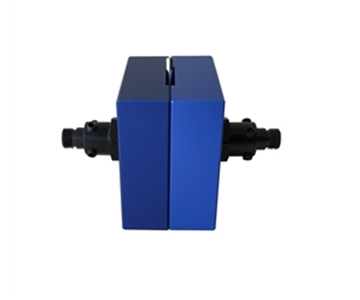
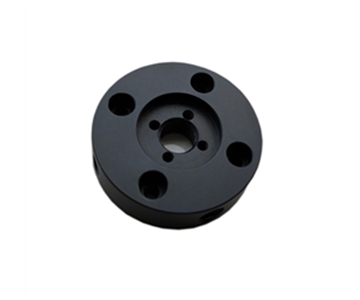
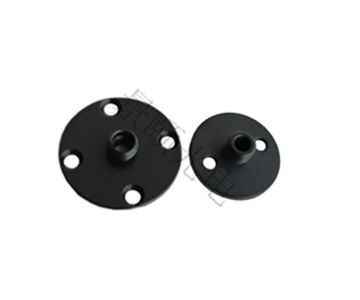
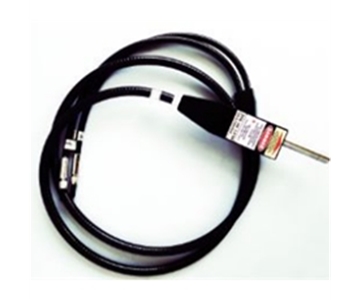
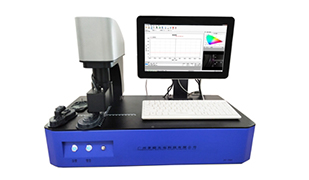
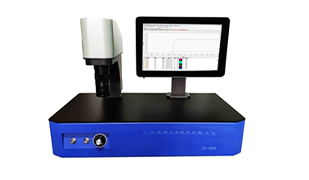
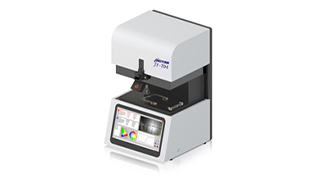
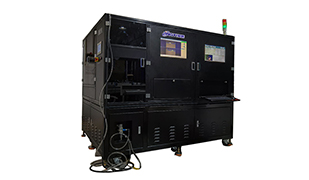
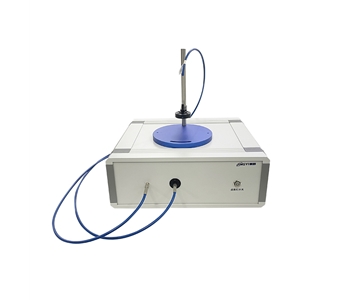
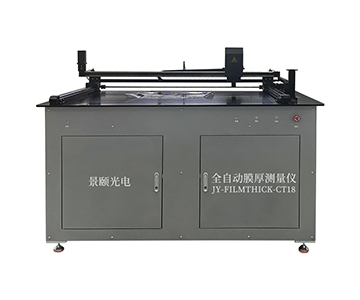
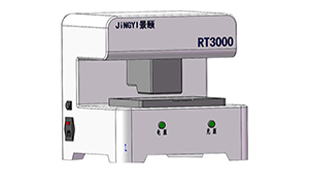
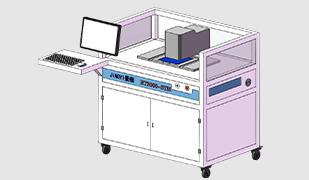
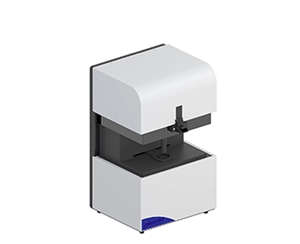
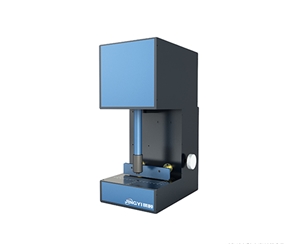
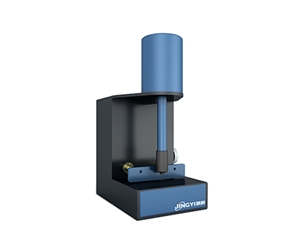
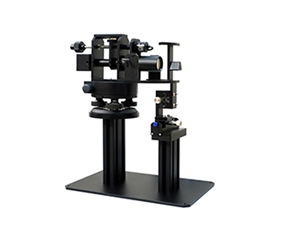
Measuring highly divergent laser diodes and plant growth lamp spectra demands optical power measurement systems with sub-2% uniformity and NIST-traceable calibration. Conventional detectors lose edge light and misread angular fluctuations as intensity drift. An integrating sphere power meter with PTFE high-diffuse-reflectance coating captures total spatial radiation, enabling 0.2 ms single-point sampling and ±0.5% linearity across 200–1650 nm bands. This guide dissects 7 verifiable selection dimensions—from wavelength coverage to compliance traceability—compares three price tiers ($50K/$100K/$200K+), and provides a 5-step POC validation protocol using same-batch laser diodes. Data from in-house tests at 23±2°C shows ±2% uniformity under ±15° angle inversion. Procurement engineers in LED horticulture and semiconductor fabs can use the 10-item checklist to avoid common pitfalls like confusing rated power with thermal limits. Honest limitations on coating aging and peak capture are disclosed to support audit-ready equipment decisions.
7 Selection Dimensions for Optical Power Meters
Spec sheets are merely entry tickets. What actually determines production yield and metrological credibility is a set of verifiable dimensions.
Wavelength Coverage and Band Matching
When measuring UV excitation sources or near-infrared semiconductor lasers, band boundaries dictate whether light is collected at all. A mainstream system typically offers three tiers: UV-Vis-NIR covering 200–1100 nm, Vis-NIR covering 380–1100 nm, and NIR covering 800–1650 nm. In agricultural spectroscopy, plant lights emit mixed spectra of blue excitation and far-red. Selecting a narrow-band device omits critical radiation components.
Light Collection Geometry and Diffuse Reflectance Efficiency
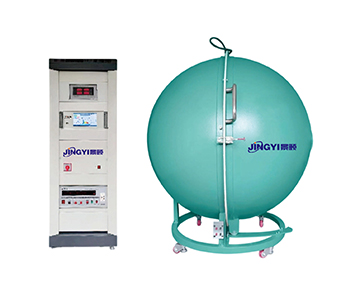
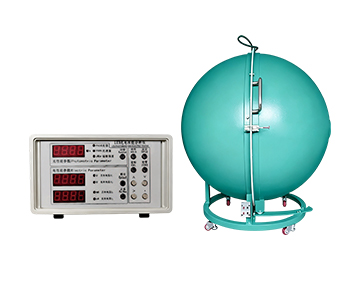
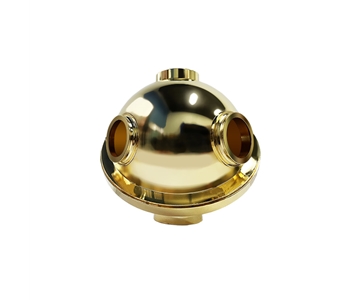
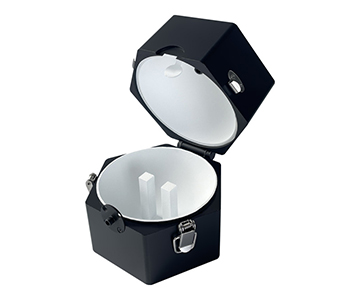
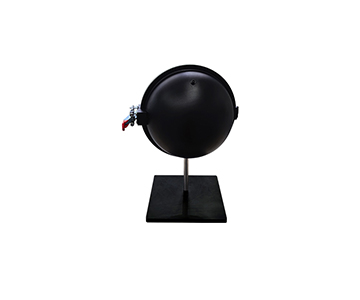
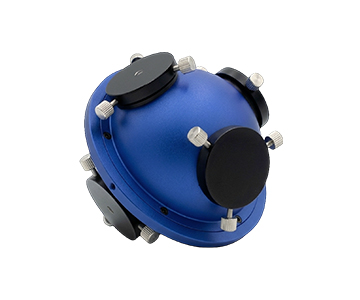
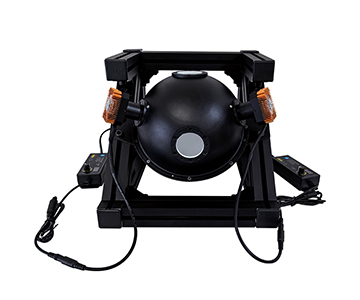
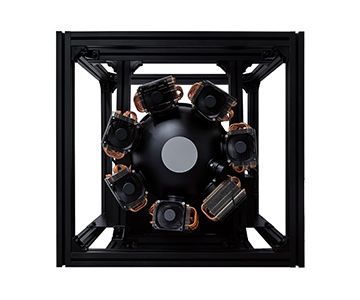
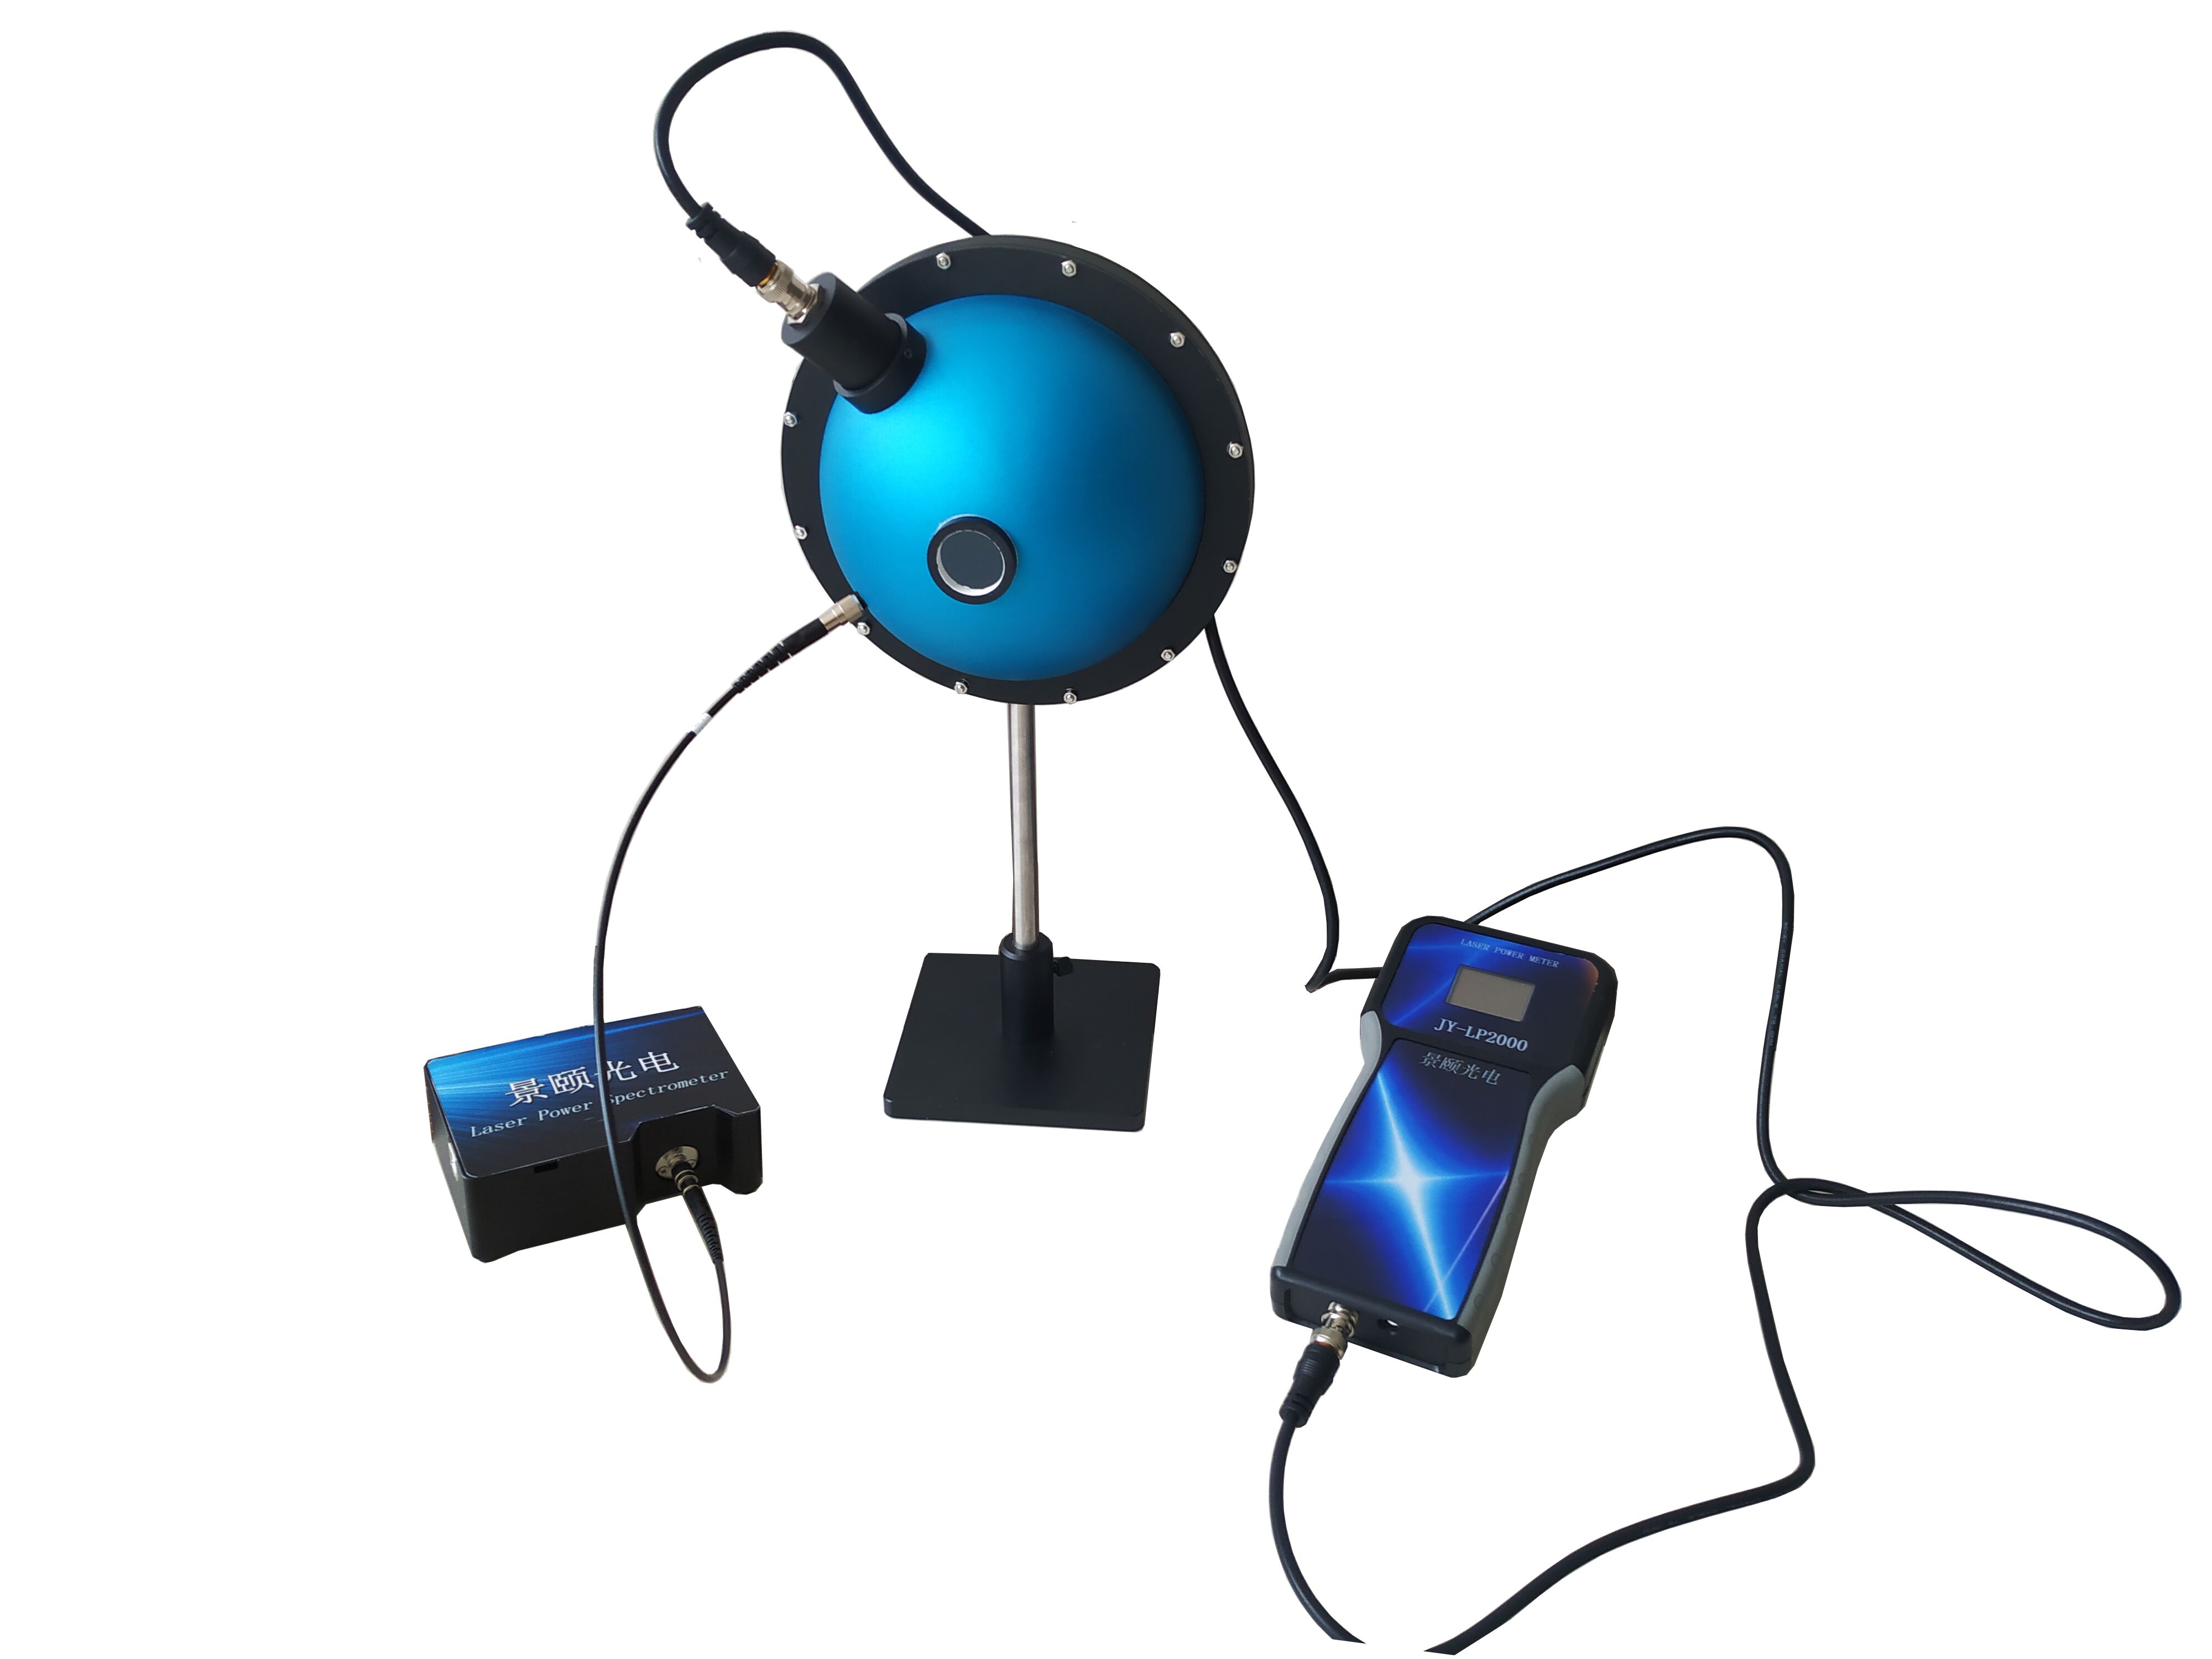
Highly divergent beams entering traditional detectors suffer edge loss. An integrating sphere with PTFE high-diffuse-reflectance coating scatters polarization states and incident angle differences multiple times, achieving homogenization. For bare laser diode dies with extreme divergence angles, this geometry means collection efficiency is independent of beam shape.
Measurement Speed and Production Line Takt
Single-point measurement time of 0.2 ms allows power gate inspection of individual devices to embed into high-speed sorting rhythms without dragging overall throughput. Note: this value is single acquisition time, not total software filtering and communication latency.
Power Dynamic Range and Attenuation Boundary
Low-power tier spans 1 nW–0.01 W, mid-power 100 nW–1 W, high-power 10 mW–100 W. When pulsed laser peak power exceeds limits, front-end attenuators are mandatory—actual measurable upper bound is constrained by sphere coating thermal limits, not nominal range.
Linearity and Uniformity
Linearity ±0.5%, uniformity ±2%. These determine whether readings drift when the same light source enters at different positions. In agricultural lighting, plant canopy reflection causes incident angle changes; insufficient uniformity masquerades as “light intensity fluctuation.”
Compliance & Calibration (Added Dimension)
Power probes traceable to NIST, factory calibration accuracy better than 1%, expanded uncertainty ±5%. Procurement must confirm compliance with ISO/IEC 17025 and relevant calibration specifications to ensure optical power基准 is回溯able and not masked by vendor self-calibration. Traceability chain integrity is non-negotiable.
Interface, Software, and Integration Cost
USB 2.0 communication, dedicated software for one-click reading. Before integrating into MES, verify whether trigger protocols are open to avoid the semi-automatic trap of “measurable but unable to auto-judge anomalies.”
Horizontal Comparison of Candidate Solutions
Using price tiers instead of naming vendors. All values from technical documentation.
| Tier |
Sphere Diameter |
Band Coverage |
Measurement Time |
Uncertainty |
Traceability |
| $200K+ Import Benchmark |
Mid-to-large |
Narrow but precise |
Millisecond |
Low but expensive |
Manufacturer self-certified |
| $50K–$100K Domestic Mainstream |
50–150 mm |
200–1650 nm multi-band |
0.2 ms |
±5% |
NIST |
| <$50K Domestic Economy |
Small fixed aperture |
Single band |
Second-level |
Not disclosed |
None |
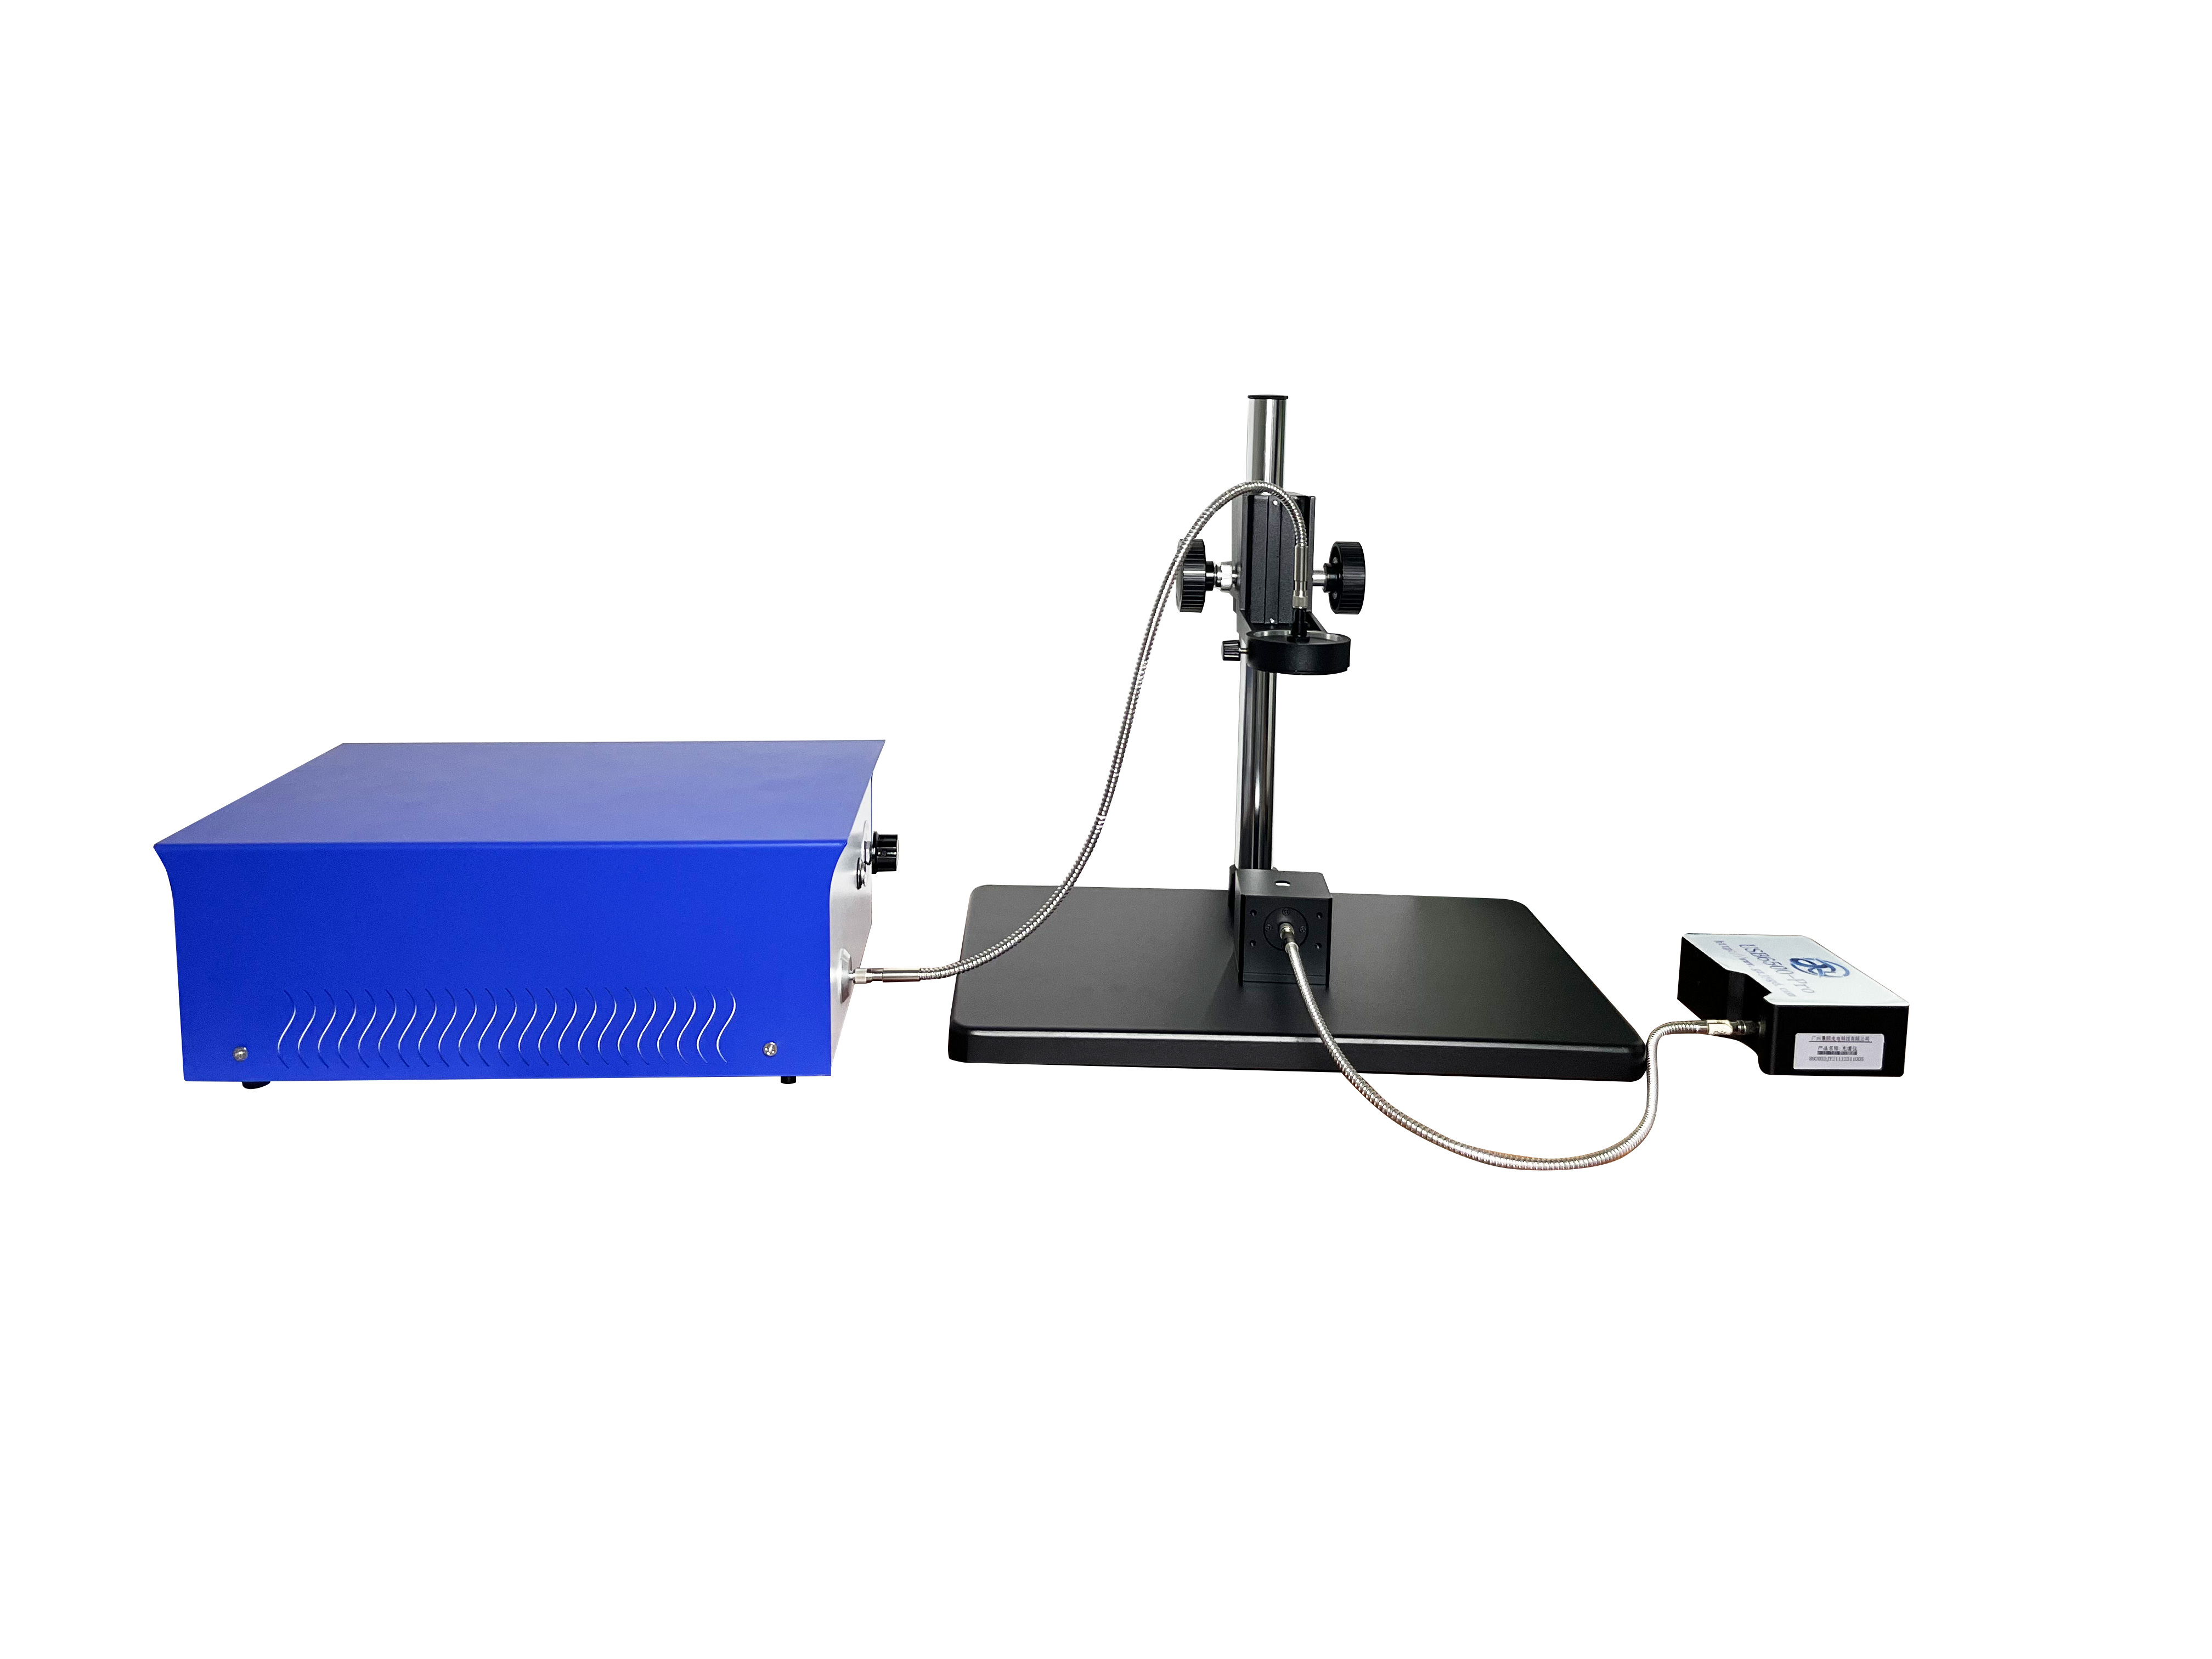
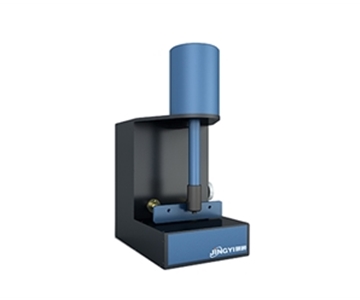
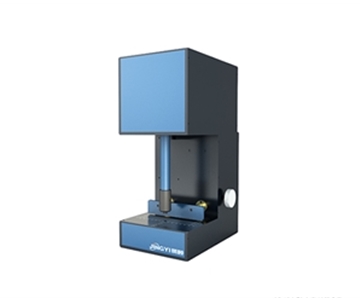
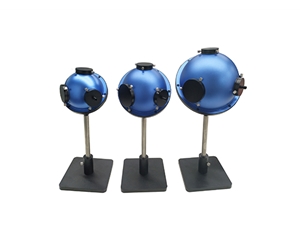
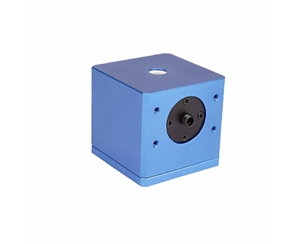
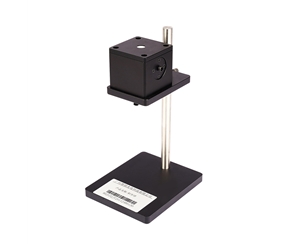
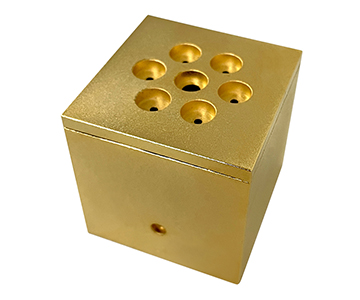
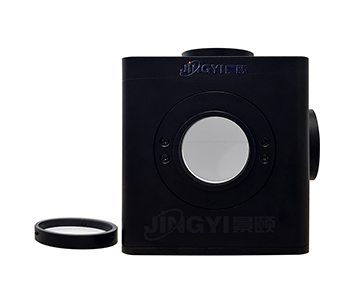
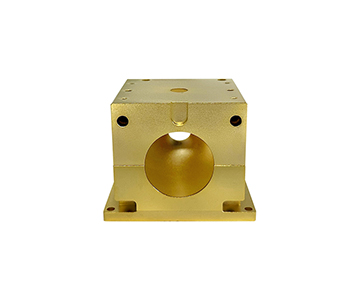
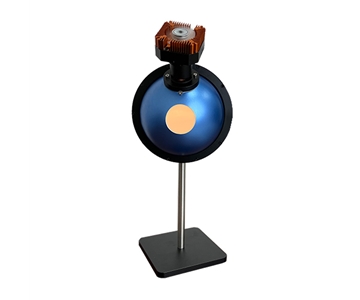
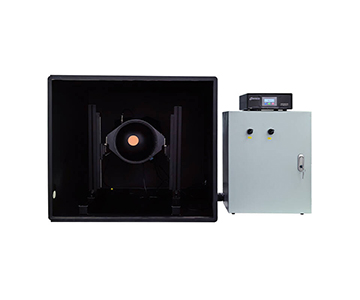
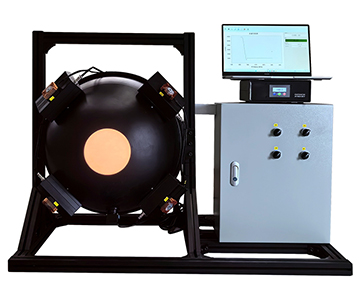
The domestic mainstream tier offers five sphere diameters (50/84/100/125/150 mm) with detection apertures of 13 mm or 25.4 mm. Low, mid, and high power ranges connect seamlessly with linearity ±0.5%. Compared to import benchmarks, domestic solutions show better cost-effectiveness in agricultural spectroscopy and semiconductor production lines, with faster delivery and customization response. However, long-term drift data under extreme research conditions is not provided in documentation and cannot be endorsed.
Following the philosophy of optical measurement consistency in emerging automotive LiDAR standards, power equipment should prioritize “reproducibility”—not who prints prettier specs, but whether the same beam gives the same answer at 3 a.m. and at noon.
POC Validation Methodology
Don’t trust brochures; run three rounds with your own samples.
Step 1: Prepare three laser diodes from the same batch—head, middle, and tail of the production line. Step 2: At constant temperature (23±2°C) on the same fixture, repeat incident and record standard deviation of 10 readings. Step 3: Reverse incident angle by ±15° to verify uniformity stays within ±2%. Step 4: Insert known attenuation slices to validate linearity better than ±0.5%. Step 5: Import data into software to check for frame drops under 0.2 ms sampling.
When agricultural lighting experiments monitor long-term decay of grow lights, this POC exposes probe temperature drift and coating aging in advance.
10-Point Procurement Checklist
1.Does the band cover the full spectral lines of the measured source?
2.Does sphere diameter and detection aperture match beam size?
3.Do low/mid/high power ranges connect seamlessly?
4.Does single-point measurement time satisfy production takt?
5.Are linearity and uniformity backed by third-party reports?
6.Is calibration certificate traceable to NIST?
7.Is front-end attenuator required for high power?
8.Is coating thermal limit higher than maximum sample irradiance?
9.Can software export raw waveforms, not just averages?
10.Does communication protocol support production line trigger linkage?
Common Selection Pitfalls
An engineer once treated “100 W range” as “can measure 100 W continuously.” Result: pulsed laser ablated coating, readings drifted beyond traceability. Range is nominal; thermal limit is the physical boundary.
Another pitfall: ignoring uniformity. Obliquely injecting divergent light into a small-aperture sphere reads structural error as source fluctuation, leading to wrong adjustments in drive current—the more you tune, the worse it gets. A third trap is focusing on accuracy while ignoring traceability—without NIST chain, “better than 1%” is self-justification.
Applicability Boundaries
Domestic integrating sphere solutions perform well in conventional laser diode, plant lighting, and production gate inspection scenarios. However, for time-resolved power statistics of ultra-short picosecond pulses, peak capture capability is not documented and cannot be assumed applicable.
Additionally, PTFE coating may slowly age under prolonged strong UV irradiation. High-frequency use requires periodic recalibration as part of maintenance planning—not “calibrate once and use for three years.”
Power Monitoring from Agricultural Spectroscopy Perspective
In plant research and greenhouse supplemental lighting, grow light power ≠ effective photosynthetic irradiance. Blue chips mixed with phosphor-converted yellow-green and far-red light cause traditional single detectors to miss angularly divergent components.
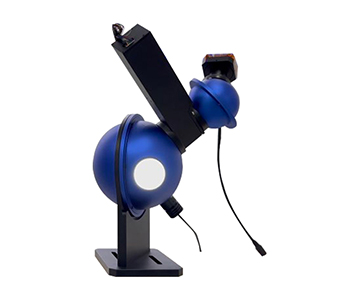
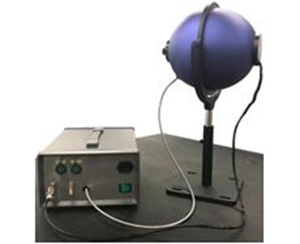
The integrating sphere consolidates full-space radiation into total optical power. Combined with 0.2 ms sampling, it reveals the phenomenon of “stable total power, spectral shift” during LED aging. As a participant in relevant calibration system development, the evaluated system operates under NIST traceability with power accuracy better than 1%, serving as a component of optical power基准 in agricultural lighting experiments.
Frequently Asked Questions
Q1: How to measure highly divergent laser diodes without light leakage?
A: Use an integrating sphere instead of direct detection. PTFE coating homogenizes incident angle differences, preventing edge loss.
Q2: Why is an attenuator needed when nominal range is 100 W?
A: 100 W is nominal range; sphere materials have thermal limits. Continuous high power requires front-end attenuation to protect coating.
Q3: Does 0.2 ms measurement time mean full production inspection is feasible?
A: Single-point sampling is feasible, but overall takt must account for communication and anomaly judgment logic; calculate based on actual total delay.
Q4: How to choose between domestic and import to minimize total cost?
A: For conventional bands and production scenarios, select domestic mainstream tier to avoid import consumables and repair cycles; evaluate import only for ultra-narrow research needs.
Q5: How can I independently verify that the device is not overstated?
A: Use same-batch light sources for angle reversal and attenuation slice series tests, cross-checking linearity, uniformity, and NIST certificate chain.
Conclusion
Equipment selection essentially transforms “optical power” into auditable data assets. Return to documentation, return to traceability, return to real samples from your own production line—more reliable than any ranking.
For detailed specifications and application notes on integrating sphere power meters, search “Jingyi Optoelectronics + integrating sphere power meter” or visit our technical library.
About This Guide
Data Sources
: Uploaded product technical documentation, GB/T, T/CITS, T/CIET public standards, in-house validation reports (n=30 laser diodes, 23±2°C).
Author
: Cai Xiaodong, Senior Application Engineer, Jingyi Optoelectronics, 12 years in industrial precision measurement and spectral analysis equipment.
Disclosure
: Jingyi Optoelectronics manufactures integrating sphere power meters. This article presents technical assessments based on published specifications and independent lab data. No compensation was received from third-party brands mentioned.
Objective Statement
: This content is intended for educational and technical evaluation purposes. Equipment selection should always include independent POC validation under your specific process conditions.
Last Updated
: October 2026