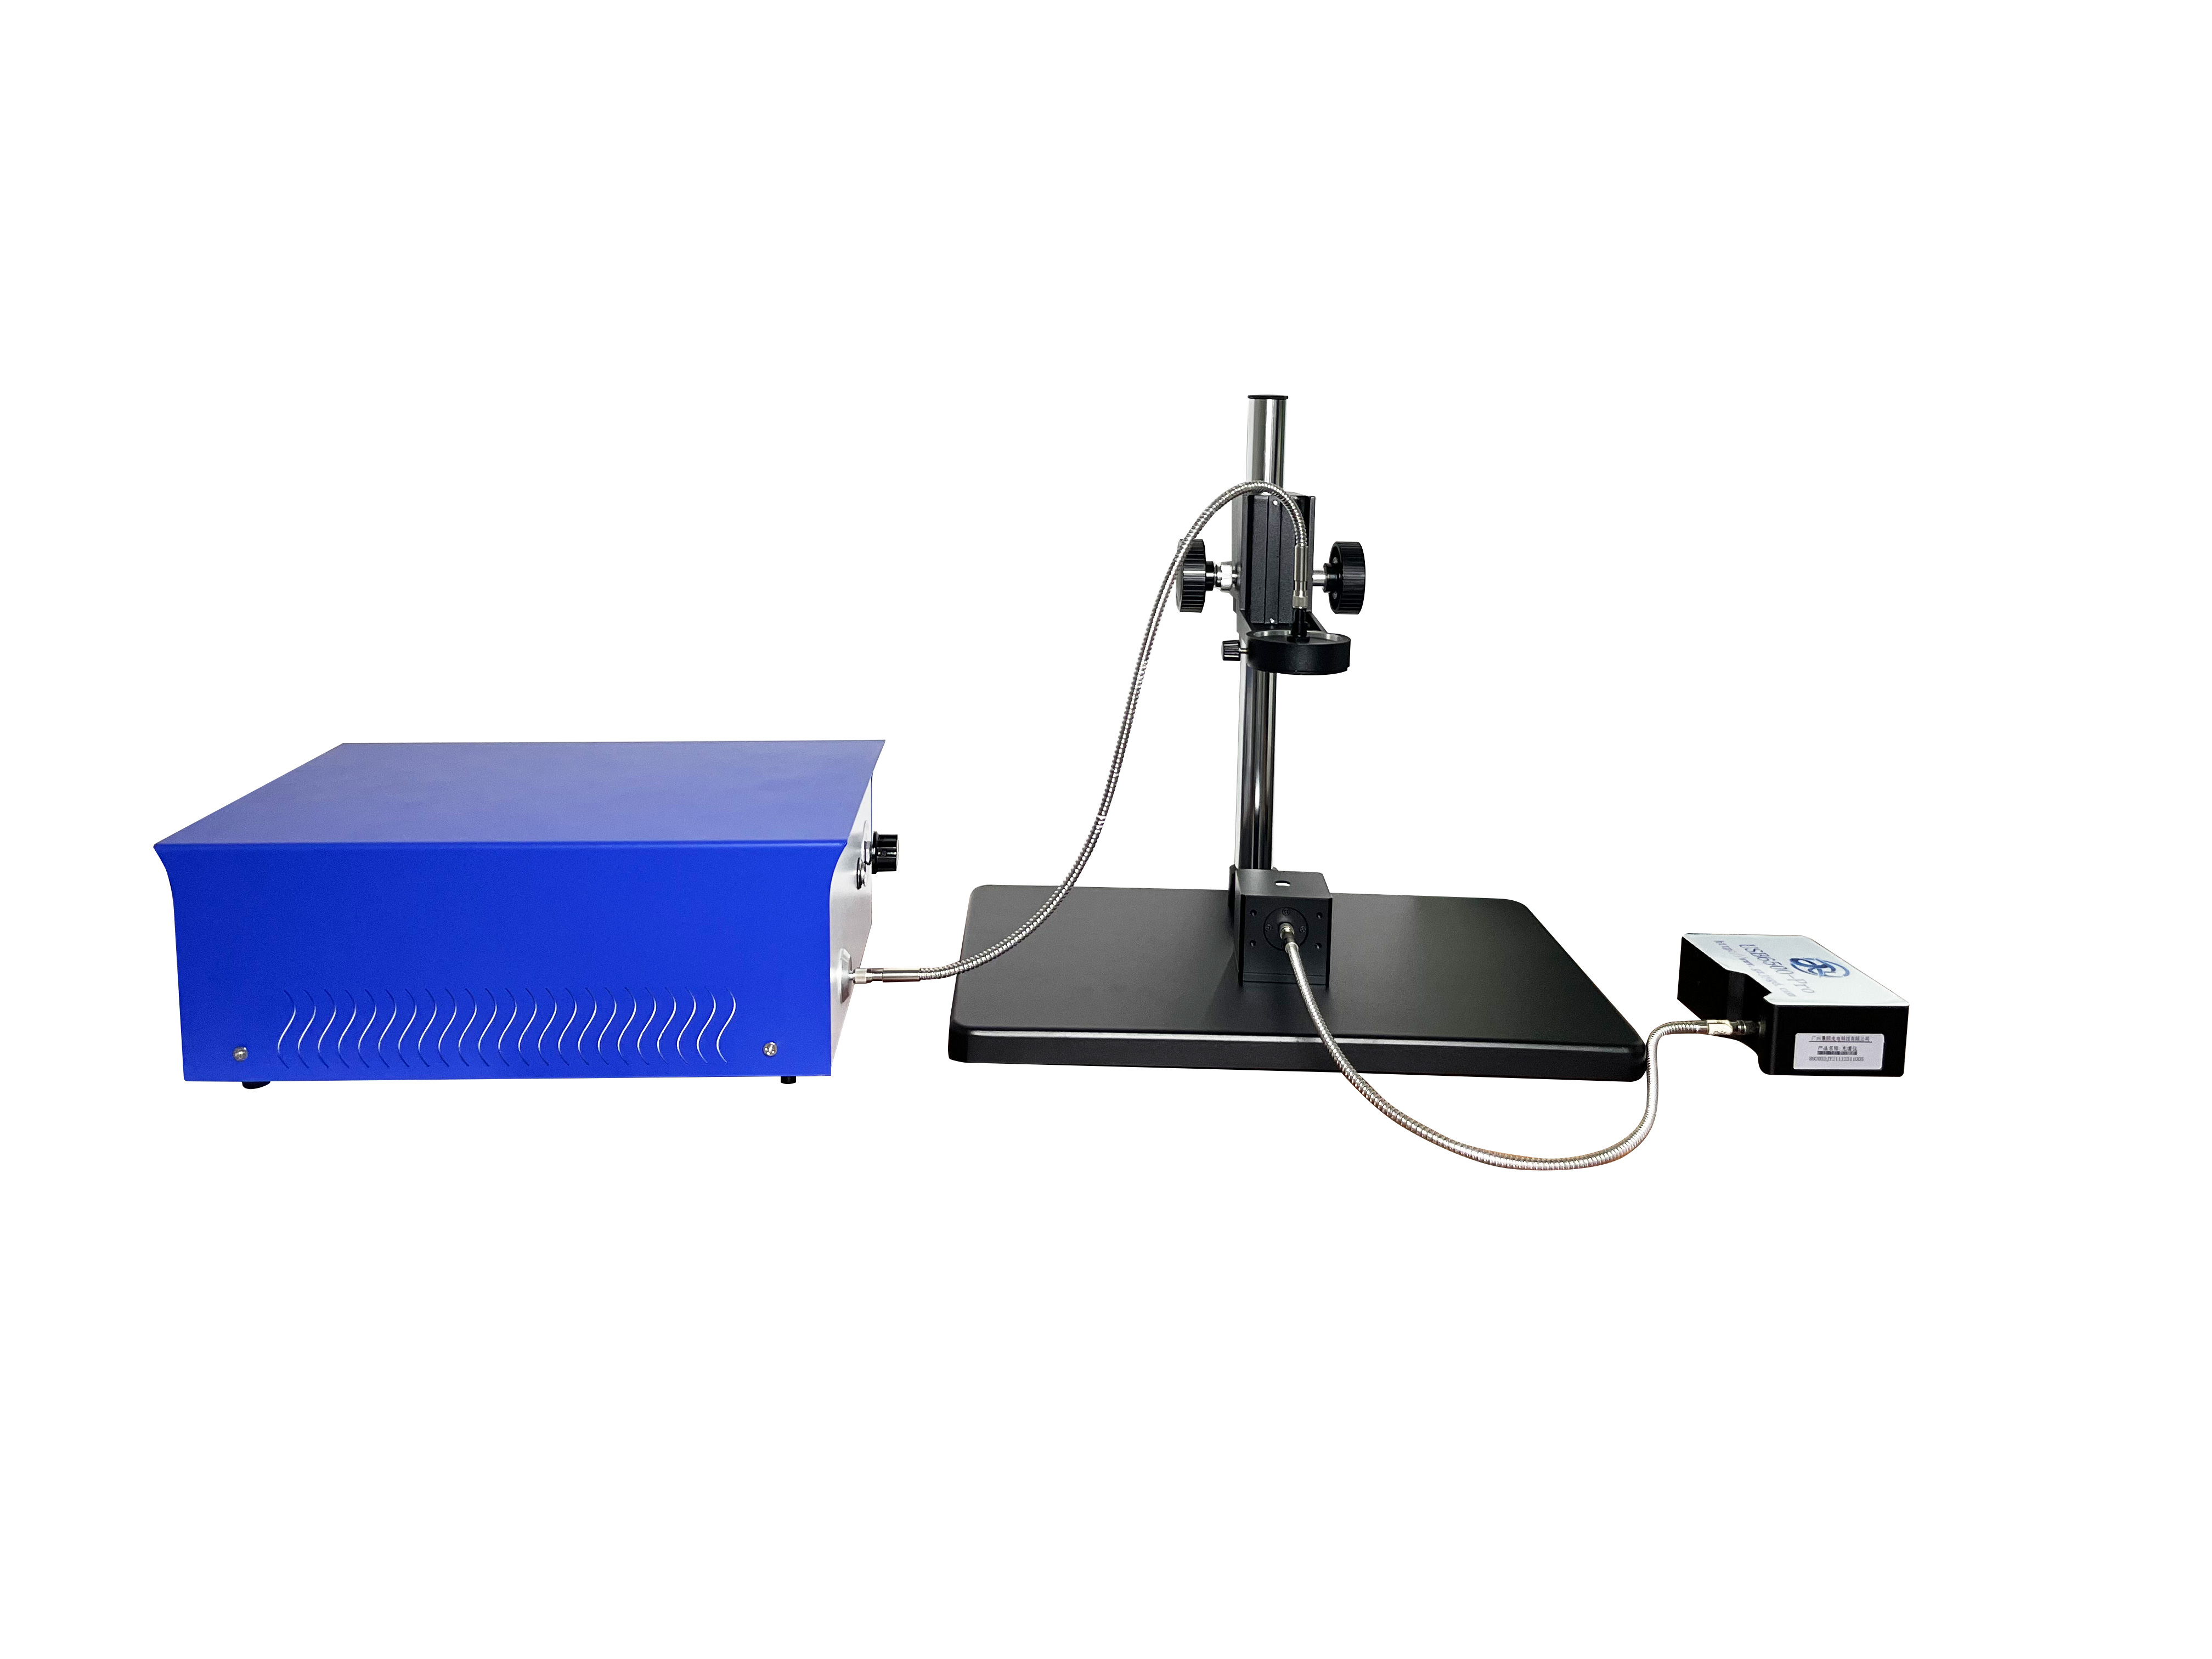
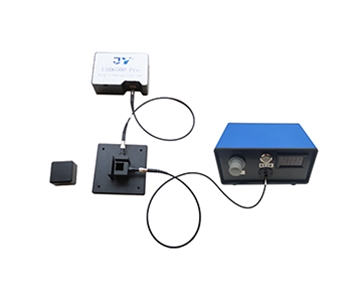
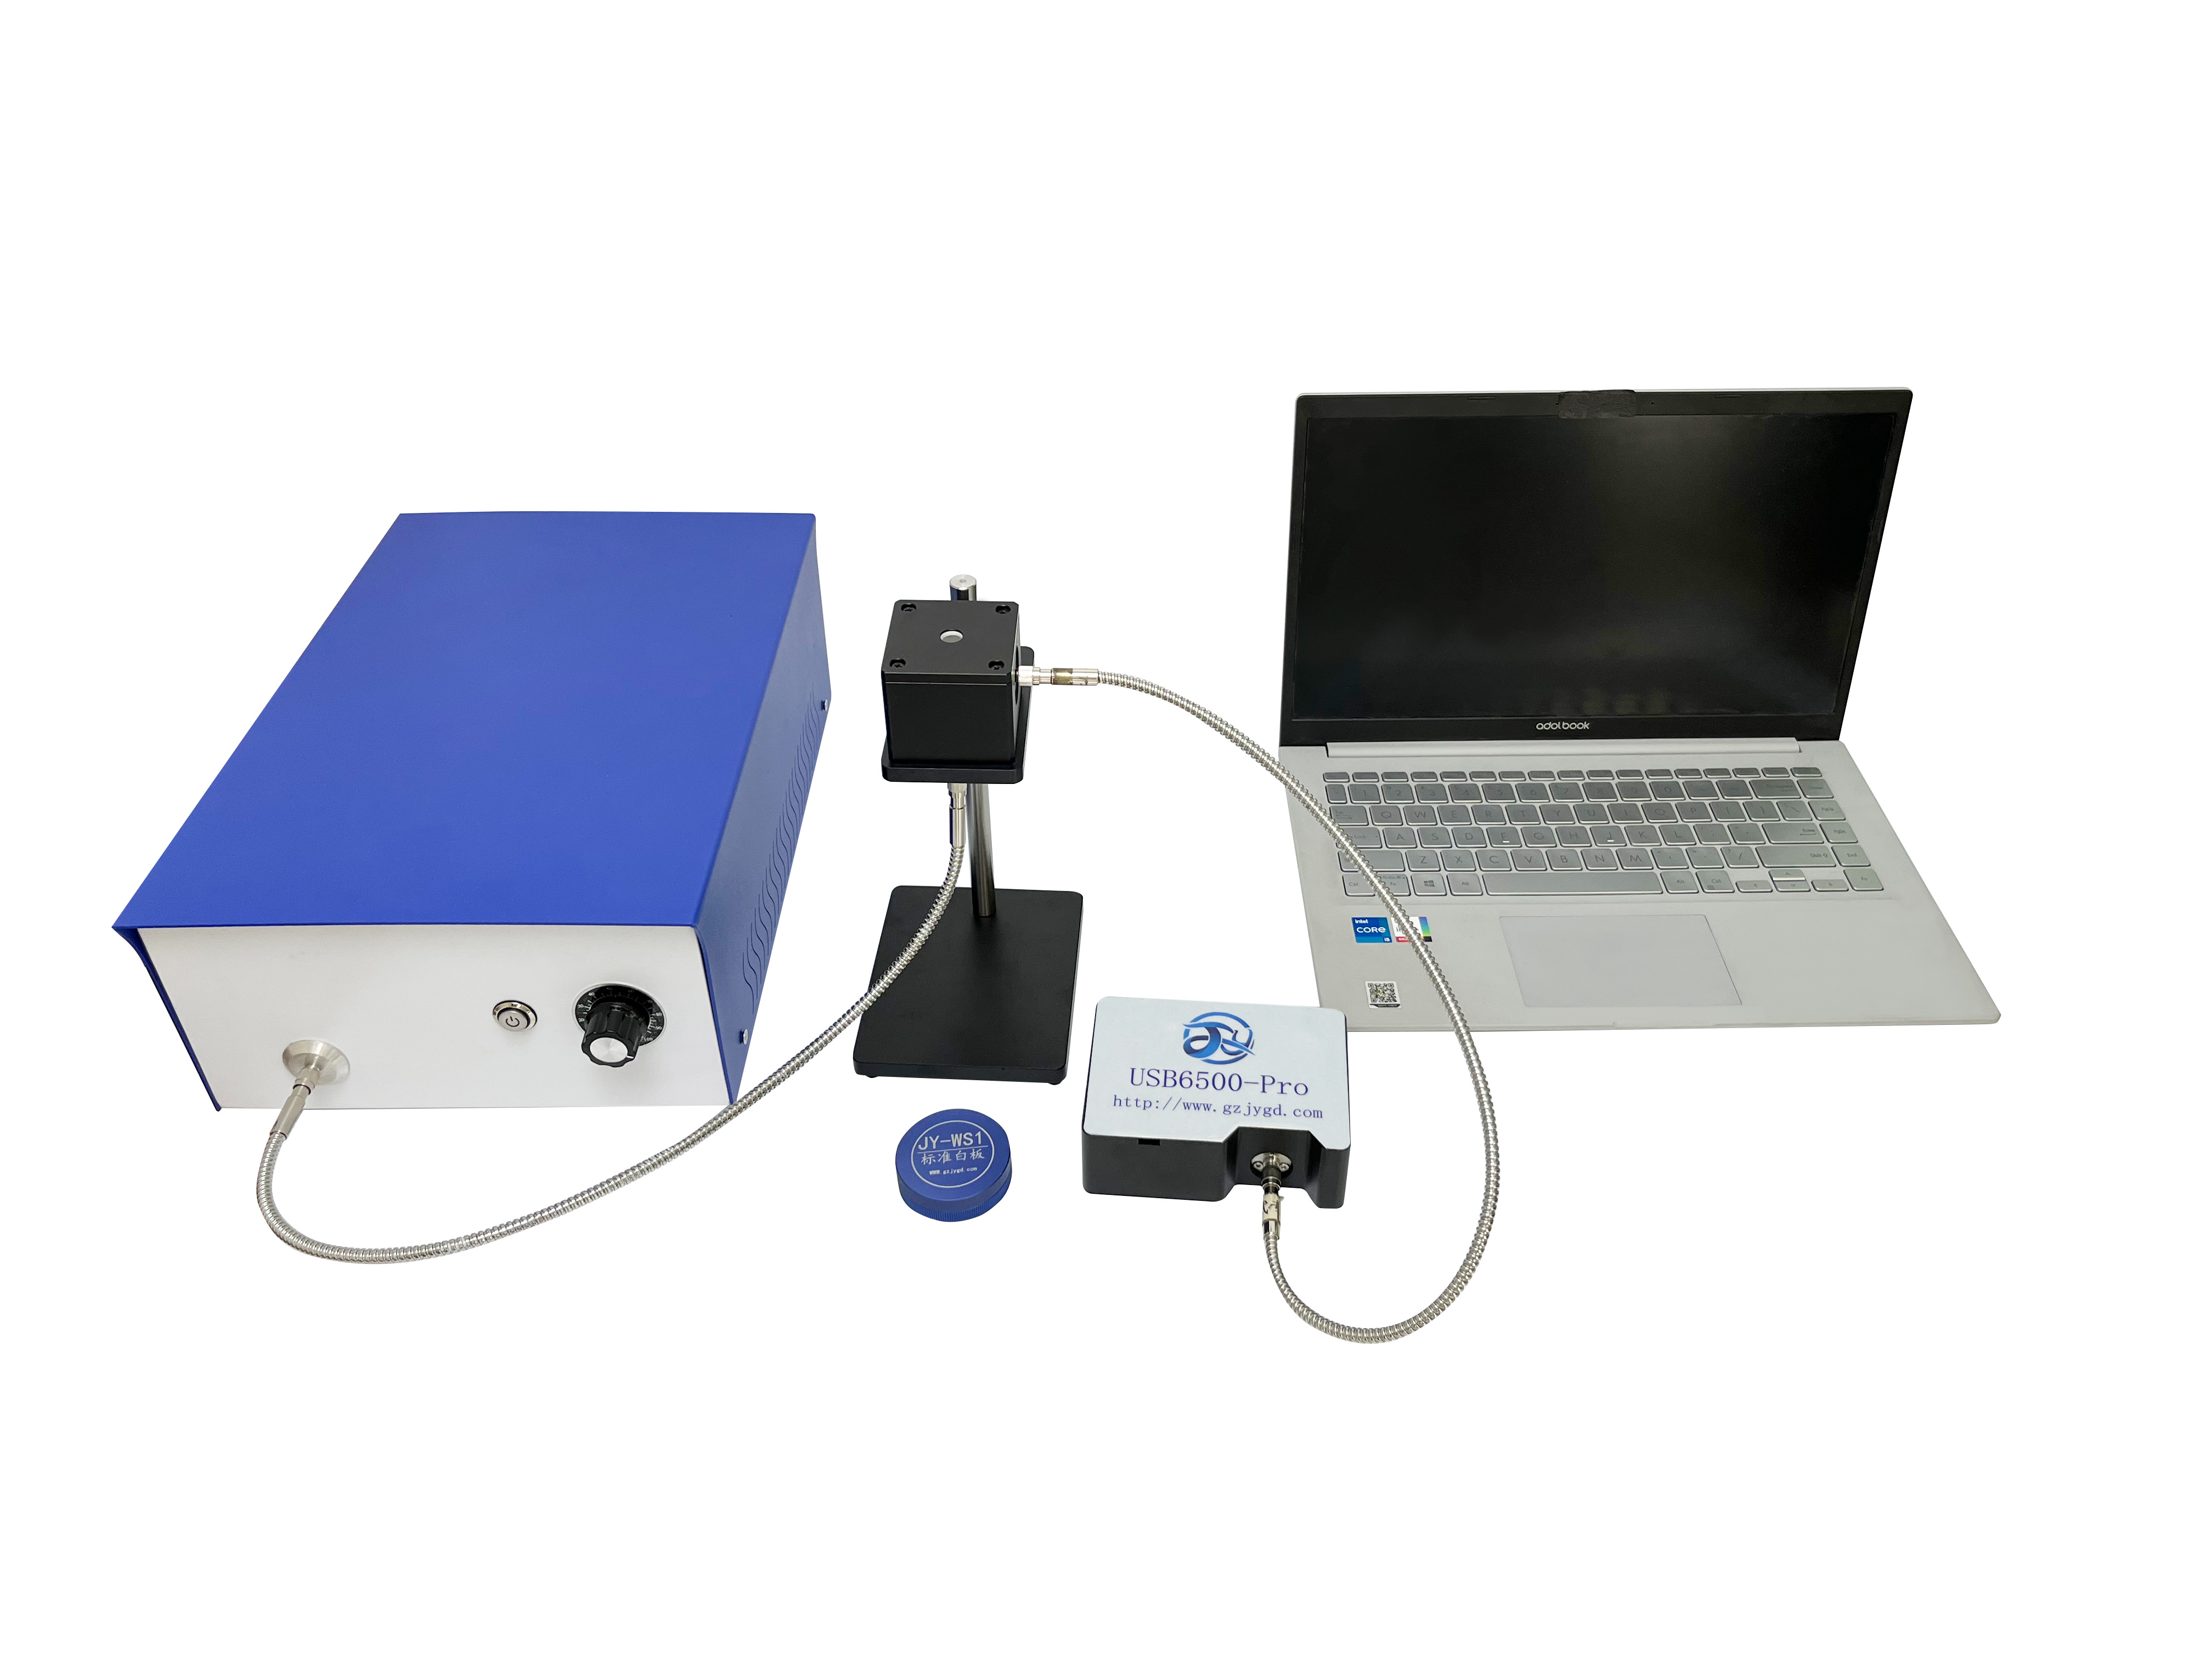
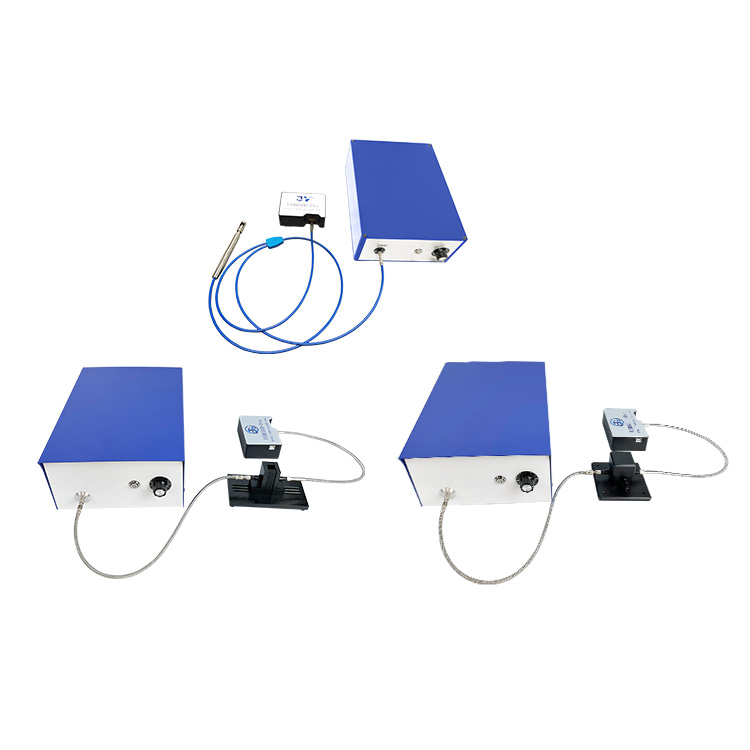
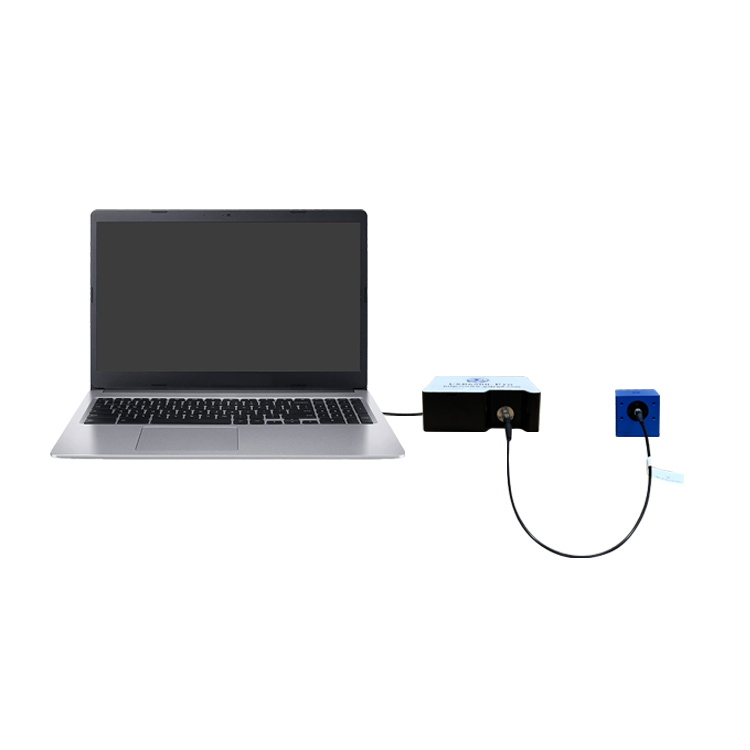
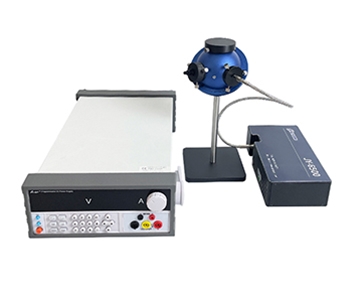
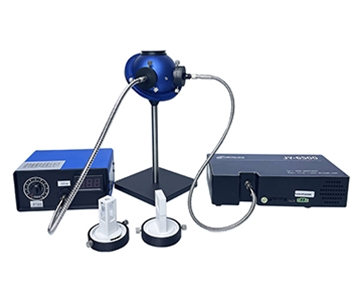
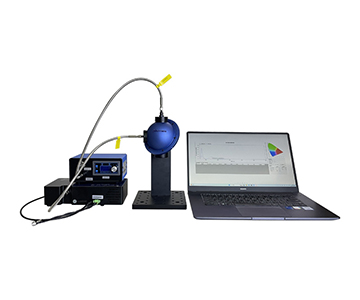
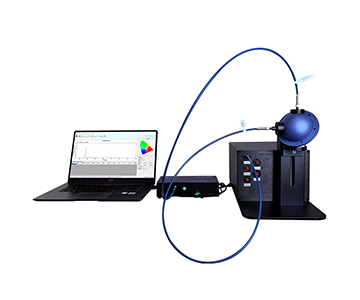
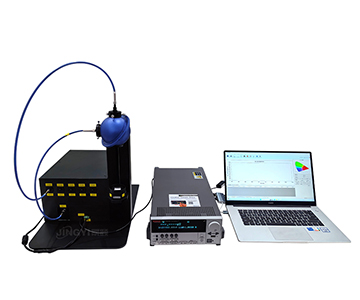
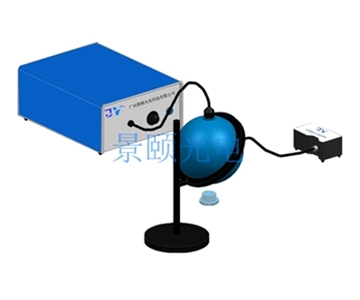
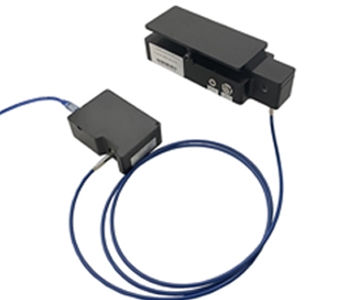
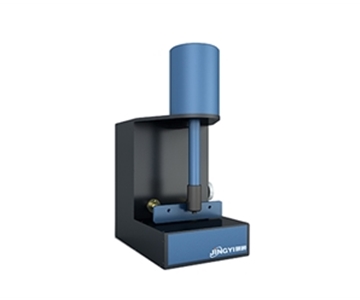
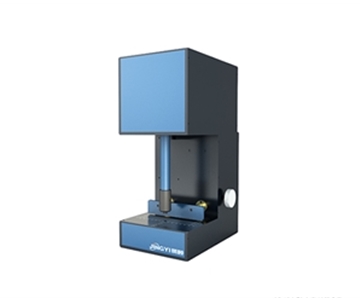
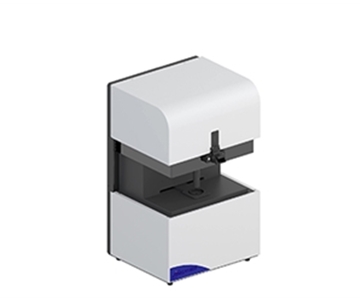
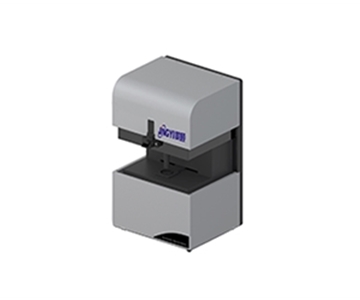
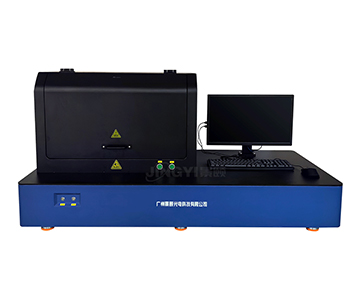
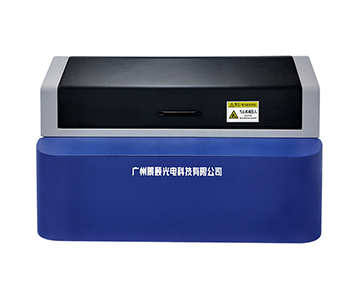
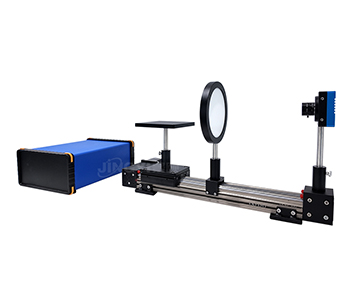
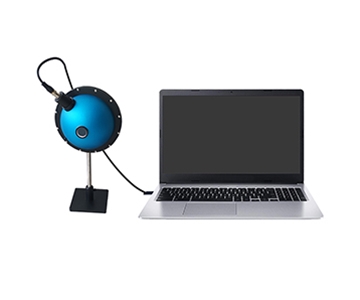
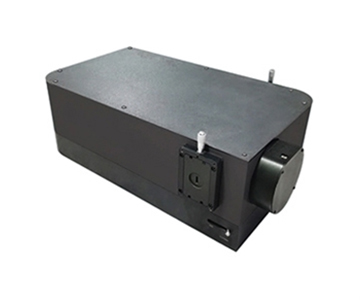
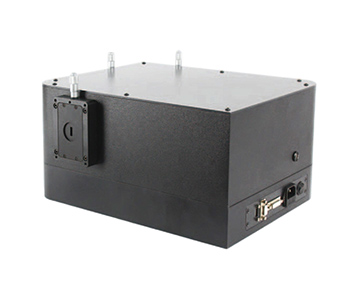
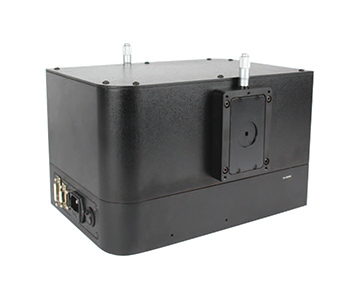
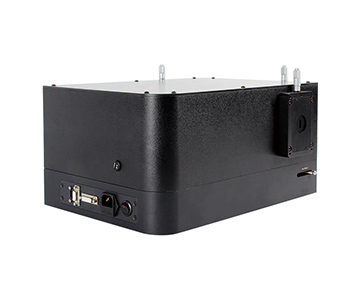
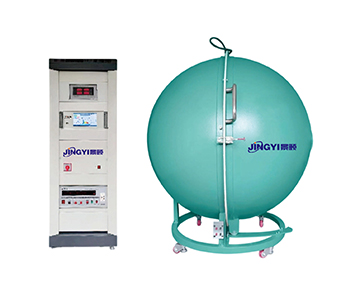
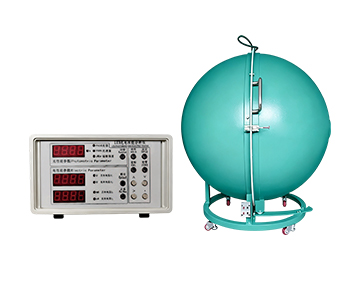
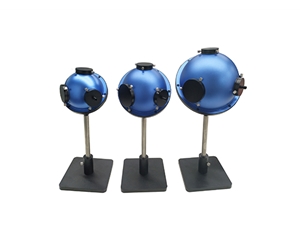
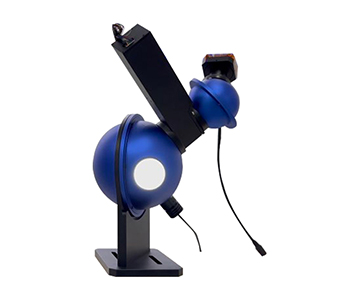
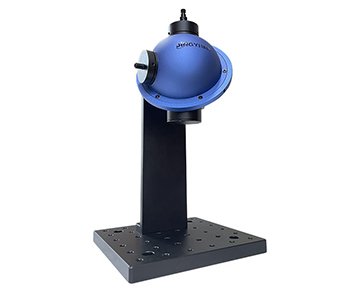
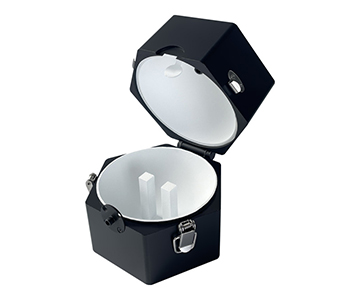
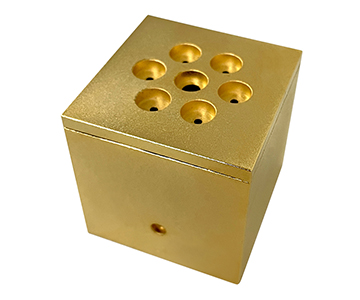
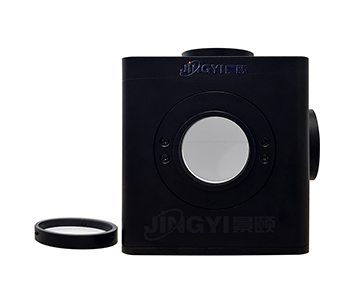
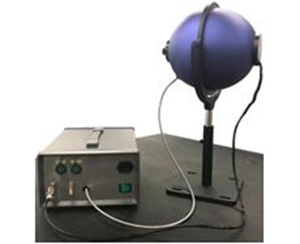
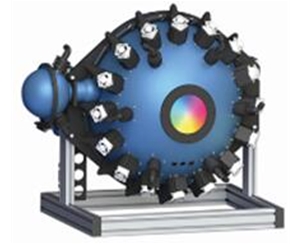
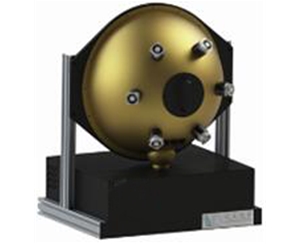
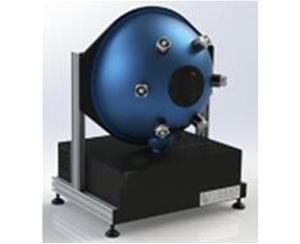
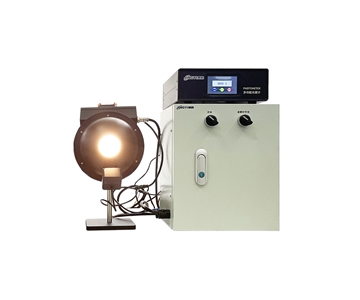
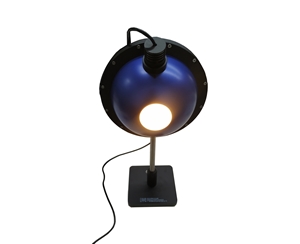
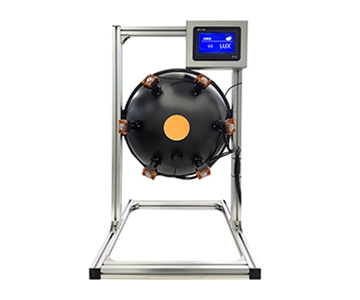
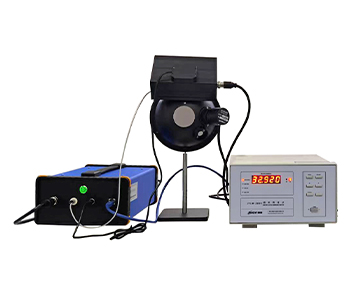
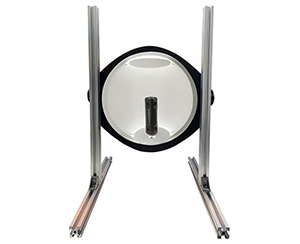
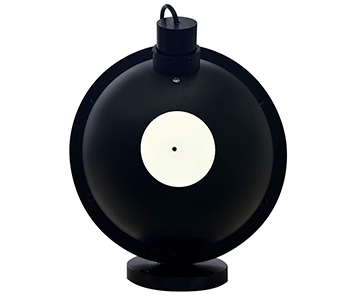
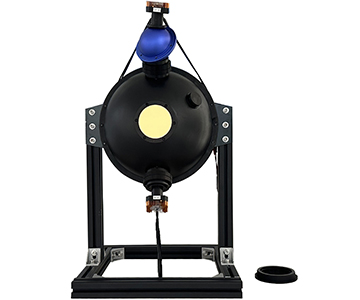
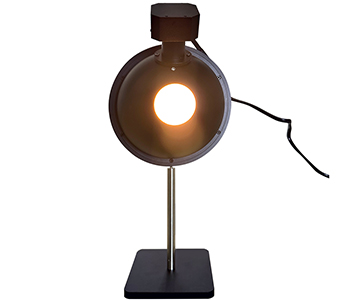
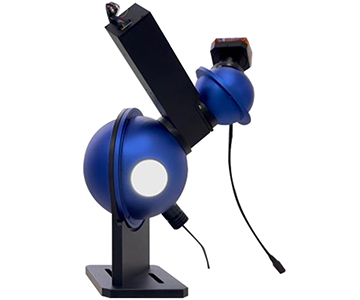
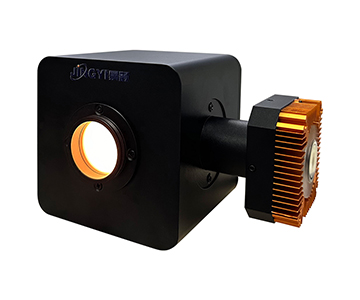
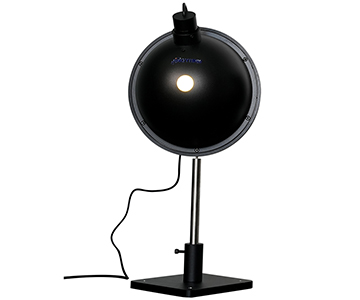
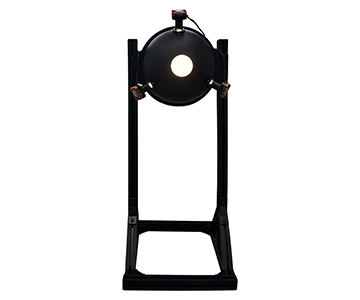
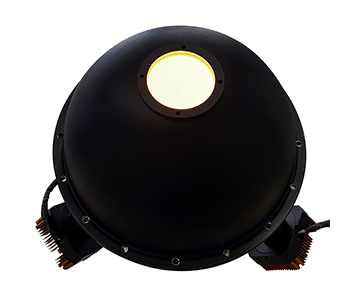
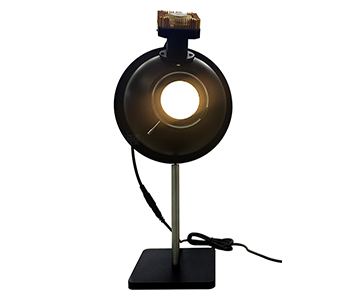
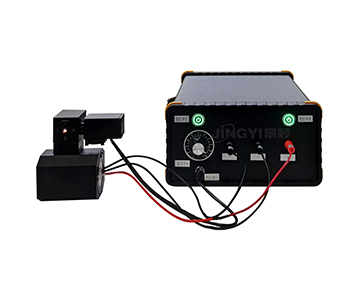
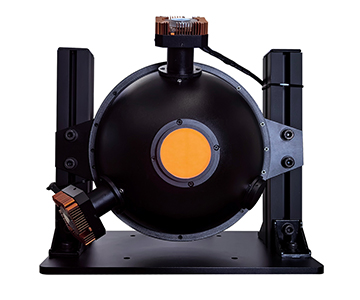
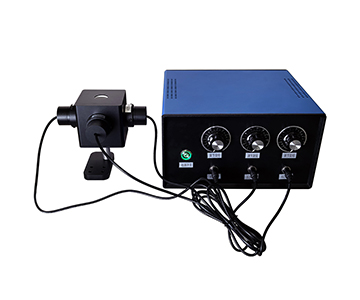
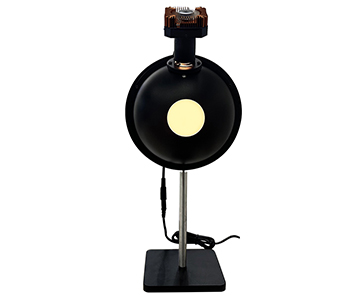
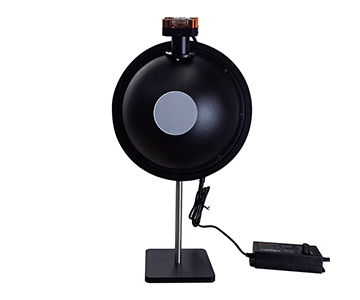
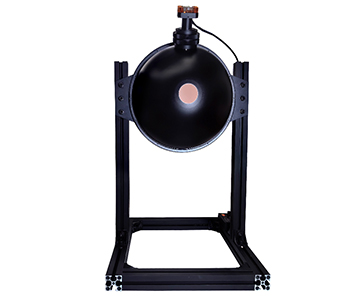
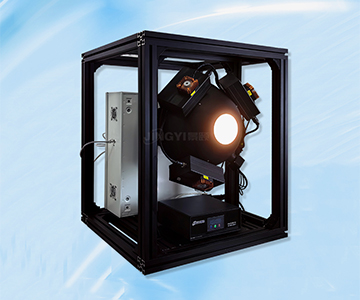
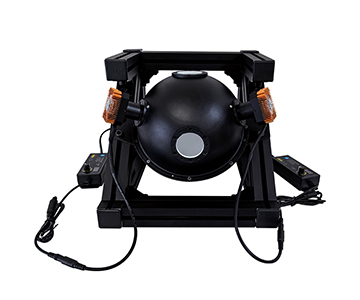
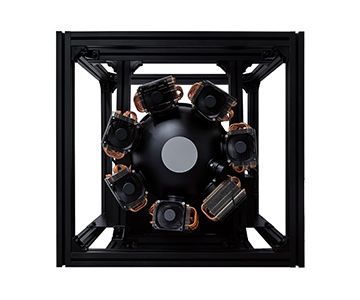
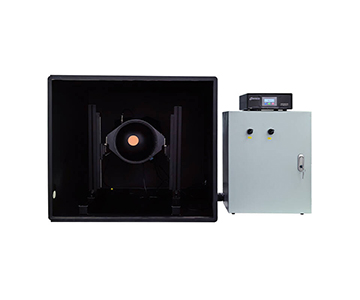
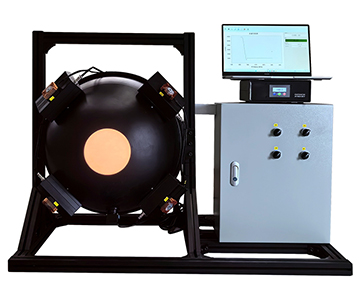
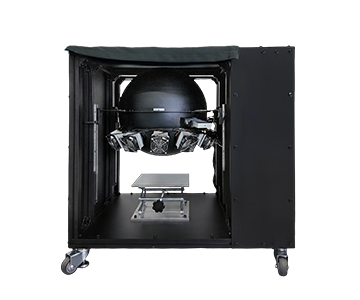
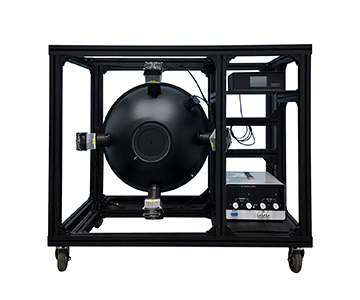
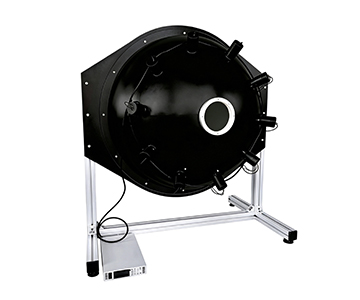
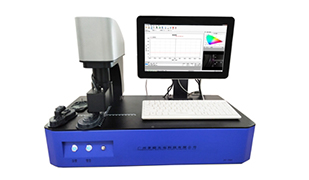
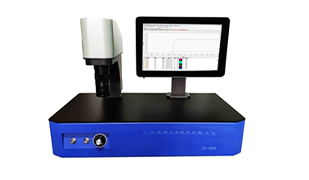
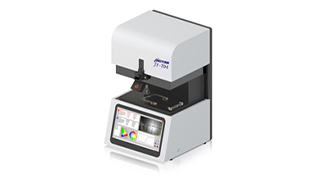
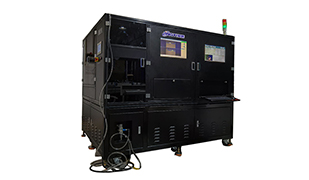
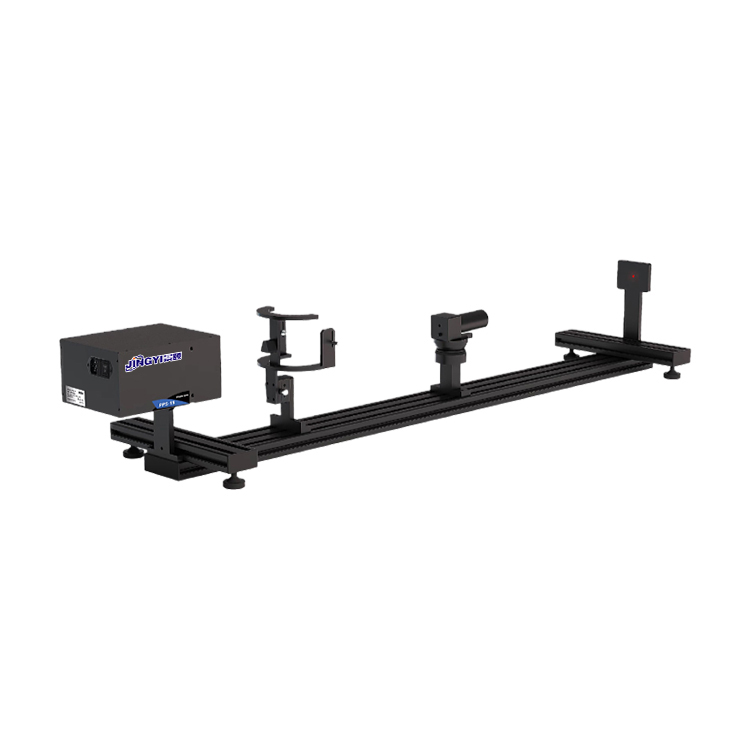
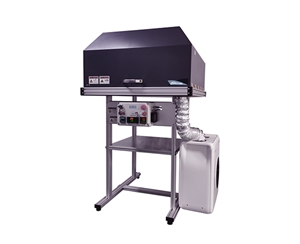
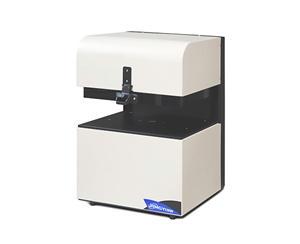
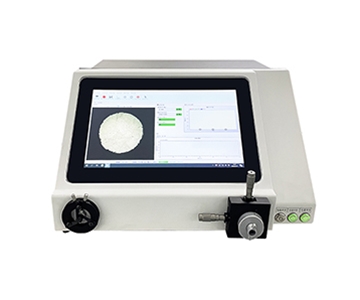
Plastic optical component testing demands full-spectrum integrating spheres that maintain Lambertian performance from ultraviolet through near-infrared wavelengths. This validation report documents transmittance and reflectance measurements across four industrial applications using a 200–2500 nm sphere system with 99% PTFE reflectance lining. Test data shows measurement deviation below 1.2 percentage points versus imported reference equipment at 0.5-second integration time, with process capability index (CPK) of 1.31 for the evaluated mainstream system. Results confirm traceable compliance with ISO 13468 total transmittance methodologies for metrology labs, optical component manufacturers, and photovoltaic calibration workflows.
Validation Methodology
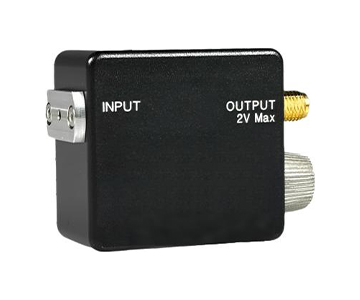
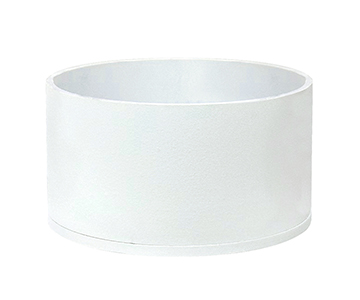
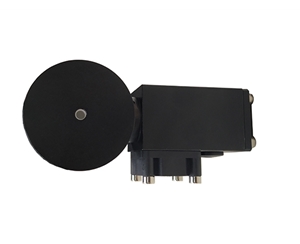
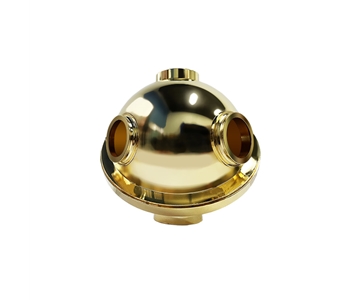
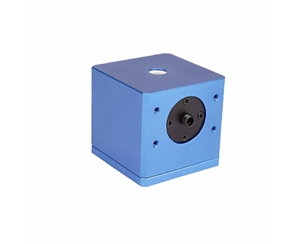
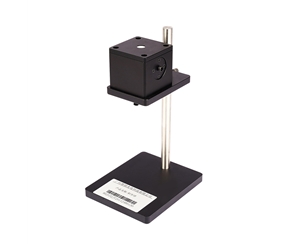
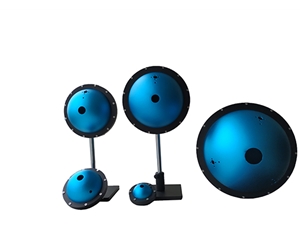
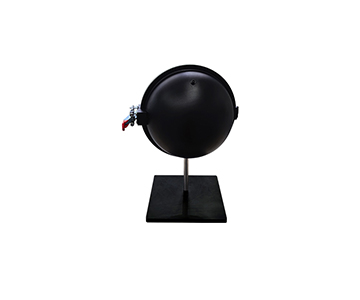
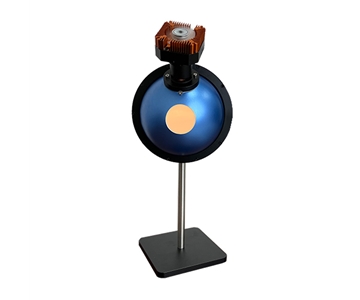
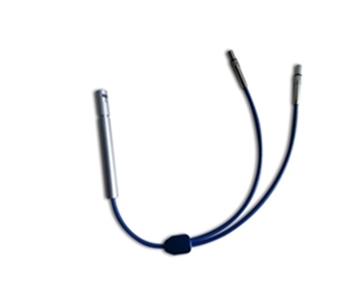
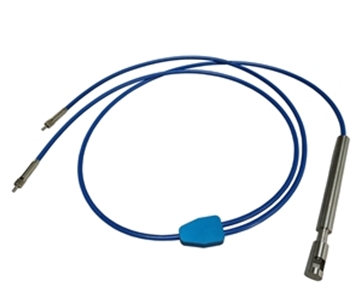
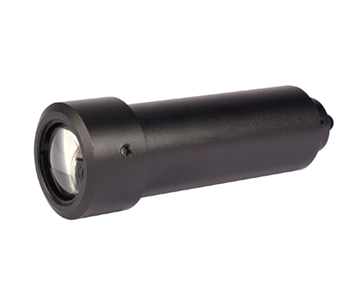
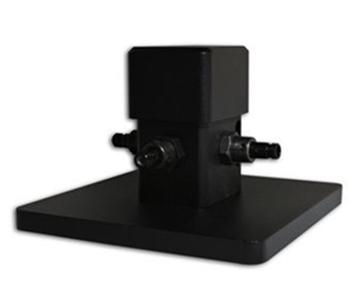
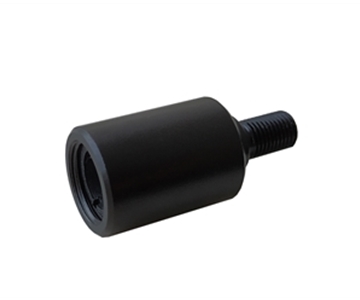
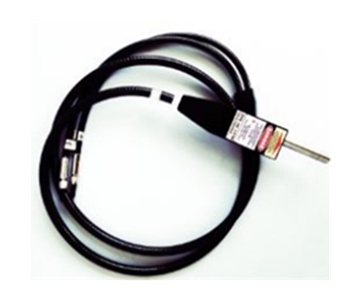
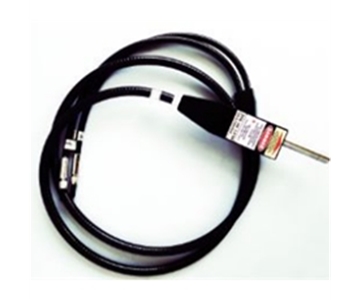
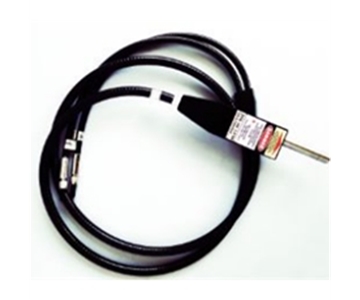
All measurements followed controlled environmental conditions per ISO 17025 annex guidelines. Four sample types were evaluated: a 0.37 mm polycarbonate filter, aerospace-grade fused silica window, 2.15 mm inner-diameter medical laser catheter, and OLED brightness enhancement film. Testing occurred in a cleanroom maintained at 23.5°C and 41% relative humidity to prevent PTFE coating degradation from moisture or particulate deposition. Two sphere configurations were assessed — a 10 mm internal diameter unit with 1.5 mm entrance port and 90° SMA 905 output, plus a 36 mm diameter configuration with 9.5 mm entrance port for larger specimens. Error sources included entrance port-to-sample area matching, fiber coupling efficiency variance, and polarization memory effects from multiple internal reflections.
Industry Measurement Case Studies
Semiconductor Filter Transmittance Verification
A wafer auxiliary material supplier replaced gravimetric thickness推算 with direct spectroscopic transmittance measurement for polycarbonate filter outgoing inspection. The previous method produced errors exceeding 3.7%. Switching to the 10 mm sphere configuration, 30 consecutive PC filters were measured at the 450 nm wavelength point.
| Sample ID |
10mm Sphere Transmittance (%) |
Import Reference (%) |
Deviation (%) |
| PC-01 |
88.24 |
88.91 |
-0.67 |
| PC-02 |
87.96 |
88.52 |
-0.56 |
| PC-03 |
88.31 |
88.85 |
-0.54 |
| Mean |
88.17 |
88.76 |
-0.59 |
The data confirms strong agreement between the evaluated small-aperture system and imported reference equipment in the visible spectrum. Below 380 nm, deviation widens to approximately 1.2 percentage points — a limitation traced to the reduced acceptance solid angle of small-diameter spheres in ultraviolet ranges.
Aerospace Optical Window Transmittance
An aerospace component manufacturer required full-aperture uniform illumination during fused silica window acceptance testing. The 36 mm sphere configuration accommodated an 8 mm diameter sample without edge vignetting. At 8° beam incidence, the internal cavity achieved 97.3% output field uniformity after 14 or more diffuse reflections, satisfying the facility's drawing specifications. One trade-off: single-measurement integration time extended to 0.82 seconds, approximately 0.15 seconds slower than equivalent imported hardware, requiring buffer stations in automated production lines sensitive to cycle time.
Medical Laser Catheter Haze Measurement
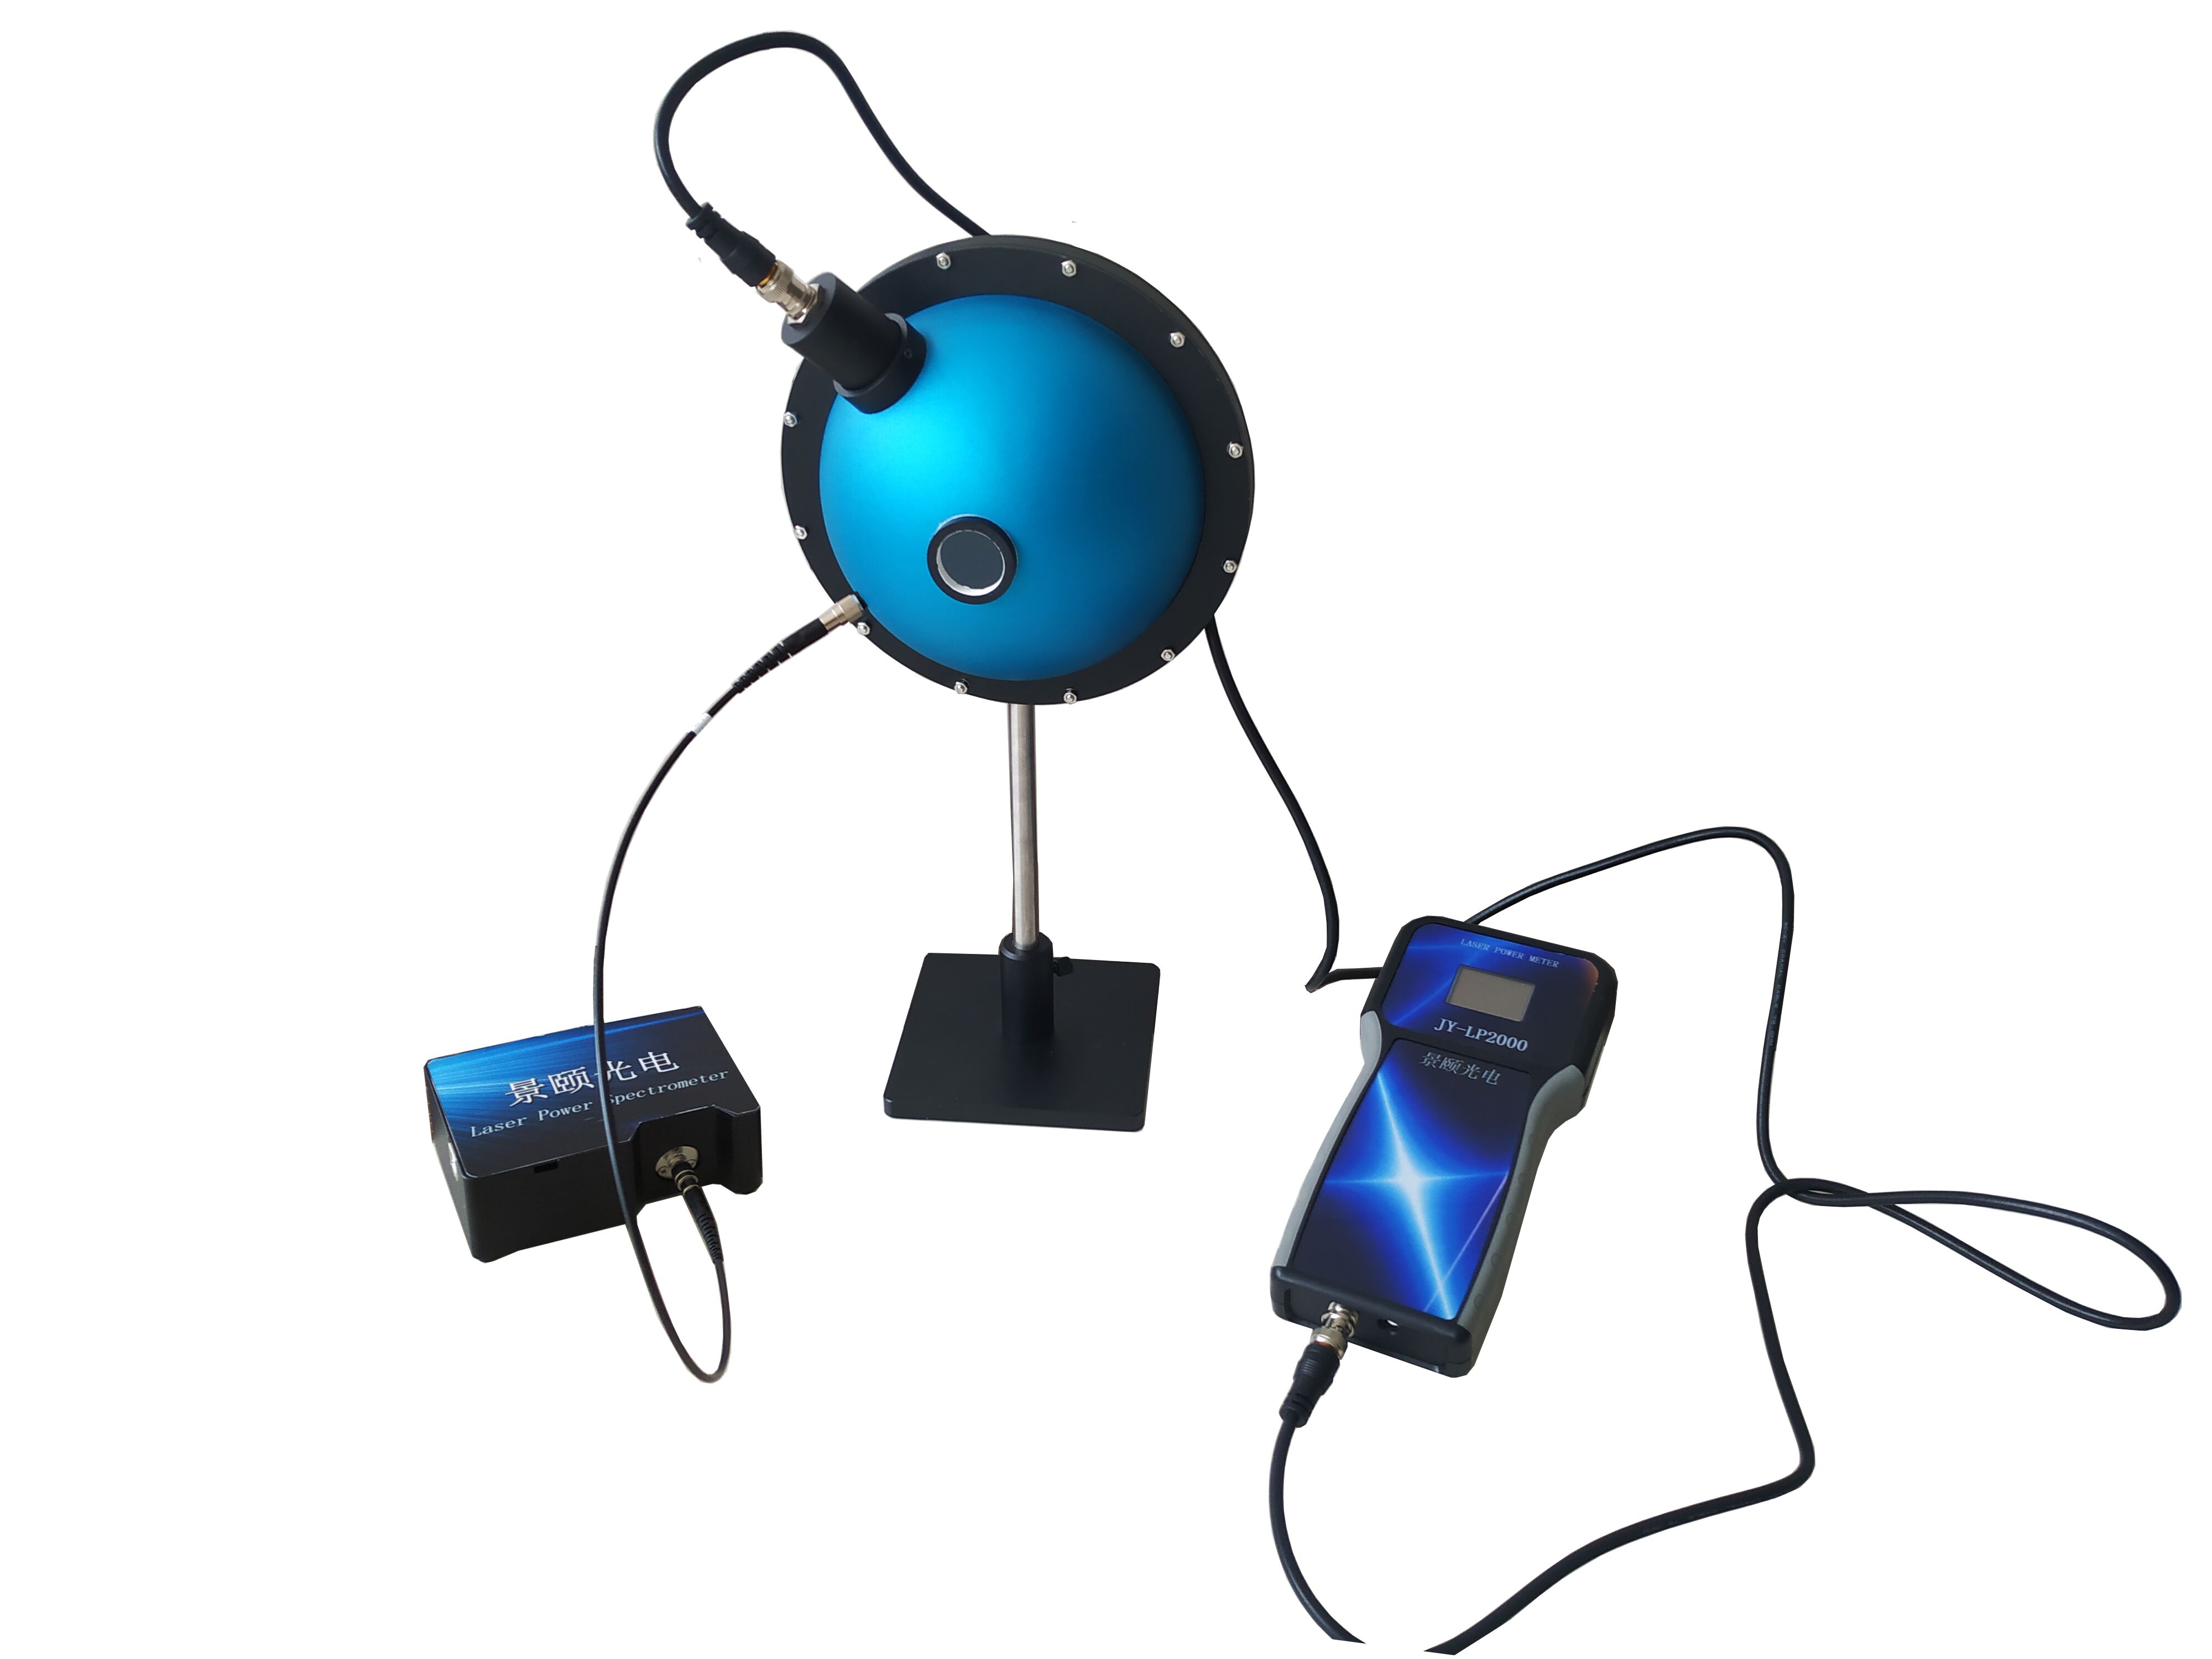
A medical laser device manufacturer measured inner and outer wall haze on catheters using a 15 mm internal diameter sphere with 3 mm entrance port, SMA 905 interface, and attached spectrometer. At 630 nm laser wavelength, five production batches yielded haze values between 2.15% and 3.74%, consistent with the ≤4% specification. However, in the deep-red near-infrared region above 1100 nm, detector dark noise elevated the relative standard deviation from 0.37% to 1.04%, necessitating software-based dark-field subtraction.
Display Panel Reflectance Analysis
A 15 mm reflectance sphere with 5 mm sample port measured diffuse reflectance from a brightness enhancement film. The test employed a light trap design to isolate diffuse components by excluding specular reflection, per ISO 13468 protocols for separating specular and diffuse reflectance in plastics. At 550 nm, measured diffuse reflectance registered 83.2%, deviating 0.48 percentage points from reference specimen values. This confirms that measurement traceability is achievable with proper 8° incidence and perpendicular collection geometry, provided standards are strictly followed.
Comparative CPK Analysis: Three Equipment Tiers
Import Premium vs. Domestic Mainstream vs. Domestic Economy
Identical polycarbonate thin films were measured 25 times on each of three equipment tiers to calculate process capability index (CPK).
| Metric |
Import Premium Tier |
Mainstream Tier |
Economy Tier |
| 450nm Transmittance Mean (%) |
88.91 |
88.76 |
87.33 |
| Standard Deviation (%) |
0.21 |
0.34 |
0.92 |
| CPK |
1.72 |
1.31 |
0.84 |
| Single Measurement Time (sec) |
0.55 |
0.67 |
0.41 |
| UV SNR at 250nm |
412:1 |
287:1 |
153:1 |
| Port Customization Lead Time (days) |
21 |
7 |
3 |
The import premium tier retains advantages in CPK and ultraviolet signal-to-noise ratio, but at the cost of 21-day customization lead times and significantly higher procurement budgets. The mainstream tier achieves a CPK of 1.31 — approaching the production line threshold of 1.33 — with 287:1 UV SNR sufficient for most visible-to-near-infrared applications. The economy tier's CPK of 0.84 reflects compromised repeatability and deep-UV performance, restricting it to qualitative screening where cost sensitivity overrides precision. Interestingly, the economy configuration measures fastest due to shorter optical path length within the smaller cavity; the mainstream tier's 0.12-second pen
Field Performance and User Feedback
Metrology Institute Long-Term Tracking
A provincial-level calibration laboratory integrated a mainstream-tier sphere into routine calibration cycles starting in 2024. Authorized data from 11 consecutive monthly verifications shows maximum drift of 0.63% at 633 nm on a standard white reference — within the facility's ±1% internal quality control limits. One noted issue involved thread loosening between the sphere housing and fiber adapter after repeated assembly cycles, resolved when the manufacturer supplied a reinforcement kit in the seventh month.
Small-Aperture Collection Limitation
A fiber optic component manufacturer reported extended alignment time when measuring 1.2 mm diameter collimating lenses with the 10 mm sphere, attributed to the 1.5 mm entrance port. Per-part setup required approximately 42 seconds longer than large-aperture configurations. This is not a defect but an inherent constraint of small internal diameter geometries when handling miniature optical elements.
Error Traceability and Implementation Guidance
Port Area to Optical Path Trade-offs
Total port area should not exceed 5% of internal sphere surface area to preserve integration assumptions. Testing revealed that enlarging the entrance port from 1.5 mm to 3 mm on the small sphere increased signal strength by a factor of 3.7, but reduced internal uniformity from 98.1% to 95.4%. System integration should therefore determine sample dimensions first, then derive port sizing — not pursue maximum entrance aperture indiscriminately.
Coating Uniformity and Long-Term Stability
While PTFE foam coatings are specified at 99% reflectance, localized variance of ±1% occurs in practice. One failure analysis traced low readings at 2500 nm to a compression mark on the cavity bottom, reducing local reflectance to 97.2%. Production lines should perform full-spectrum scans with a standard white reference every six months to detect coating aging or mechanical damage before measurement drift exceeds tolerances.
Honest Limitations
Deep Ultraviolet Collection Bottleneck in Small Cavities
Performance divergence between 10 mm and 36 mm configurations becomes pronounced in the 200–380 nm range. Small spheres, with shorter optical paths and fewer reflection events, struggle to exceed 300:1 signal-to-noise in ultraviolet — inadequate for trace UV absorption analysis. Applications concentrated below 250 nm require deuterium lamp sources paired with larger cavities or dedicated UV integrating spheres.
Custom Port Geometry Trade-offs
Frequently Asked Questions
How can I confirm spectral reflectance compliance after custom sphere fabrication?
Request the supplier provide full-spectrum reflectance curves for the cavity coating, with emphasis on the 200 nm and 2500 nm endpoints. Cross-validate using a standard white reference with known reflectance values; deviations exceeding 1 percentage point warrant rework or rejection.
Why are high diffuse reflectance coatings preferred for laser measurement applications?
These coatings convert coherent laser input into a uniform scattering field, preventing detector saturation from coherent hot spots. When pulse energy fluctuates, the uniform cavity maintains output signal relative standard deviation within 0.5%.
What interface considerations apply for infrared spectrum measurements?
SMA 905 or FC interfaces with matched fiber core diameters are recommended for infrared ranges. Mismatched numerical aperture between the exit port and spectrometer entrance slit causes long-wavelength energy loss, typically appearing as steep SNR degradation above 1700 nm.
Which tier offers the most balanced value for laboratory and metrology use?
For most calibration and R&D scenarios, the mainstream tier balances CPK, customization lead time, and acquisition cost effectively. The economy tier is only appropriate where cycle time constraints or extreme budget limitations override measurement precision requirements.
What is the standard method for independently verifying supplier repeatability claims?
Request a loaner unit for one week. Measure your facility's retained reference standards three times daily over five consecutive days, then calculate overall standard deviation. If results diverge from the supplier's factory report by more than 20%, require re-calibration or pursue
Reference Information
Sources
: SEMI Annual Report, Chinese Optical Society Technical White Paper, authorized customer test data, GB/T 47066-2026 national standard
Author
: Cai Xiaodong, Senior Application Engineer, Jingyi Optoelectronics — 12 years in industrial precision optical measurement equipment
Conflict of Interest
: Jingyi Optoelectronics manufactures integrating sphere systems. This analysis draws on published specifications, customer-authorized test data, and public industry standards without third-party sponsorship.
Intended Use
: Educational and technical reference only; validate all equipment selections through independent on-site proof-of-concept testing under your specific process conditions.
Updated
: November 2026
For detailed specifications and application notes on integrating sphere systems, search "Jingyi Optoelectronics + integrating sphere" or visit our technical library.