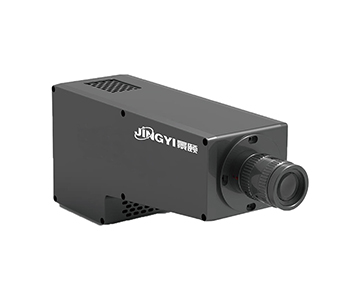
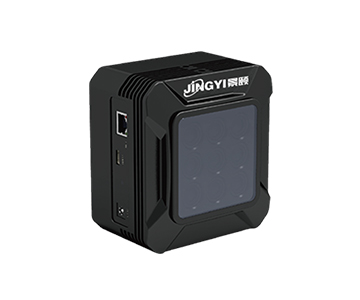
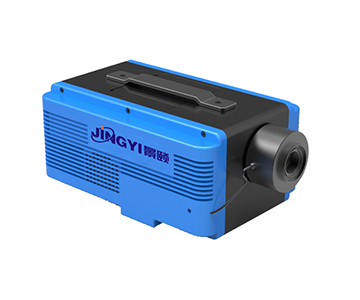
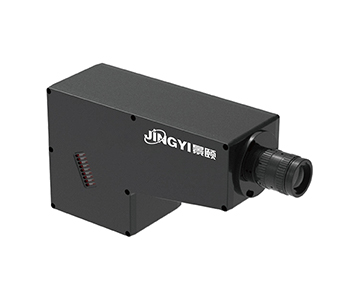
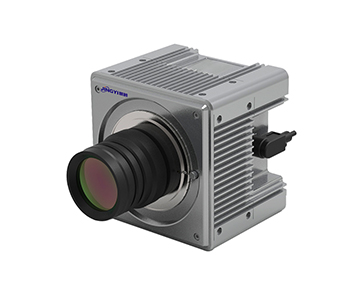
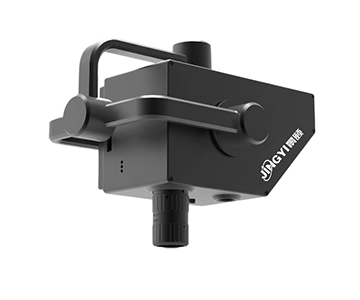
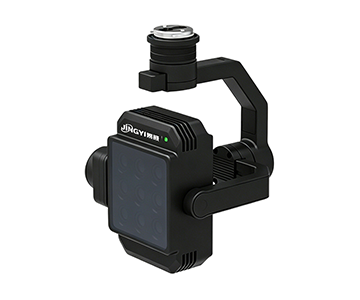
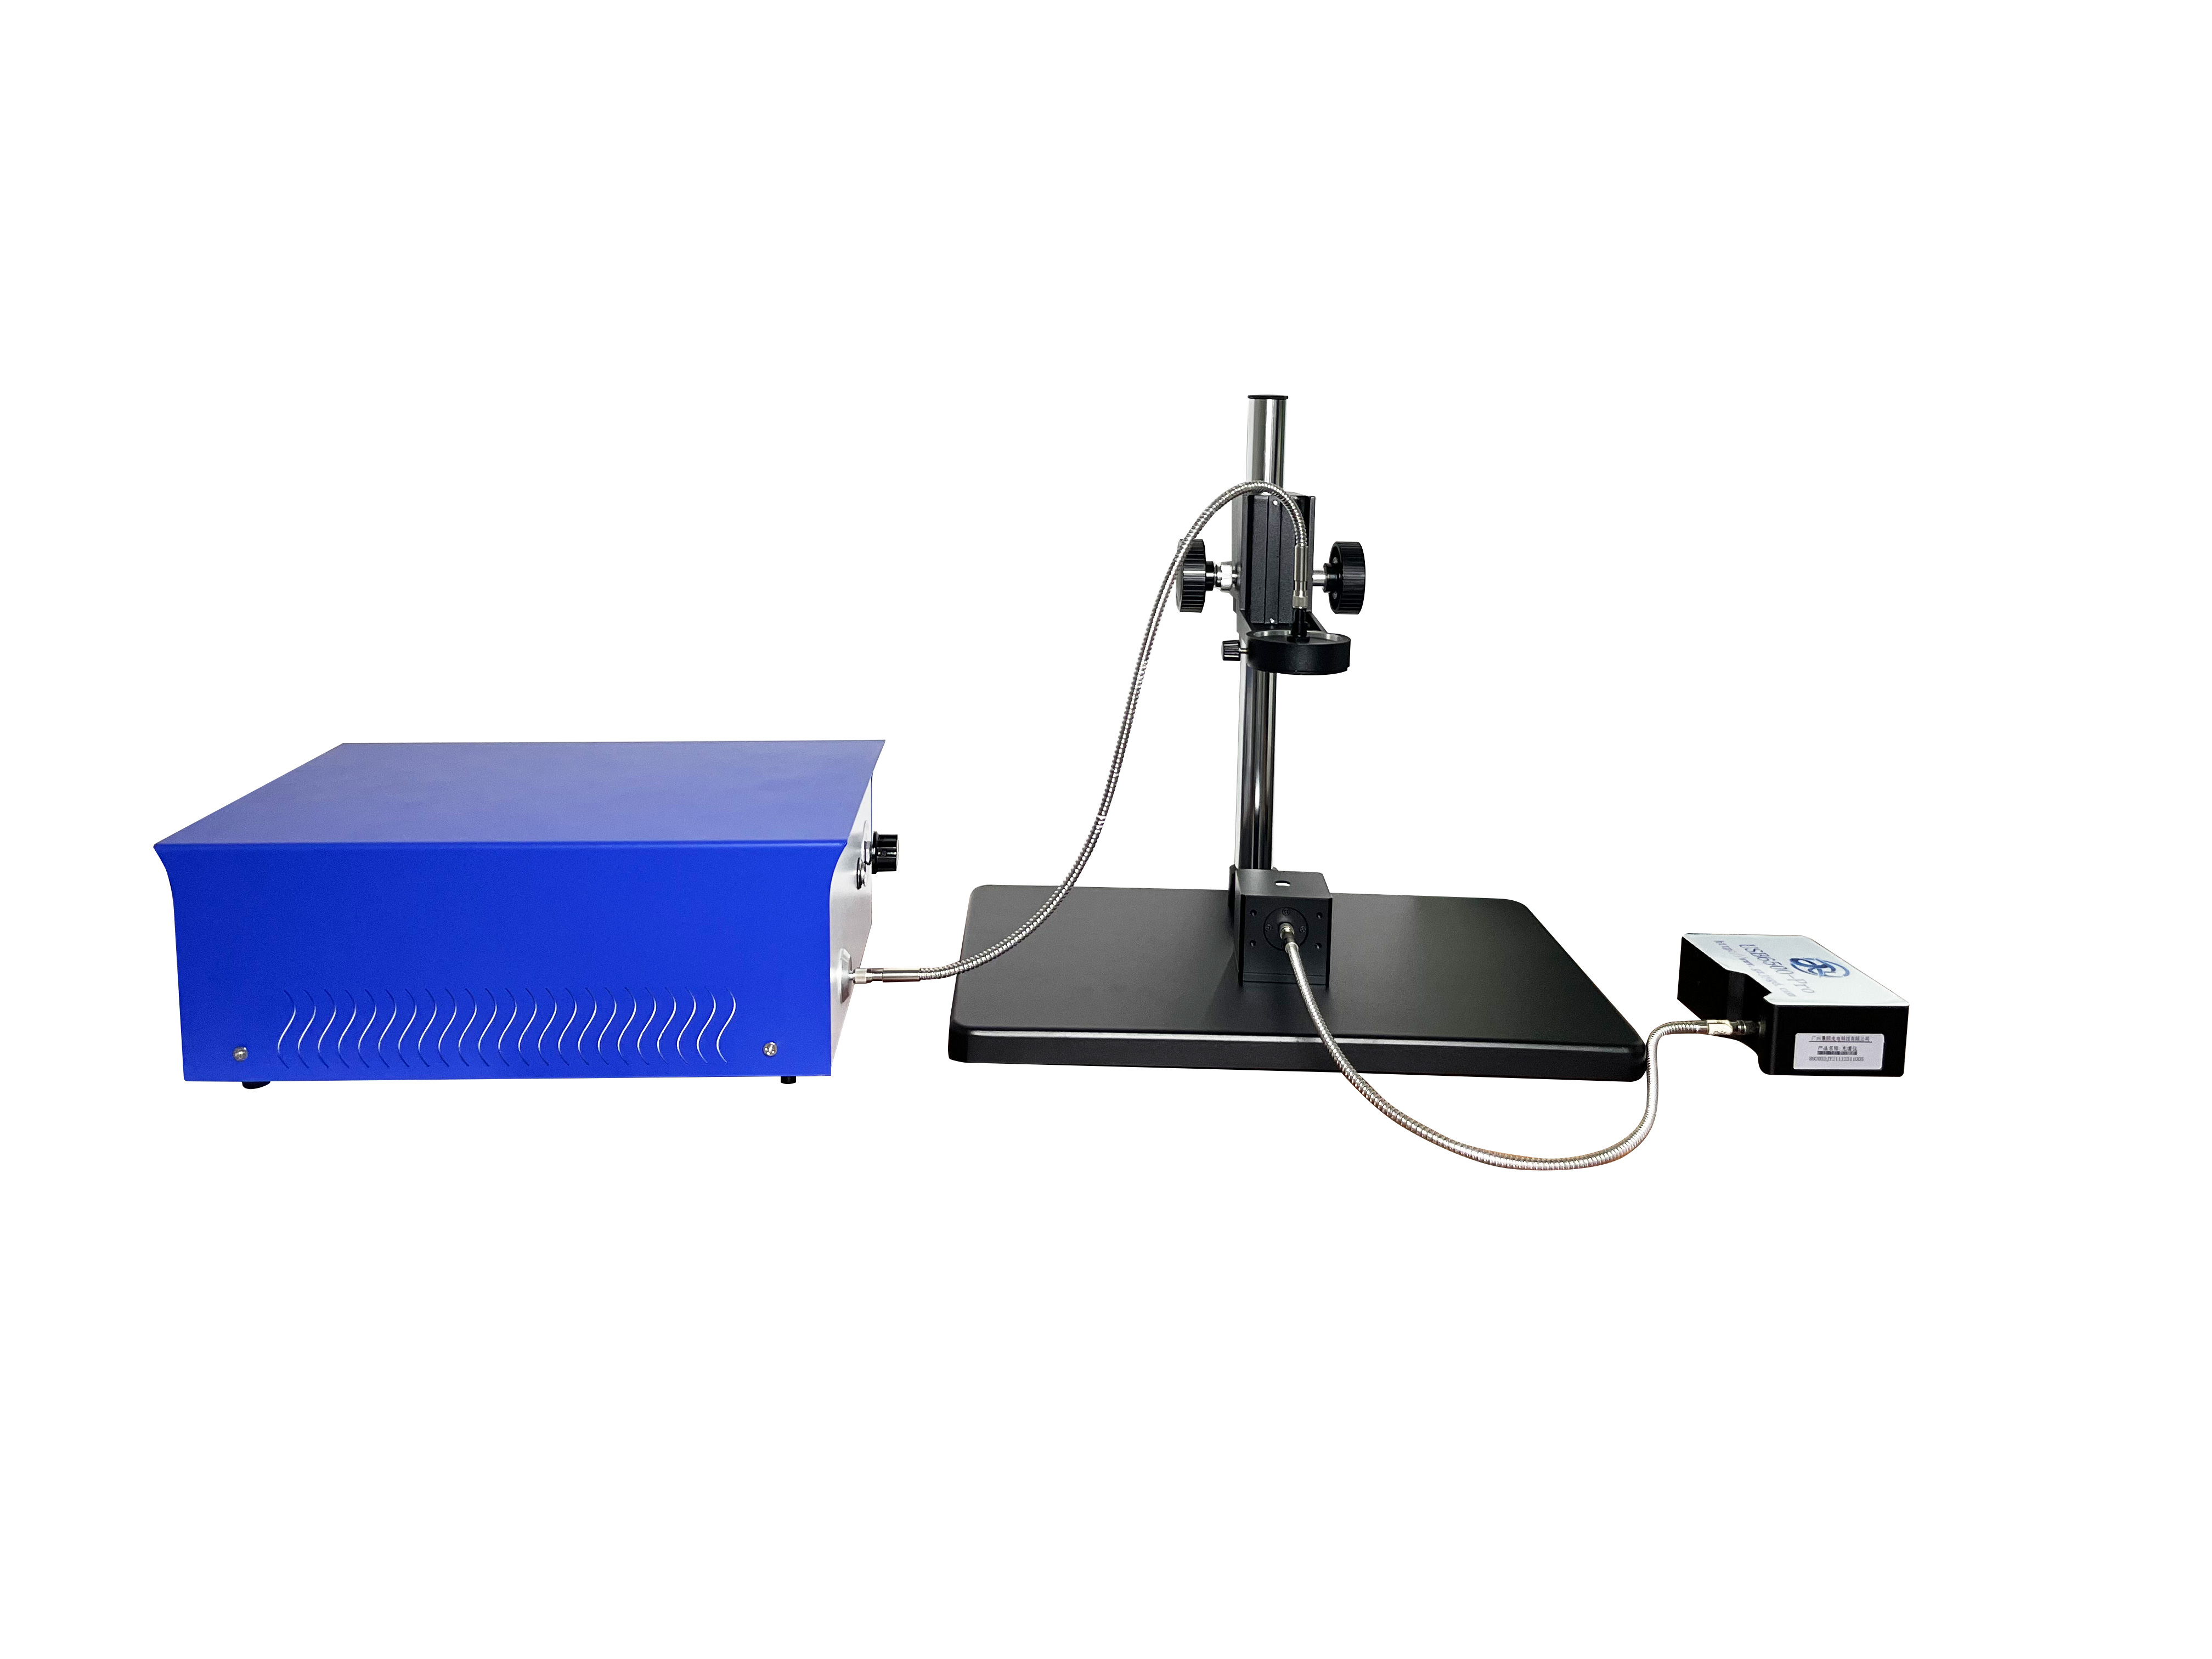
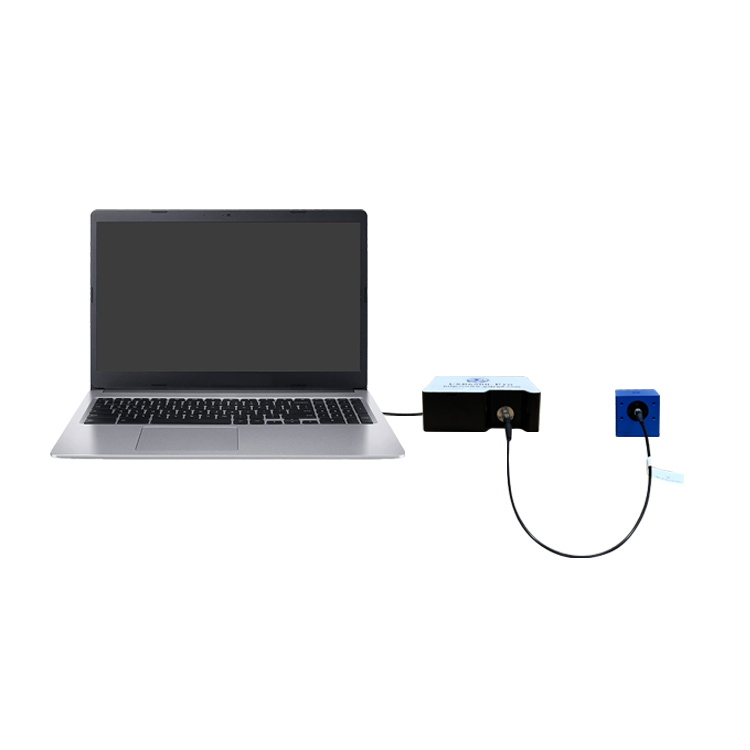
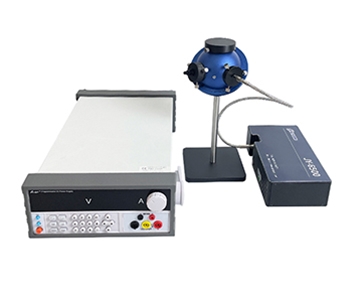
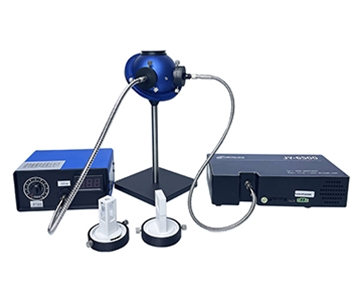
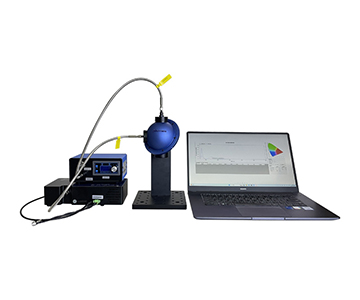
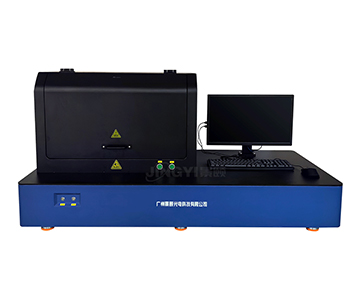
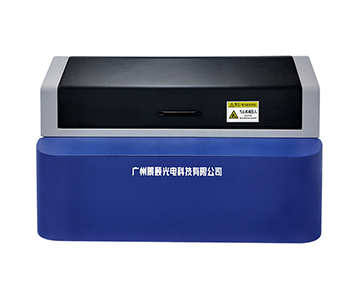
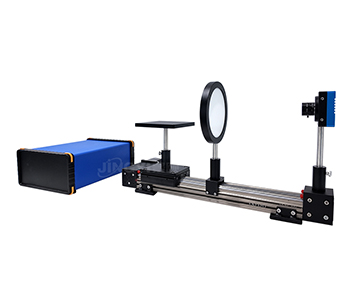
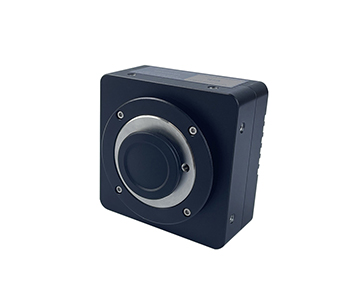
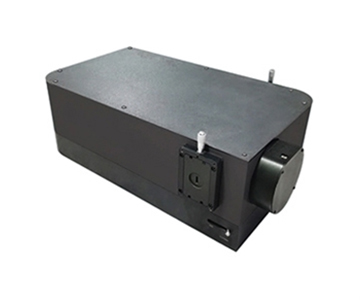
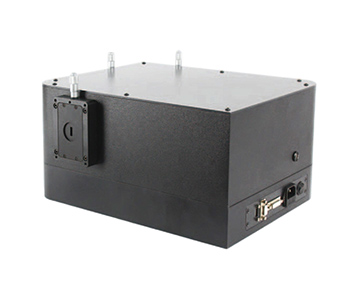
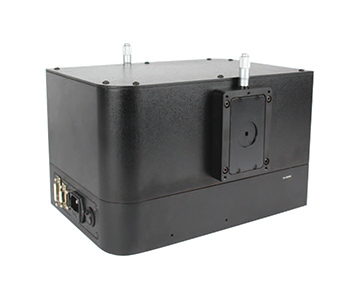
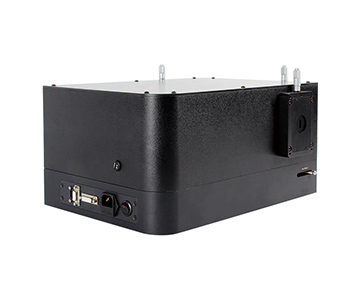
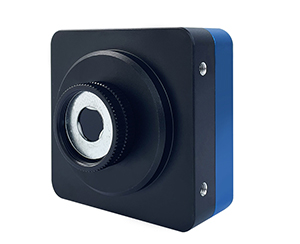
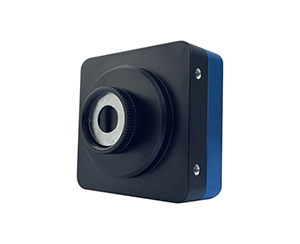
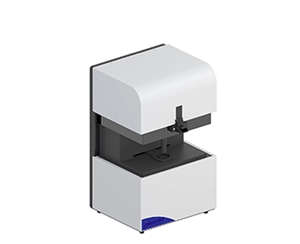
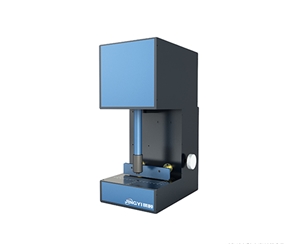
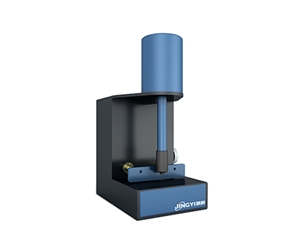
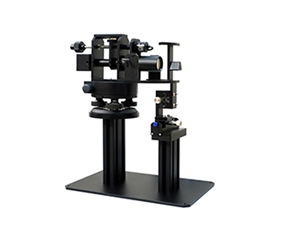
Spectrometer baseline drift on a pharmaceutical packaging line can shift peak positions by 0.37 nm within a single shift, directly threatening batch yield. Cooled spectrometers with thermoelectric detector control, low-noise readout, and wide spectral coverage mitigate this by reducing dark current 1–2 orders of magnitude, achieving signal-to-noise ratios up to 10000:1 and dynamic range to 50000:1. This guide dissects seven engineering variables—spectral range, pixel matching, integration time, slit width, bit depth, trigger synchronization, and thermal stability—and compares three price tiers from $8K to $50K+. It includes a four-step proof-of-concept validation protocol, a 10-question procurement checklist, and an operator ergonomics review to translate datasheet claims into failure-mode protection for process lines in petrochemical, pharmaceutical, and reflectance measurement applications.
The Datasheet Gap: Why "Pretty Numbers" Fail on the Production Floor
During an overnight shift at a contract manufacturing site, a process engineer noticed sudden spectral baseline drift. The first instinct was not to tweak the algorithm but to re-examine the equipment parameters: the quoted SNR looked impressive, resolution was attractive, and integration time seemed flexible. Yet when the same batch was retested on the line, peak positions drifted by 0.37 nm consecutively.
This gap between laboratory specifications and field performance is common in spectrometer procurement. One economy-tier domestic supplier listed detector response range as the operational wavelength band. An import benchmark brand移植ed SNR measured in a climate-controlled lab directly onto its production brochure. Cryogenic cooling was often advertised simply as "coolable," without disclosing the stable setpoint or power budget.
The problem compounds when platforms are confused. A 200–1100 nm silicon CCD system, a 900–1700 nm InGaAs array, and a 900–2500 nm extended-range unit may all be marketed as "fiber optic spectrometers," but their detector materials, gratings, slits, A/D bit depth, and trigger modes differ fundamentally. Selecting the wrong tier means spending capital on a wavelength region that cannot support the application.
Evaluating only the datasheet makes every unit look like a high-resolution spectrometer. In reality, yield is determined by how resolution and throughput trade off when the slit is changed, whether integration time can fit within the line takt, and whether dark noise actually drops when cooling is enabled. This article does not rank brands. It breaks down seven engineering variables and places candidate platforms into a single comparison framework for objective decision-making.
Seven Selection Dimensions: Mapping Specs to Operating Conditions
1. Spectral Range: Lock the Band First
Selecting the wrong wavelength band invalidates every other parameter. Four practical coverage tiers exist: 180–1100 nm silicon-based wide spectrum, 200–850 nm or 400–1100 nm standard CCD, 900–1700 nm short-wave near-infrared, and 900–2500 nm extended near-infrared.
For plastic transmittance, LED color, fluorescence, and reflectance tasks spanning UV-Vis to short-wave NIR, the 180–1100 nm or 200–1100 nm range suffices. For moisture, sugar content, pharmaceutical ingredients, and petrochemical process monitoring, the wavelength must extend beyond 900 nm, requiring an InGaAs detector platform.
A frequent pitfall: detector response range and usable spectral band after dispersion are not identical. A platform may claim detector response to 1100 nm, but the grating configuration only covers to 1000 nm. Procurement should require the supplier to provide a report based on the actual grating and slit combination.
2. Pixel Size and Spot Matching: Containing the Light
The pixel height of linear CCD or InGaAs arrays determines the matching window with fiber core diameter and incident spot. Common specifications include 25×250 μm, 25×500 μm, 50×500 μm, 24×24 μm, and 8×200 μm.
When using a 600 μm multimode fiber for weak light collection, a pixel height of 500 μm captures more photons than 250 μm. However, excessive pixel height reduces spatial resolution; for high-resolution applications, smaller pixels are preferred.
Rule of thumb: if the spot diameter significantly exceeds pixel height, signal overflow and crosstalk increase. If the spot is much smaller than pixel height, throughput is wasted and SNR suffers.
3. Integration Time and Line Takt: Fastest Is Not Always Stable
Integration time spans vary widely: near-infrared high-speed tiers offer 0.1 ms–100 ms, standard CCD 1 ms–65 s, back-illuminated CCD 6 ms–10000 ms, cooled near-infrared 7.8 ms–64 s, and cooled CCD 2 ms–130 s.
Production takt must be reverse-calculated. If a conveyor passes three items per second, the single acquisition window is roughly 333 ms. After accounting for trigger delay, data transfer, and algorithm execution, integration time must be compressed to the tens of milliseconds.
Conversely, Raman, fluorescence, and weak absorption signals require second- or minute-level integration to achieve usable SNR. In these cases, the priority is whether cooling can suppress dark current, not chasing "fastest 1 ms" claims.
4. Slit Width: The Resolution-Throughput Trade-off
The slit is a replaceable core variable, with common widths of 5, 10, 25, 50, 100, 200 μm, and up to 300 μm for near-infrared tiers.
For a 180–1100 nm, 3648-pixel platform: a 200 μm slit yields 5.33 nm resolution, 100 μm gives 2.66 nm, 50 μm 1.48 nm, and 25 μm or 10 μm both achieve 0.91 nm. Pushing resolution from 5 nm to below 1 nm drastically reduces throughput, forcing longer integration times.
Buyers should not ask "what is the highest resolution?" but "what is the actual FWHM at my required band and slit width?"
5. Bit Depth and Dynamic Range: 16-bit vs. 18-bit
Standard CCD platforms typically use 16-bit A/D conversion, while cooled platforms offer 18-bit at 570 kHz or 500 kHz sampling. Near-infrared high-speed tiers use 16-bit; cooled near-infrared tiers have shown labeling inconsistencies in documentation—always verify against the factory calibration report.
Bit depth directly determines whether weak peaks can be distinguished from background noise. In absorbance, reflectance, and thin-film interference measurements that span multiple orders of magnitude, the two extra bits of an 18-bit system often decide if a terminal peak is signal or noise.
Dynamic range must be considered together: cooled CCD platforms claim up to 50000:1, standard CCD platforms typically 350:1 to 450:1, and near-infrared platforms can reach 10000:1. These figures are not directly cross-comparable but indicate platform positioning.
6. Interface and Trigger Synchronization: Hidden Hurdles for Line Integration
Interfaces are predominantly USB 2.0, with some near-infrared miniature units using Type-C or UART. Cooled CCD tiers may add a 20-pin dual-row programmable expansion port.
Trigger modes deserve scrutiny: only systems supporting software, hardware, and synchronous triggering can interface with PLC pulses for inline sampling. Devices limited to software trigger suffer from sampling timing drift on high-speed lines; repeatability data may look good in isolation, but batch-to-batch alignment fails.
Optical input should prioritize SMA905 fiber connectors; if free-space incidence is needed, confirm whether a free-space port is available.
7. Mechanical Stability and Thermal Drift: Cooling Is Not a Panacea
Cooling suppresses detector dark current. Cooled near-infrared platforms claim stable temperature at -20°C, reducing dark current by 1–2 orders of magnitude. Cooled CCD documentation cites both -15°C and -20°C; buyers must obtain written confirmation of the stable setpoint before ordering.
However, thermal drift is not limited to the detector. Thermal expansion of the grating, slit, and mirrors causes peak shift. Wavelength temperature stability is typically ±0.05 nm to ±0.1 nm—a figure more critical for long-term online retesting than static resolution.
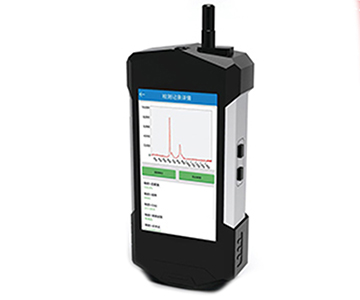
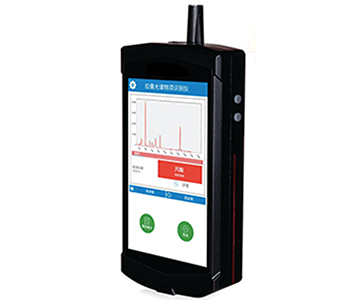
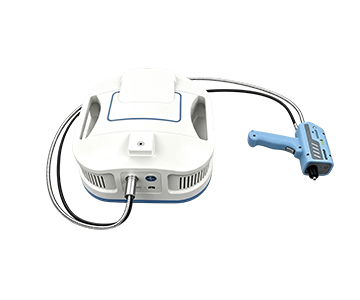
Mechanically, dimensions and weight vary: portable CCD units can be 80×40×115 mm and 500 g; near-infrared miniature units 102×58×39 mm; cooled units reach 146×115×47 mm at 840 g, or even 217×110×52 mm at 1.65 kg. Before integration, map the installation space and thermal dissipation margin.
Candidate Platforms: Three Price Tiers Compared
The import benchmark tier is listed as "data not covered" because this evaluation is restricted to local documentation; for genuine import comparison, request same-caliber reports from suppliers.
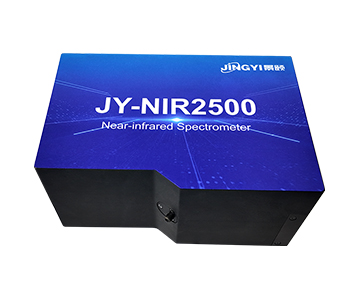
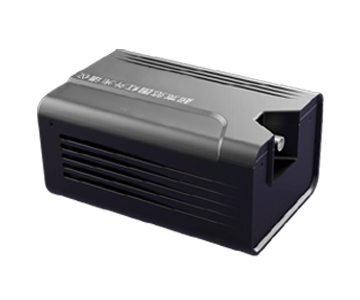
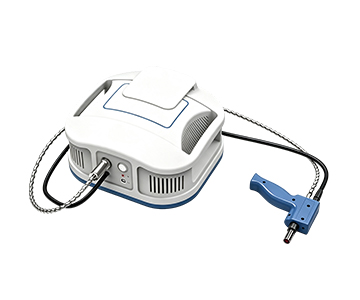
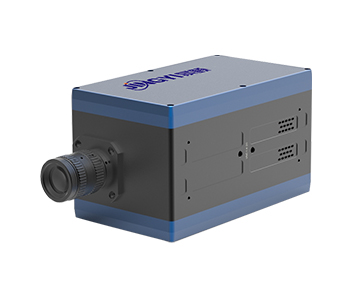
Domestic mainstream tier (cooled/high-pixel platforms) key figures: cooled CCD with 1044×64 pixels, 18-bit AD, dynamic range 50000:1, dark noise 8e-, integration 2 ms–130 s; cooled near-infrared with InGaAs 256/512 pixels, 900–2500 nm, -20°C恒温, SNR 10000:1, integration 7.8 ms–64 s. These two platforms cover weak-light detection and short-wave NIR applications.
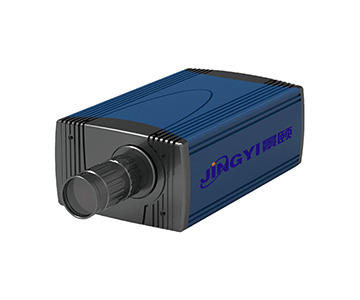
Domestic economy tier uses 2048-pixel linear CCD, 16-bit AD, 1 ms–65 s integration, linearity >99.8%, stray light <0.1% at 600 nm, size 80×40×115 mm, 500 g. Suitable for LED sorting, color measurement, absorbance, and trans-reflectance where极限 SNR is not required.
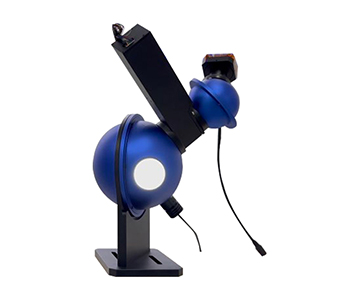
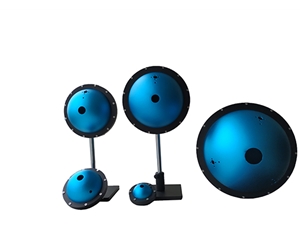
From a total cost of ownership perspective, three accounts must be balanced: unit price, supporting accessories (light sources, fibers, integrating spheres), and long-term calibration and repair. Import tiers carry higher unit costs and cross-border repair cycles; domestic tiers are cheaper but require wavelength accuracy and temperature stability to be written into acceptance contracts.
For reference, Avantes—an early player in miniature fiber spectrometers—commands a 1.5× to 2× price premium over domestic mainstream equivalents, with high-end model repairs in the Netherlands taking 3–6 weeks. Sarspec offers modular slit-interchangeable designs at 20%–30% lower price than Avantes, but lacks direct mainland China service, with parts lead times of 2–4 weeks. In continuous operation scenarios, after-sales response speed often outweighs datasheet superiority.
| Comparison Dimension |
Import Benchmark (Reference) |
Domestic Mainstream (Cooled/High-Pixel) |
Domestic Economy (Standard CCD) |
| Typical Band |
Deep UV-NIR, strong customization |
180–1100 nm / 900–2500 nm |
200–850 nm / 400–1100 nm |
| Detector |
Data not covered, request from mfg. |
Back-illuminated CCD 1044×64, InGaAs 256/512 |
Linear CCD 2048 pixels |
| Resolution |
Data not covered |
0.01–4 nm (depends on slit/band) |
Min 0.3 nm |
| Integration Time |
Data not covered |
2 ms–130 s / 7.8 ms–64 s |
1 ms–65 s |
| A/D Bit Depth |
Data not covered |
18-bit |
16-bit |
| Dynamic Range / SNR |
Data not covered |
50000:1 / 10000:1 |
SNR 350:1 |
| Trigger |
Data not covered |
Hardware/software, UART/expansion |
Not specified, confirm |
| Delivery & Support |
Long repair cycle, cross-border parts |
Fast domestic response, OEM customization |
Low price, limited customization |
Price mapping for international buyers: Domestic economy ≈ $8K–$12K class; Domestic mainstream ≈ $18K–$30K class; Import benchmark ≈ $40K–$60K+ class.
Operator Ergonomics: When Specs Meet Human Workflow
Many selection reviews focus exclusively on technical指标, ignoring that the equipment is operated daily by technicians. Misaligned ergonomics can cause even impressive parameters to be bypassed in practice.
The first high-frequency action is slit replacement. If changing slits requires disassembly and optical realignment, operators will lock into a single slit width, effectively halving the instrument's capability. Prioritize structures with quick-swap slits and indexed positions.
The second action is trigger wiring. If hardware trigger interfaces are limited to solder terminals without standard BNC or TTL connectors, field electricians may miswire, causing sampling misalignment with PLC pulses. Request the supplier's trigger timing diagram—it is more useful than the line "supports hardware trigger."
The third action is software reset. Cooled units require time to stabilize at -15°C or -20°C. If the warm-up exceeds operator patience, frequent power cycling will occur, accelerating thermal cycling fatigue. Clarify stabilization time and codify it in the SOP.
The fourth action is data export. Software that exports only proprietary formats forces operators to write workaround scripts, increasing error rates. Demand simultaneous SDK/API access, with export fields including wavelength, counts, integration time, and slit identifier.
Validating these operational paths with actual operators during the POC phase costs far less than post-deployment training remediation.
POC Validation: Four Steps to Stress-Test Datasheet Claims
Step 1: Wavelength accuracy retest.
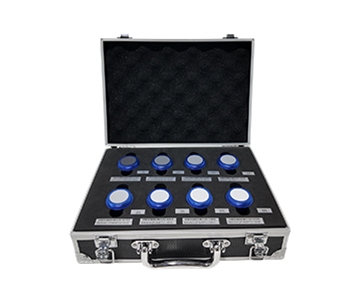
Use mercury or neon lamp characteristic peaks for three-point calibration. For 200–1100 nm units, use 253.7 nm, 546.1 nm, and 696.5 nm. For 900–1700 nm, use characteristic absorption peaks. Compare against manufacturer claims of ±0.05 nm to ±0.3 nm; deviations beyond tolerance result in immediate rejection.
Step 2: SNR and dark noise separation.
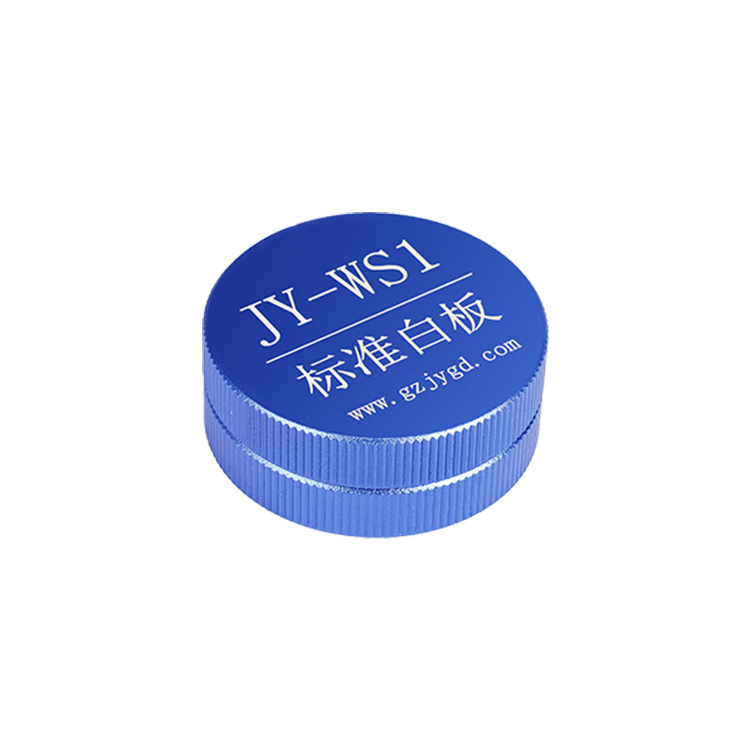
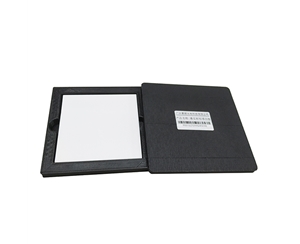
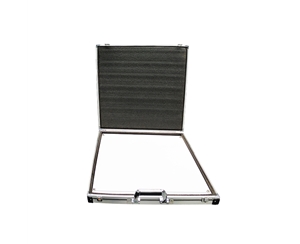
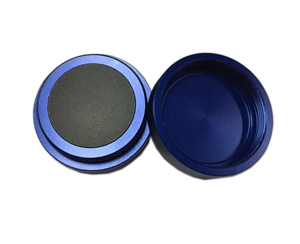
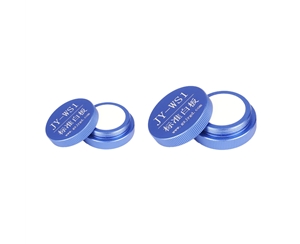
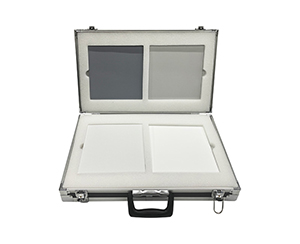
With the input blocked, acquire 100 consecutive frames and calculate dark noise RMS. Then measure a standard reflectance panel at full scale. SNR must be reported at fixed integration time, fixed slit, and fixed temperature—never copy the brochure number without these conditions.
Step 3: Temperature cycle drift.
Place the unit in a thermal chamber, cycle from -10°C to 45°C and back, and record peak shift. Published wavelength temperature stability is ±0.05–±0.1 nm; exceeding this after cycling indicates inadequate optomechanical thermal compensation.
Step 4: Takt pressure test.
Interface with PLC hardware trigger at actual line speed, run 5000 consecutive samples, and tally frame drops, USB buffer overflows, and trigger jitter. This step most effectively exposes devices with attractive specs but poor integration robustness.
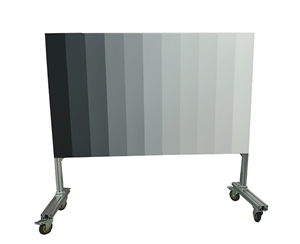
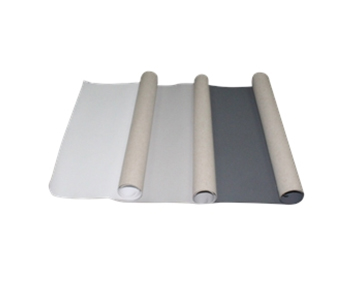
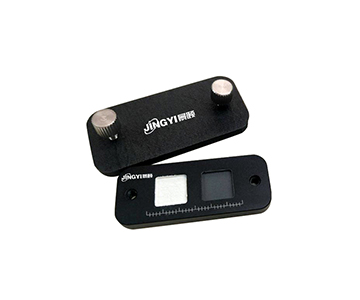
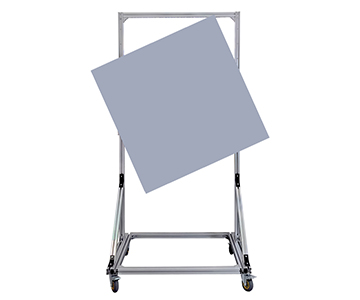
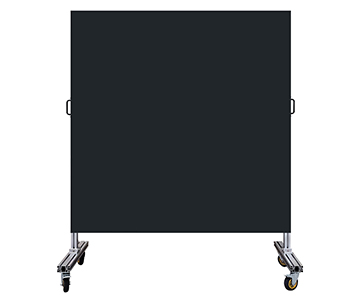
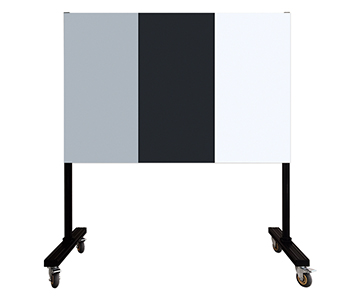
For production lines involving plastic transmittance and reflectance, adopt ASTM D1003 or equivalent ISO 13468 as acceptance criteria during POC. Use standard reference plaques to compare total transmittance and reflectance readings, avoiding the trap of measuring only spectral output without traceability to finished-part metrics.
10-Point Procurement Checklist
1.Is the usable band specified by grating+slit combination, or merely by detector response range?
2.What is the pixel size, and does it match my intended fiber core diameter?
3.What is the measured FWHM at the target slit—not the theoretical best resolution?
4.Can the minimum integration time be compressed to within 1/3 of the line takt?
5.Is A/D bit depth 16-bit or 18-bit, and what is the sampling rate in kHz?
6.At what integration time and temperature were dynamic range and SNR measured?
7.What is the stable cooling setpoint (-15°C or -20°C), and how long does stabilization take from power-on?
8.Does the trigger mode include hardware TTL/BNC, and can it interface with existing PLCs?
9.Beyond USB 2.0, are UART or expansion I/O available, and is the SDK open?
10.Can factory calibration reports for wavelength accuracy and temperature stability be provided with shipment?
Five Common Selection Mistakes
Mistake 1:
Treating detector response range as operational band. Using a silicon CCD with 1100 nm cutoff to measure a 1200 nm moisture peak places the entire signal in the noise floor.
Mistake 2:
Prioritizing maximum resolution over corresponding throughput. Pushing slit width to 10 μm for 0.3 nm resolution forces integration into seconds, causing line stoppage.
Mistake 3:
Assuming cooling solves everything. Cooling only the detector while ignoring optomechanical thermal control still allows peak drift with 5°C ambient fluctuations.
Mistake 4:
Overlooking trigger timing. Software trigger under high PC load drops sampling points; batch data appears complete but the time axis misaligns.
Mistake 5:
Single-point acceptance testing. Beautiful data on installation day means nothing if baseline drift after two weeks goes unmonitored. Write the four-step POC method into acceptance contracts instead of merely signing "meets specification sheet."
Honest Limitations and Trade-offs
Domestic mainstream tiers offer advantages in band coverage, delivery cycle, and OEM customization, but boundaries exist: cooled units are significantly larger and power-hungry compared to non-cooled equivalents. A 1.65 kg, 5V/2.3A power profile becomes a burden in portable scenarios. InGaAs platforms reaching 2500 nm typically offer only 256 or 512 pixels, resulting in lower sampling density for high-resolution long-wave tasks compared to silicon 3648-pixel platforms.
Additionally, some parameters in available documentation show version discrepancies—for example, A/D bit depth for cooled near-infrared tiers is inconsistently labeled between text and tables, and cooling setpoints appear as both -15°C and -20°C. Such details cannot be decided from brochures; factory calibration reports and written technical agreements are mandatory.
Import tiers excel in long-term consistency documentation and global calibration traceability, but at higher price and longer service cycles. Domestic tiers reverse these strengths and weaknesses. Selection is not about choosing "better," but about ensuring that under your specific operating conditions, the weaknesses are not fatal.
Frequently Asked Questions
Q1: How can I tell if a quoted SNR has been inflated?
Verify three accompanying conditions: integration time, slit width, and detector temperature. SNR without all three is not comparable. On-site, calculate RMS from blocked dark frames and measure full-scale with a standard reflectance panel to recompute independently.
Q2: How to choose between 180–1100 nm and 200–1100 nm?
Determine whether you need the 180–200 nm deep-UV region. If measuring ozone, certain UV absorption, or deep-UV fluorescence, select the 180–1100 nm silicon platform. For visible to short-wave NIR work, the 200–1100 nm dual-blaze grating option is more economical, with resolution starting at 0.3–0.5 nm.
Q3: Which parameter should be confirmed first for line integration?
Trigger method and minimum integration time. Software trigger is insufficient for high-speed lines; hardware TTL or synchronous trigger is mandatory. Integration time must fit within 1/3 of the takt to leave margin for transfer and algorithms.
Q4: When is the premium for a cooled unit justified?
Three scenarios: weak light, long integration, and cross-temperature-zone retesting. Cooling reduces dark current by 1–2 orders of magnitude, making it essential for Raman, fluorescence, trace absorbance, and field sites with large day-night temperature swings where non-cooled units cannot stabilize baselines.
Q5: How can I independently verify that delivered equipment meets its specifications?
Require the manufacturer to provide factory calibration reports for wavelength accuracy, temperature stability, and dark noise with shipment. Upon arrival, perform self-checks using standard lamp characteristic peaks, blocked dark frames, and thermal chamber cycling. If any metric exceeds the report range, invoke contract acceptance clauses.
Conclusion
Spectrometer selection has no universal optimum—only process-matched fitness. Rank spectral range, pixel size, slit, integration, bit depth, trigger, and thermal control according to your line takt and signal strength before comparing price tiers. This approach outperforms brand-ranking methods.
Procurement decisions ultimately translate datasheet parameters into failure modes: whichever parameter, if wrong, would h
For detailed specifications and application notes on cooled spectrometers and near-infrared spectroscopy systems, search "Jingyi Optoelectronics + cooled spectrometer" or visit the technical library.
About This Guide
Data Sources:
Local product documentation and publicly available technical files; third-party references include SEMI annual reports, China Optical Society technical white papers, customer-authorized test data, and GB/T national standards (e.g., GB/T 47066-2026).
Author:
Cai Xiaodong, Senior Application Engineer, Jingyi Optoelectronics, 12 years in optical metrology and industrial precision measurement equipment.
Disclosure:
Jingyi Optoelectronics manufactures cooled spectrometers and related optical measurement systems. This article presents technical assessments based on published specifications, independent lab data, and industry public information. No compensation was received from third-party brands mentioned.
Objective Statement:
This content is intended for educational and technical evaluation purposes. Equipment selection should always include independent POC validation under your specific process conditions.
Last Updated:
November 2026