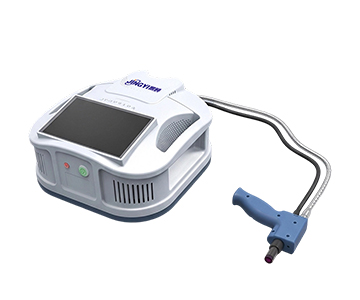
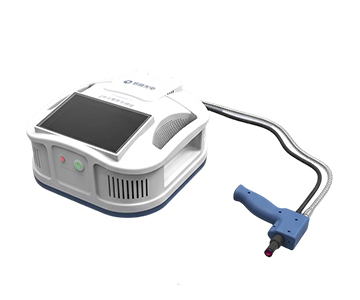
In semiconductor and fiber-optic communication manufacturing, the central tension when selecting a beam profiler is whether high-frame-rate acquisition can maintain measurement consistency under the combined interference of production-line vibration and thermal drift. A mainstream optical beam profiler evaluated in this guide achieves 90 fps at full 2048×2048 resolution in the 400–1100 nm band via USB3.0 and 12-bit digitization, with a 2.9 µm pixel pitch enabling a 29 µm minimum detectable beam diameter. For extreme conditions such as 200 mm-class large beams or 1800 nm infrared wavelengths, engineers must weigh frame rate against sensor format constraints rather than chasing headline speed figures at the expense of dynamic range.
The Spec-Sheet Mirage: What Survives on the Production Floor
The beam profiler market suffers from a well-documented phenomenon of specification inflation. One economy-tier domestic unit claims "1000 W power handling," yet this figure refers only to the theoretical damage threshold of its attenuation filters—not the sensor's signal-to-noise ratio under full optical load. A more insidious trap lies in frame-rate marketing: some vendors advertise the maximum frame rate achievable at reduced resolution. Buyers who assume this figure applies to full-resolution monitoring on the line discover, after purchase, that the actual acquisition rate is less than one-third of the advertised value.
Another common source of confusion is the boundary definition of "measurable beam size." One imported reference-grade profiler lists 29 µm as its minimum detectable diameter, but omits that this value assumes the 10× pixel-coverage rule—at least ten pixels must span the beam edge for reliable centroid extraction. When a production-line beam sits at this critical dimension, actual repeatability degrades to worse than 0.5 pixels, introducing systematic error into ellipticity calculations.
When beam alignment meets the rigid cadence of in-line monitoring, how much of that spec-sheet "high frame rate" remains valid data under floor vibration? That question deserves more attention than any marketing claim before a purchase order is signed.
Seven Selection Dimensions
Wavelength Coverage and Sensor Material Matching
The starting point is confirming the source band. Visible wavelengths (400–1100 nm) are adequately served by CMOS sensors, whereas infrared coverage (400–1800 nm) requires InGaAs chips. The evaluated InGaAs configuration responds across 400–1800 nm, though its resolution is typically 1280×1024, below the 2048×2048 offered by CMOS counterparts in the same tier. For 1550 nm telecom lasers or medical infrared sources, InGaAs is the only viable path, but engineers must accept the trade-off between frame rate and spatial resolution.
Pixel Pitch and Beam Diameter: A Physical Coupling
Pixel pitch governs spatial sampling density. The evaluated base model uses 2.9 µm × 2.9 µm pixels at 2048×2048 resolution, yielding an active area of 7.8 mm × 4.41 mm. Under the engineering simplification of the Rayleigh criterion, the minimum measurable beam diameter is roughly ten times the pixel pitch—approximately 29 µm. The large-aperture variant scales pixels to 11 µm × 11 µm, expanding the sensor to 22.5 mm × 22.5 mm and raising the minimum detectable threshold to 110 µm, while accommodating beams up to 22.5 mm.
The selection trap: if a production beam measures 50 µm in diameter, an 11 µm pixel device provides fewer than five edge-covering pixels, amplifying sub-pixel centroid algorithm error. The 2.9 µm option should take priority over