Industrial spectral transmittance measurement demands wavelength coverage from UV through near-IR (360 nm–2,500 nm), repeatability below 1%, and sub-second cycle times to sustain production yield. This validation report documents side-by-side qualification data from four live manufacturing lines—optical coatings, photovoltaic glass, plastic laser welding, and fiber-optic light guides—comparing a $25K-class domestic precision system against incumbent $100K+ imported references. Key findings: 0.04% deviation at 940 nm versus the reference, throughput gains of 3×, and critical detection of gradient defects in the 900–980 nm band that single-wavelength point gauges missed entirely.
The Incident That Triggered This Study
During a night shift in Q3, an East Asian optical component manufacturer faced a $152,000 scrap event. A batch of AR-coated lenses destined for automotive LiDAR receivers failed downstream signal-to-noise ratio checks. Root cause: transmittance at 940 nm had drifted 0.3 percentage points beyond the process window. The existing single-wavelength point gauge never flagged the issue because it could not resolve the gradual transmittance decay curve across the 900–980 nm band edge.
This was not an isolated failure. Across the spectral metrology landscape, three persistent barriers constrain equipment selection: core-component import dependency, unverified long-term stability under factory-floor thermal load, and misalignment between standard test protocols and proprietary process requirements. When a line shifts from sampling inspection to 100% in-line checking, and from single-point to full-spectrum scanning, the purchase decision becomes an engineering bet on whether the process database will converge.
We tested four systems across live production environments to answer one question: how far can a domestic spectral transmittance measurement system go on an actual factory floor?
Validation Methodology: Five Control Elements
Sample and Environmental Baseline
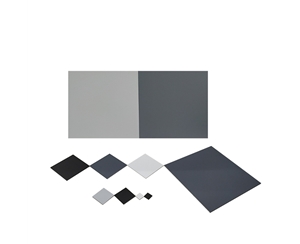
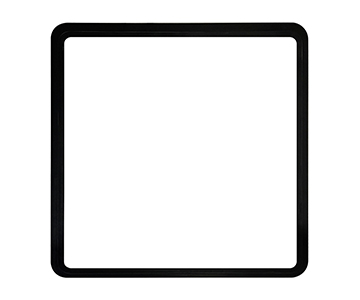
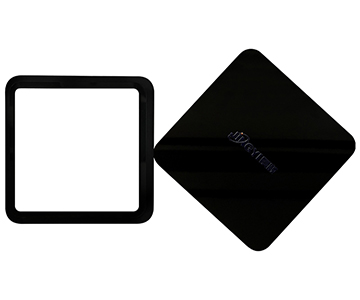
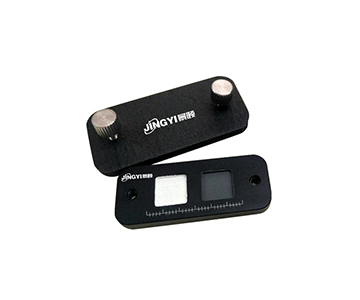
Four sample groups were qualified: AR-coated optical lenses (φ30 mm planar glass), 3.2 mm ultra-white patterned photovoltaic glass, PA66 + glass-fiber laser-welded plastic cooling lines (2.5 mm wall thickness), and fiber-optic light guides (5 mm core, 300 mm length). All specimens equilibrated for 48 hours at 23 °C ± 2 °C and 50% ± 5% RH. Measurement points avoided the 10 mm edge exclusion zone.
Instrument Parameters and Error Traceability
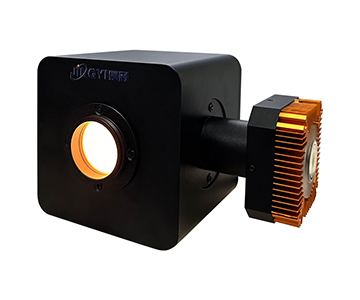
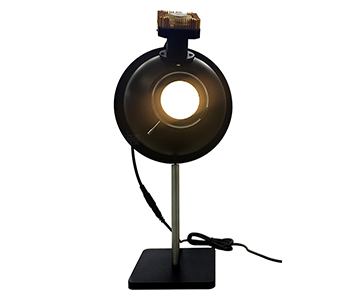
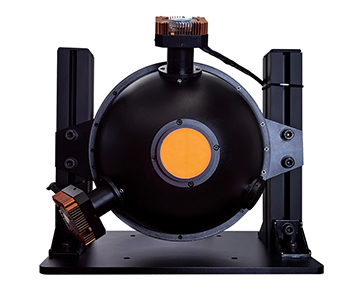
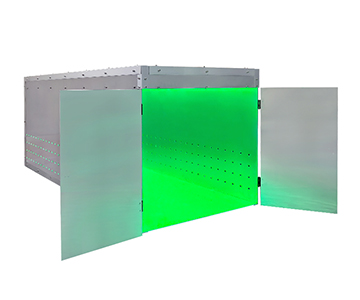
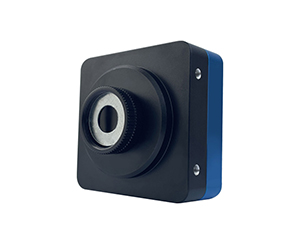
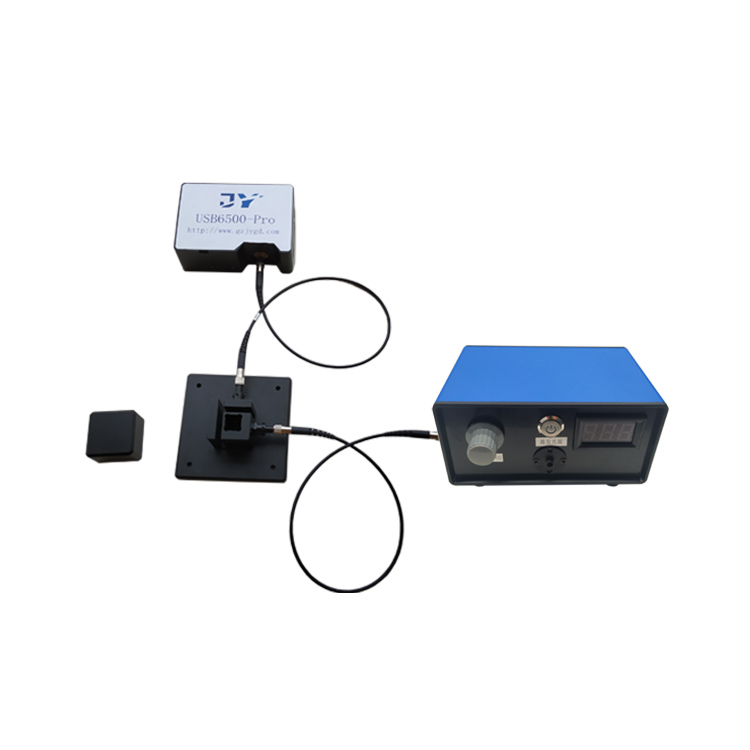
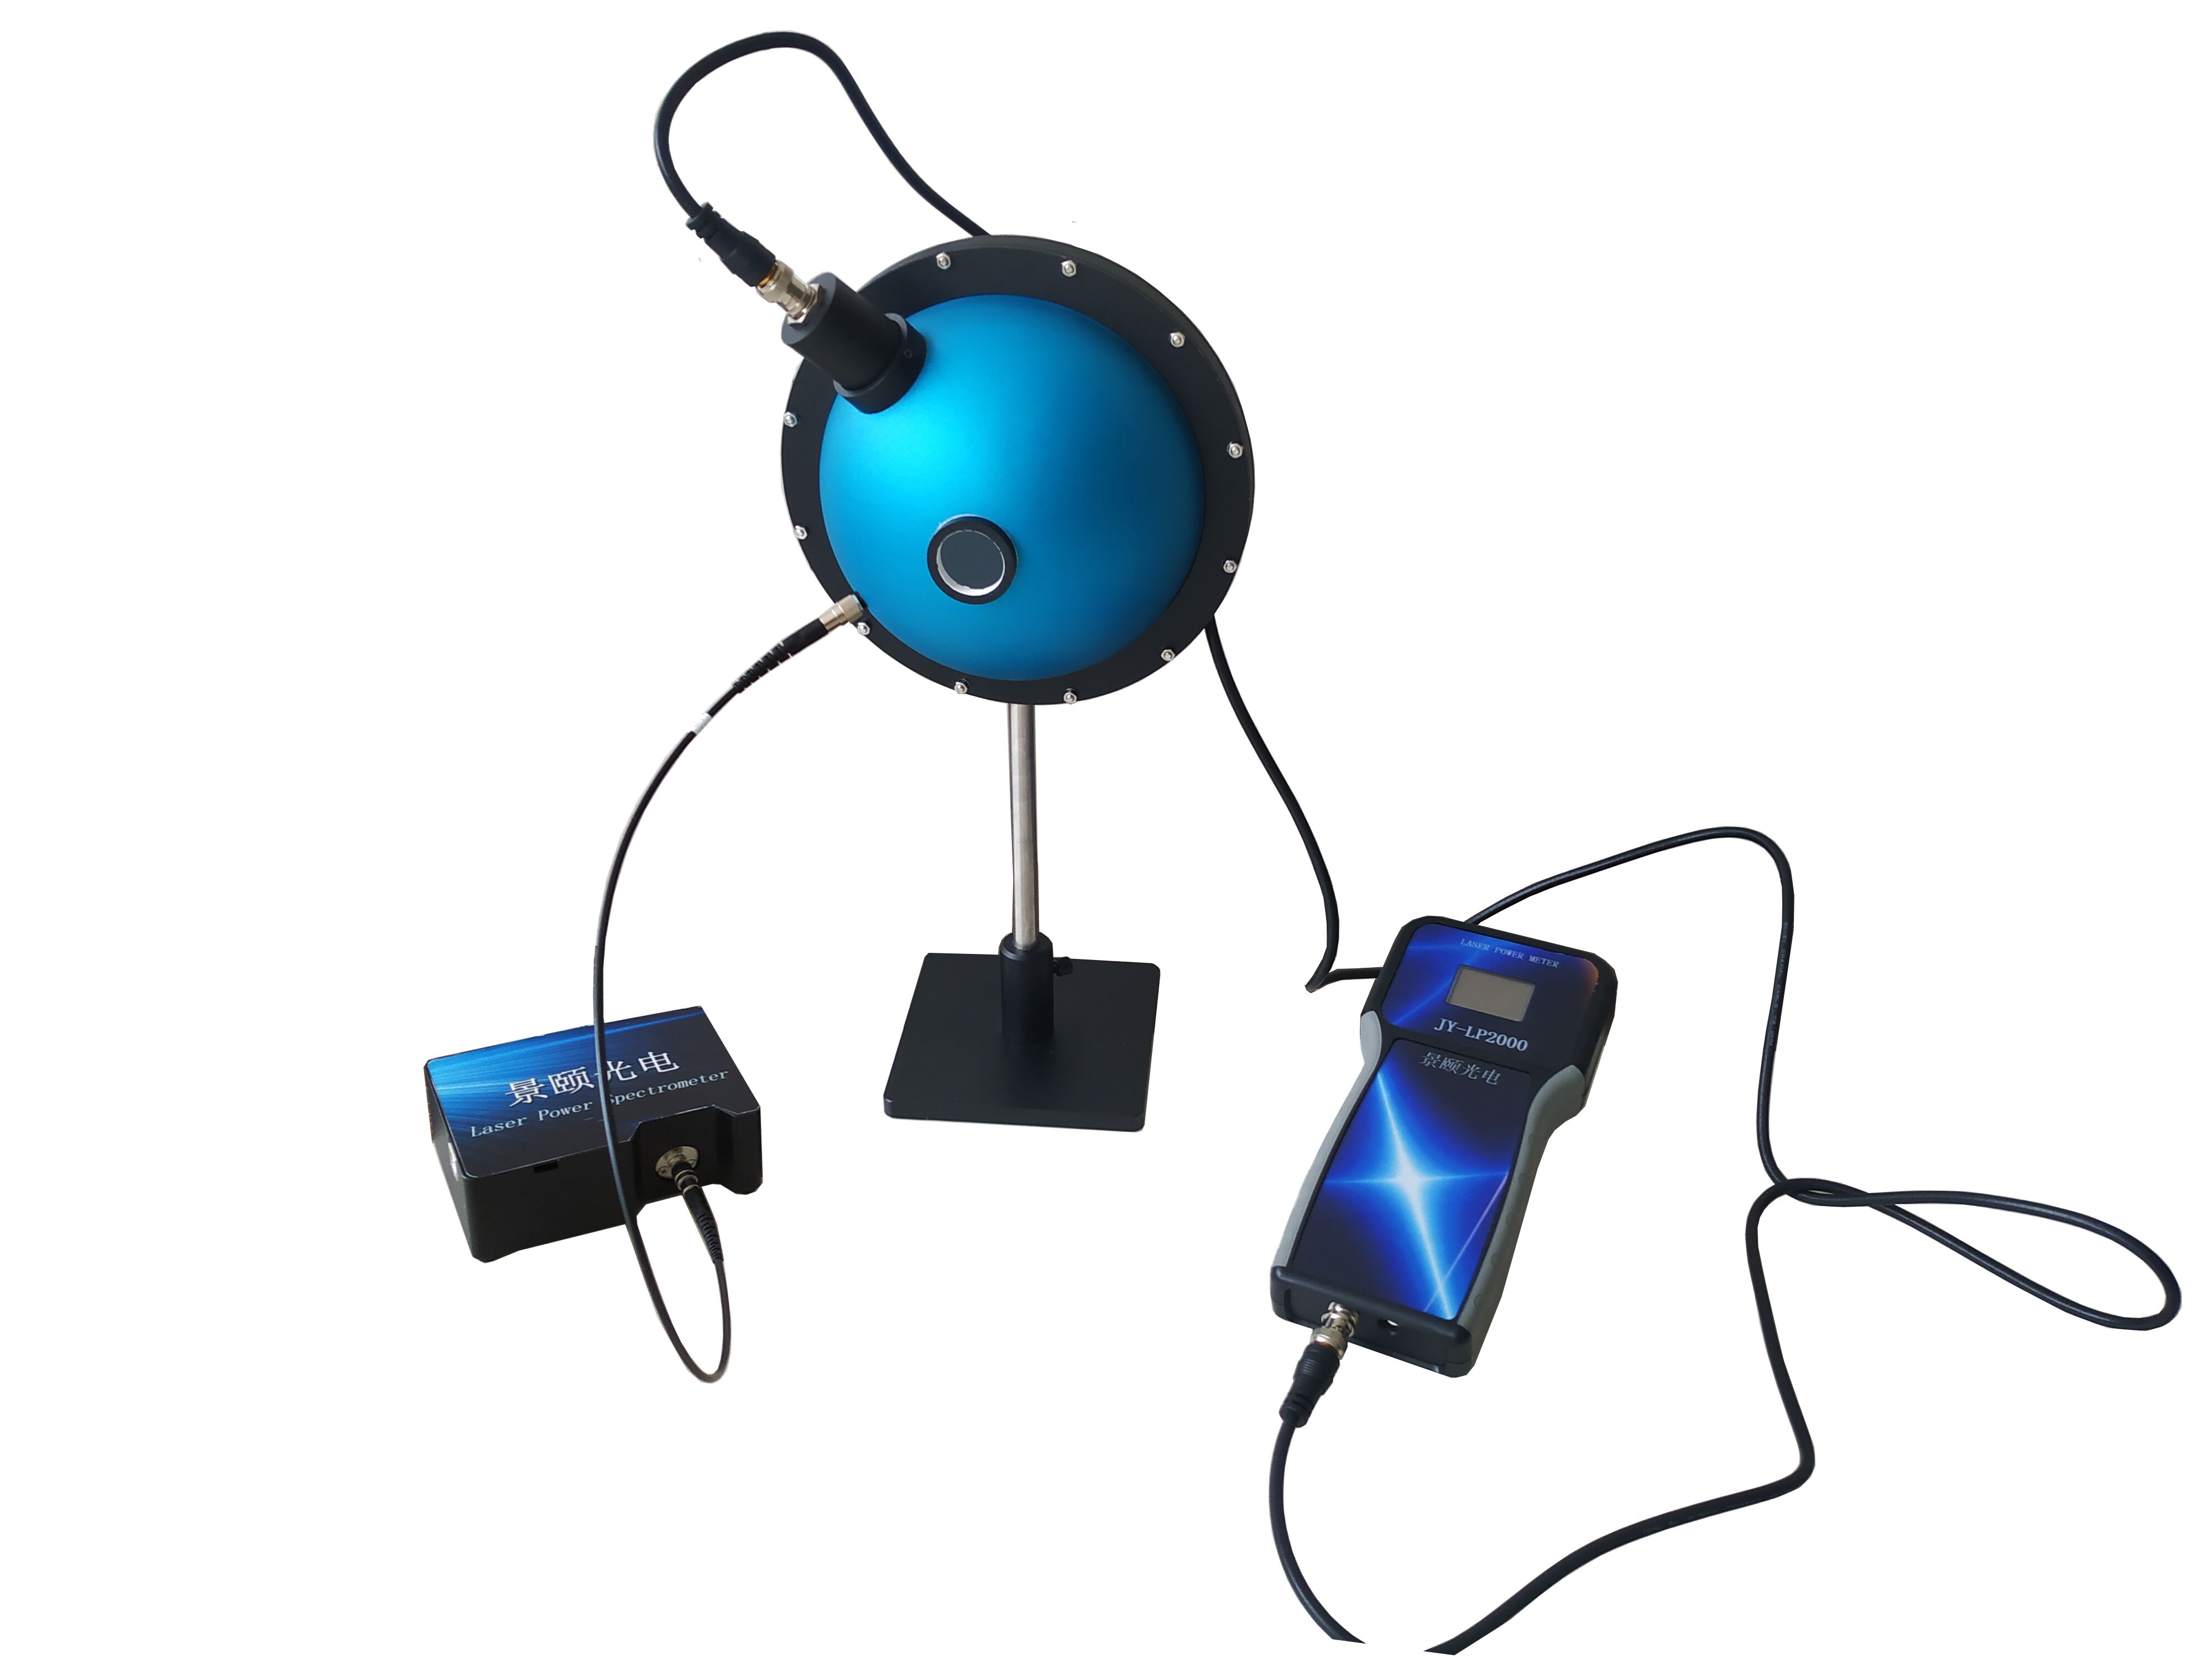
Devices were grouped into three tiers: entry-level (400–1,000 nm, φ3 mm spot), precision-grade (360–1,000 nm, φ0.8 mm spot), and welding-dedicated (850–980 nm selectable, multi-point parallel). All employed integrating-sphere D/0 illumination with >98% sphere-coating transmittance and automatic dark-background subtraction. Wavelength calibration used a holmium oxide filter at 637.80 nm; neon lamps served as secondary wavelength-traceability references due to their sharp emission lines and rapid stabilization.
Error Control Protocol
Photometric accuracy was cross-checked with neutral-density glass filters at 546.1 nm, 590 nm, and 635 nm. Repeatability was quantified as the standard deviation of 21 consecutive measurements on the same specimen. Wavelength repeatability was gated at 0.2 nm. Source warm-up was fixed at 30 minutes to suppress thermal drift.
Four In-Fab Case Studies
Optical Coating: AR Stack Transmittance Consistency at 940 nm
Process context.A Tier-1 optical component supplier produces 150,000 LiDAR receiver lenses monthly. Post-coating, every lens must meet a 940 nm transmittance target.
Objective.Hold transmittance variation within ±0.5% across the 900–980 nm band, replacing an imported single-wavelength point gauge.
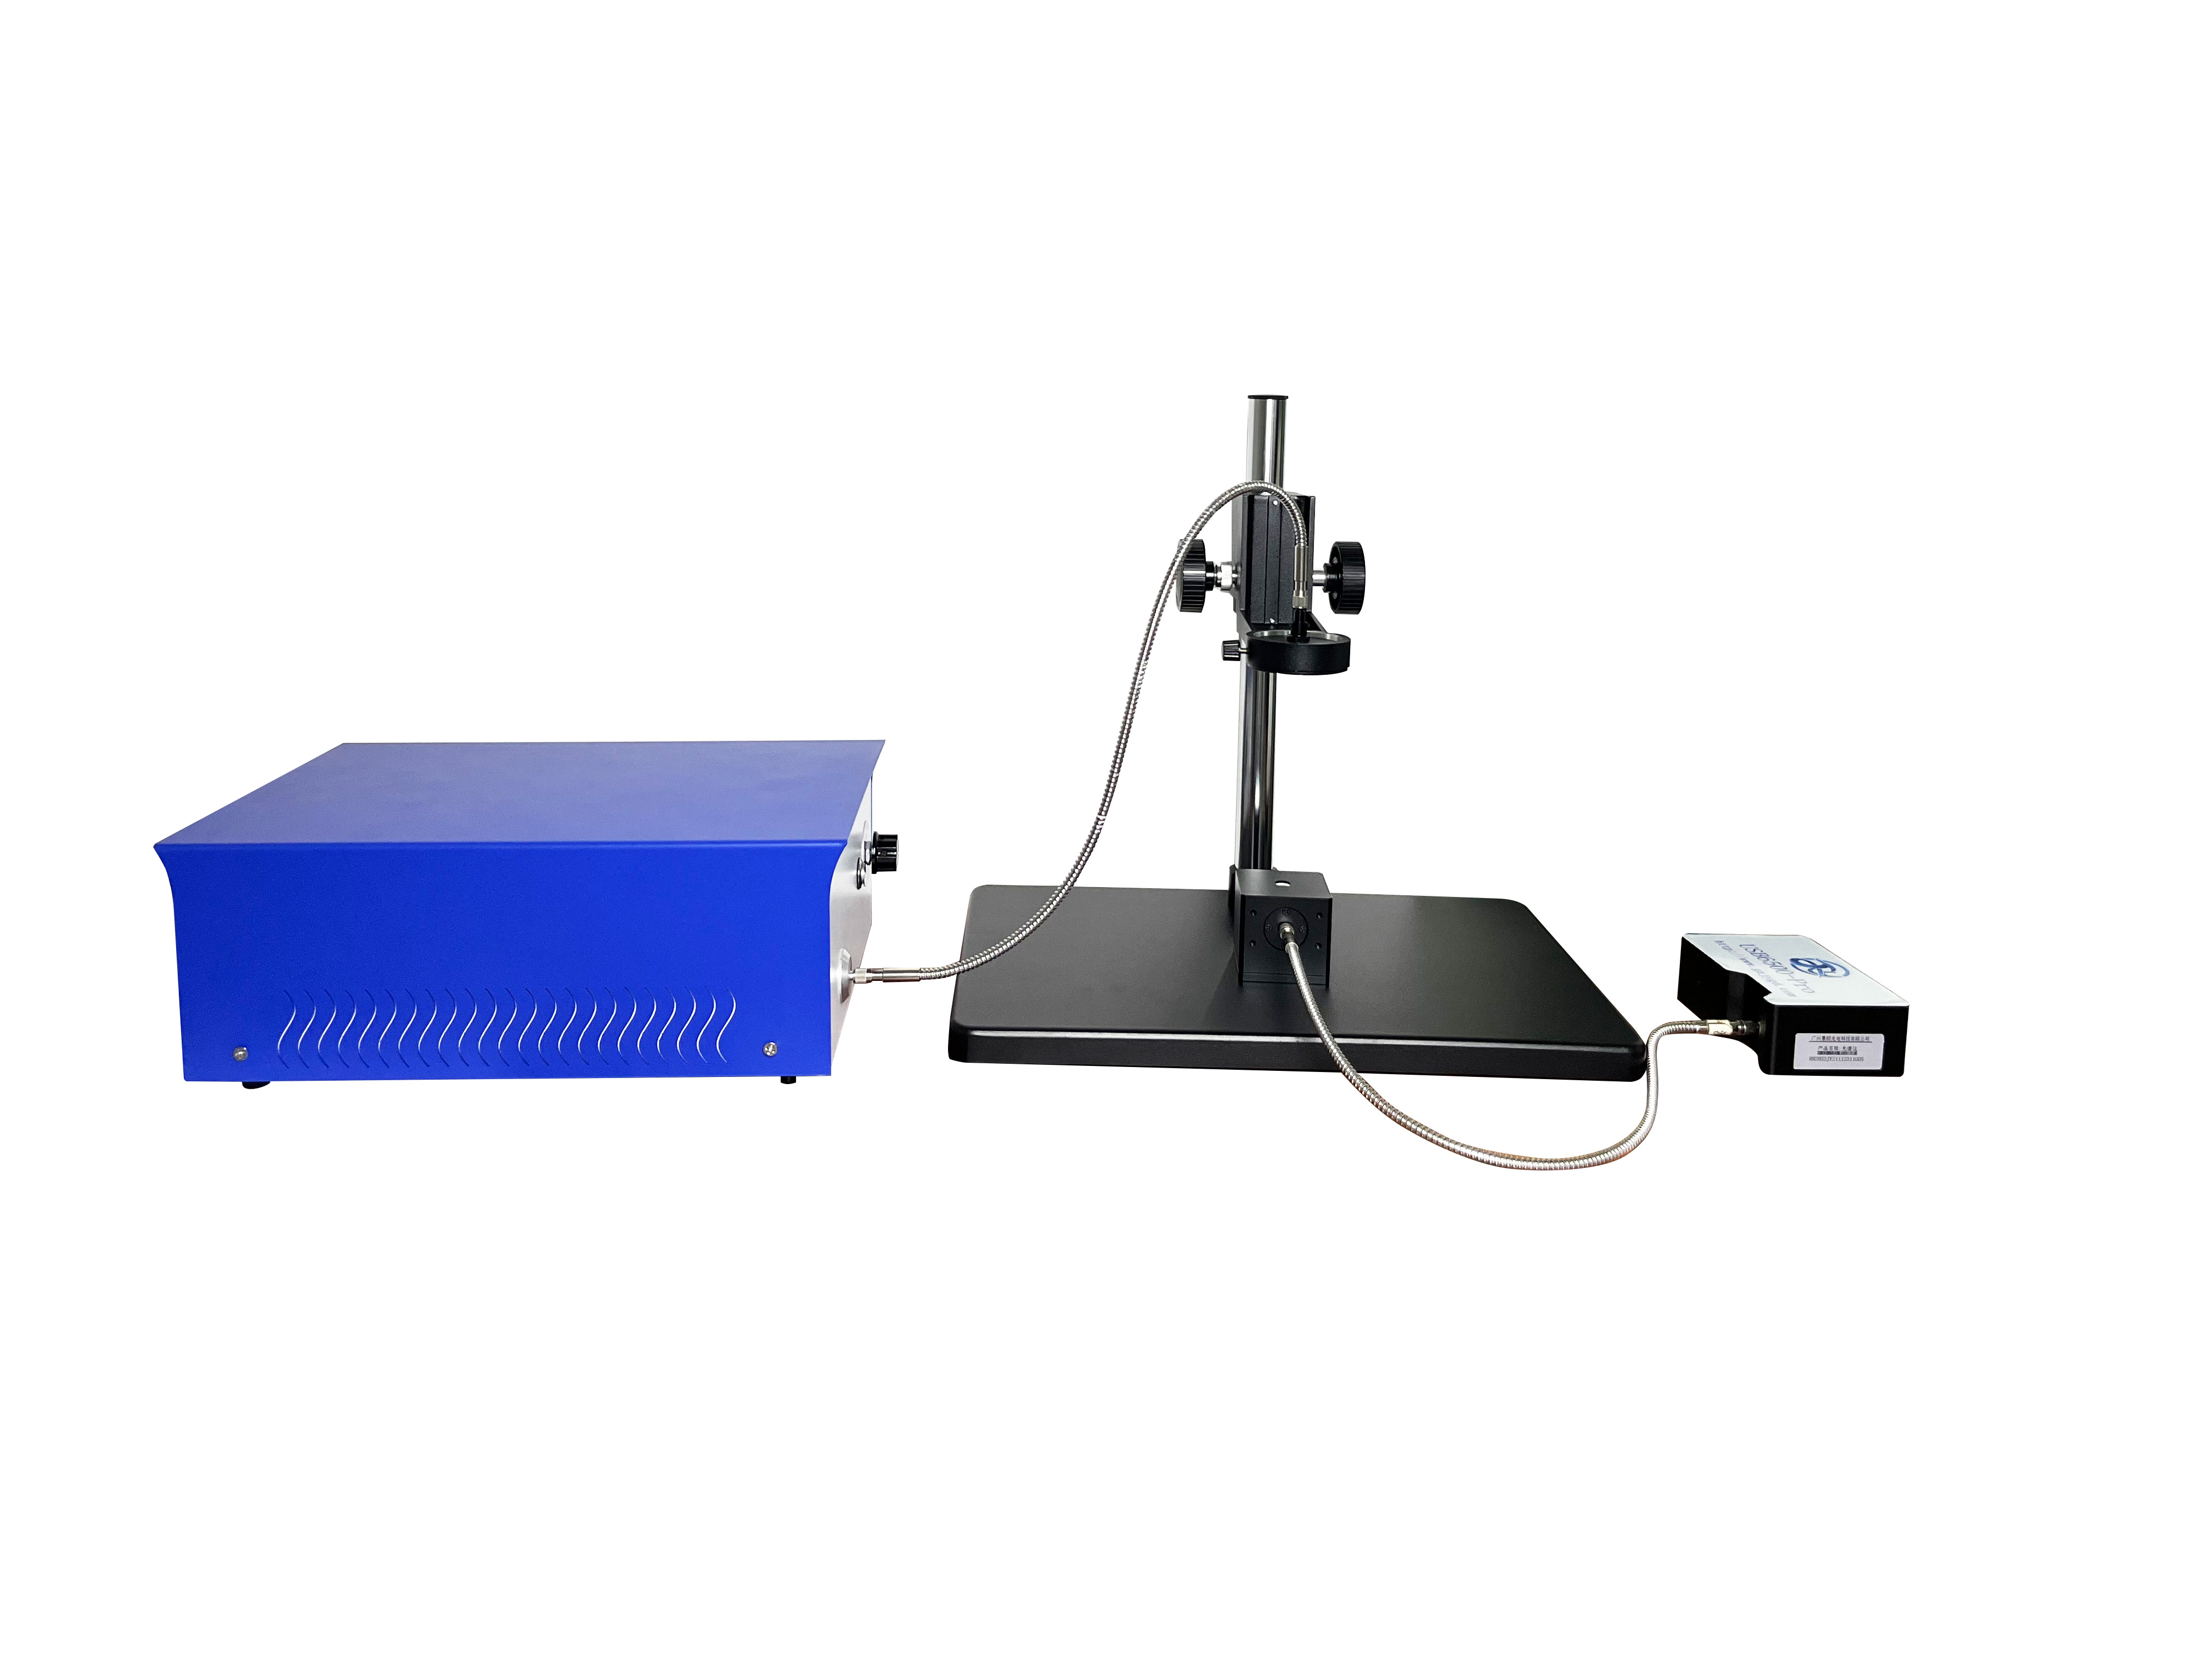
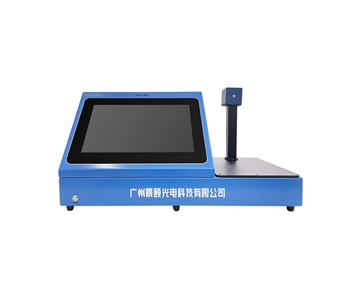
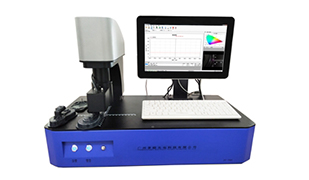
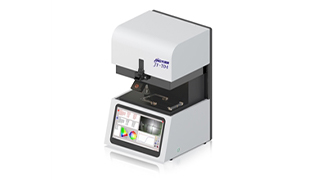
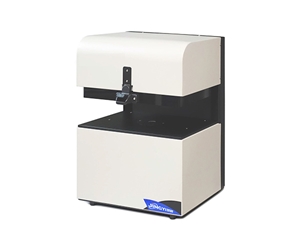
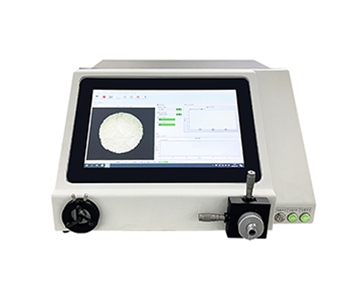
Protocol.The precision-grade system (360–1,000 nm, φ0.8 mm spot) scanned at 1 nm intervals. Data was compared against the incumbent imported unit (wavelength accuracy ±0.3 nm, photometric accuracy ±1%).
| Metric |
Evaluated Precision System |
Incumbent Reference |
Delta |
| Mean transmittance at 940 nm |
96.32% |
96.28% |
+0.04% |
| Wavelength repeatability |
0.2 nm |
0.15 nm |
+0.05 nm |
| Photometric repeatability |
≤0.2% |
≤0.15% |
+0.05% |
| Single-shot cycle time |
<1 s |
3–5 s |
3–5× faster |
| Spot diameter |
φ0.8 mm |
φ2 mm |
Smaller |
Analysis.The 0.04% deviation at 940 nm sits well inside the combined repeatability envelope of both instruments. Reducing the spot from φ2 mm to φ0.8 mm eliminated edge-effect false rejects on smaller lenses. Cycle-time reduction pushed single-shift throughput from 4,000 to 12,000 units.
Photovoltaic Glass: Full-Spectrum Transmittance on a 80,000-Panel Line
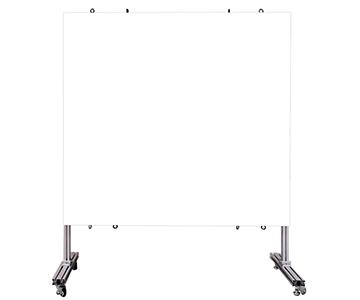
Process context.A photovoltaic module manufacturer runs 80,000 glass panels daily. Compliance target: GB/T 30984.1-2015 requires ≥91.5% transmittance for 3.2 mm glass.
Objective.Establish a full-spectrum baseline from UV through near-IR (300–1,100 nm), replacing segmented-band sampling.
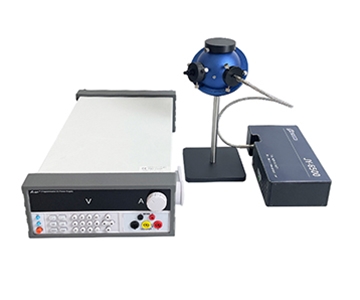
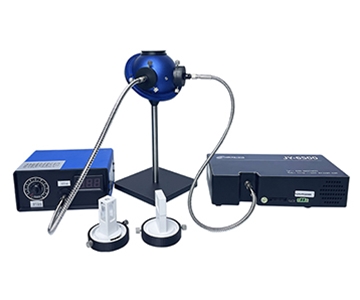
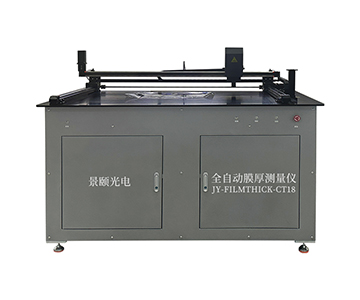
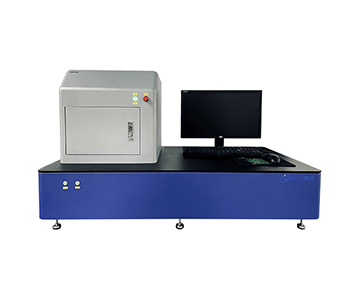
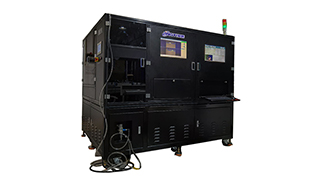
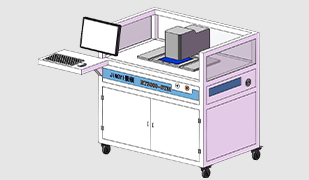
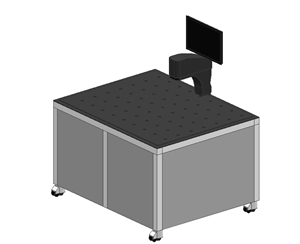
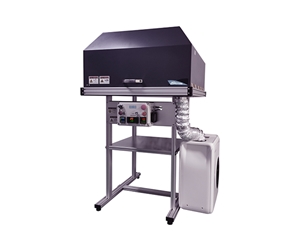
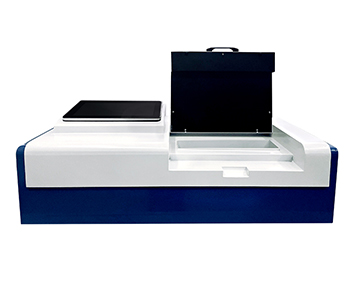
Protocol.A wideband automated system (250–2,500 nm, xenon-halogen hybrid source, 5 mm spot) was installed at the line end. Two hundred consecutive panels were tracked.
| Metric |
Measured Value |
Standard Requirement |
Margin |
| Visible transmittance (380–780 nm) |
93.2% |
≥91.5% |
+1.7% |
| UV cut-on wavelength |
358 nm |
<380 nm |
Pass |
| Near-IR transmittance (780–1,100 nm) |
91.8% |
No explicit limit |
Baseline established |
| Wavelength accuracy |
1 nm |
≤1 nm |
Borderline |
| Transmittance accuracy |
1% |
No explicit limit |
Baseline established |
| Single measurement time |
<1 s |
— |
Meets takt |
Analysis.The 1.7% margin in visible transmittance gives the coating process headroom for optimization. Wavelength accuracy at 1 nm is at the specification ceiling; neon-lamp verification frequency should be increased to maintain traceability. Near-IR data was logged into the in-house SPC chart for the first time, providing quantitative input for future AR-coating refinements.
Plastic Laser Welding: Full-Field NIR Scan of PA66 Cooling Lines
Process context.An automotive supplier delivers laser-welded plastic cooling circuits to an EV OEM. Baseline weld defect rate: 3.2%.
Objective.Implement 100% pre-weld transmittance inspection to drive defect rate below 1%.
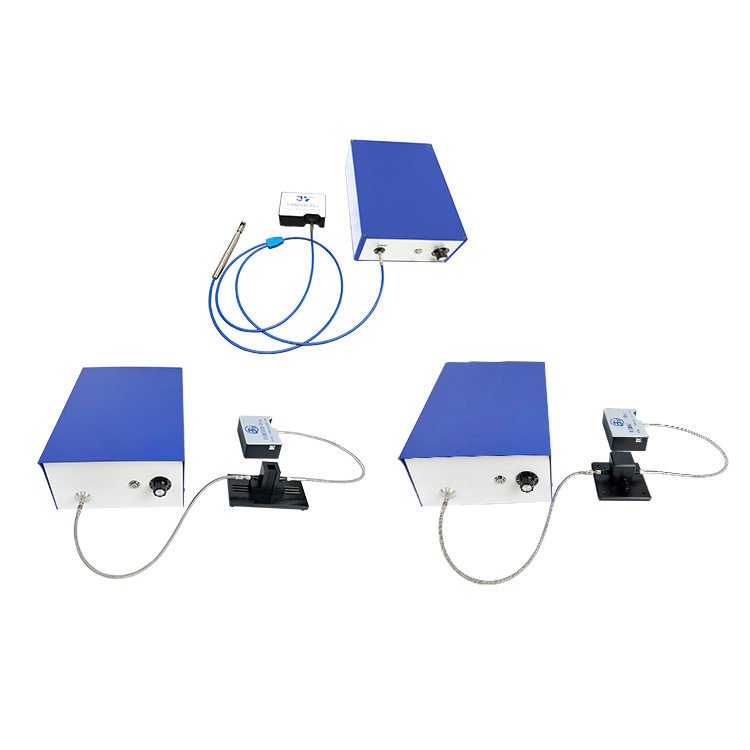
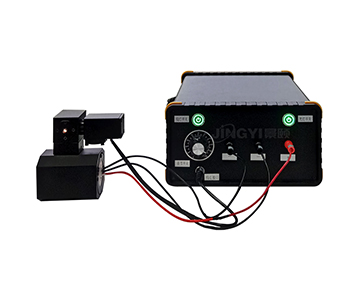
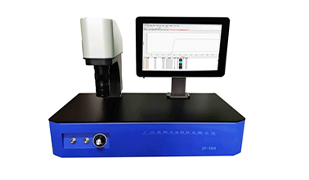
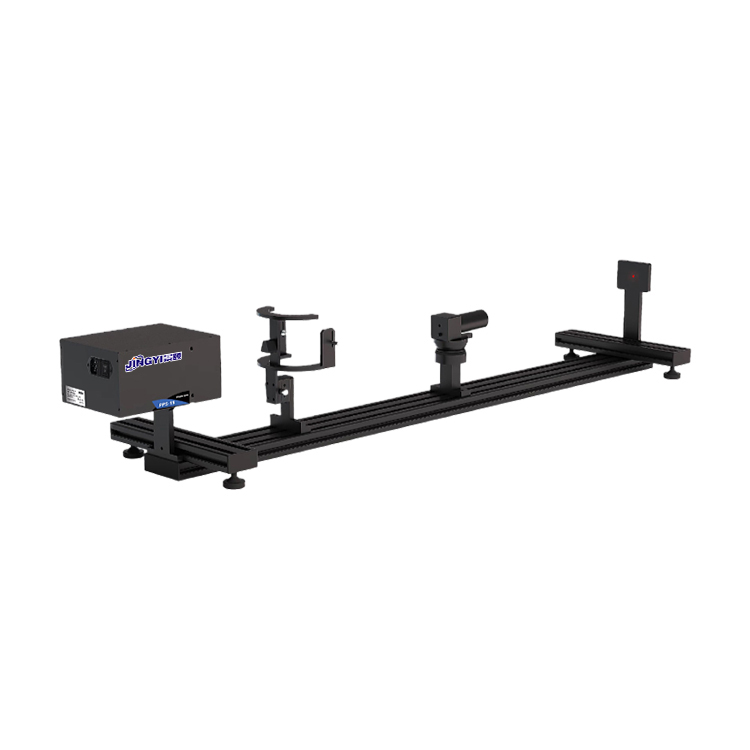
Protocol.A welding-dedicated system (850–980 nm selectable, default 980 nm, multi-point parallel) performed full-field scans on tubular parts. Custom detection zones with transmittance thresholds triggered automatic OK/NG classification.
| Metric |
Measured Value |
Process Requirement |
Verdict |
| Mean transmittance at 980 nm |
42.6% |
40–45% |
OK |
| Maximum transmittance |
44.1% |
<46% |
OK |
| Minimum transmittance |
41.2% |
>38% |
OK |
| Zone-to-zone range |
2.9% |
<5% |
OK |
| Detection limit precision |
0.01% |
— |
Satisfied |
| Single test time |
0.8 s |
<1 s |
Satisfied |
| Measurement repeatability |
<1% |
<1% |
Borderline |
Analysis.Full-field scanning exposed localized transmittance non-uniformity caused by injection-molding variation. One batch showed a 41.2% valley in the R-corner region—the exact location of subsequent weld-strength failures. Feeding this data back to barrel temperature, mold temperature, and packing-pressure setpoints reduced weld defect rate from 3.2% to 0.7%. Repeatability at <1% is borderline; when ambient temperature swings exceed ±3 °C, auto-calibration frequency must increase to hold stability.
Fiber-Optic Light Guide: Combined Spectral and End-Face Inspection
Process context.A medical-device manufacturer struggles with endoscope light-guide yield loss driven by both transmittance decay and fiber end-face fractures.
Objective.Simultaneously capture transmittance spectra and end-face images to build a joint "optical performance + geometric defect" classification model.
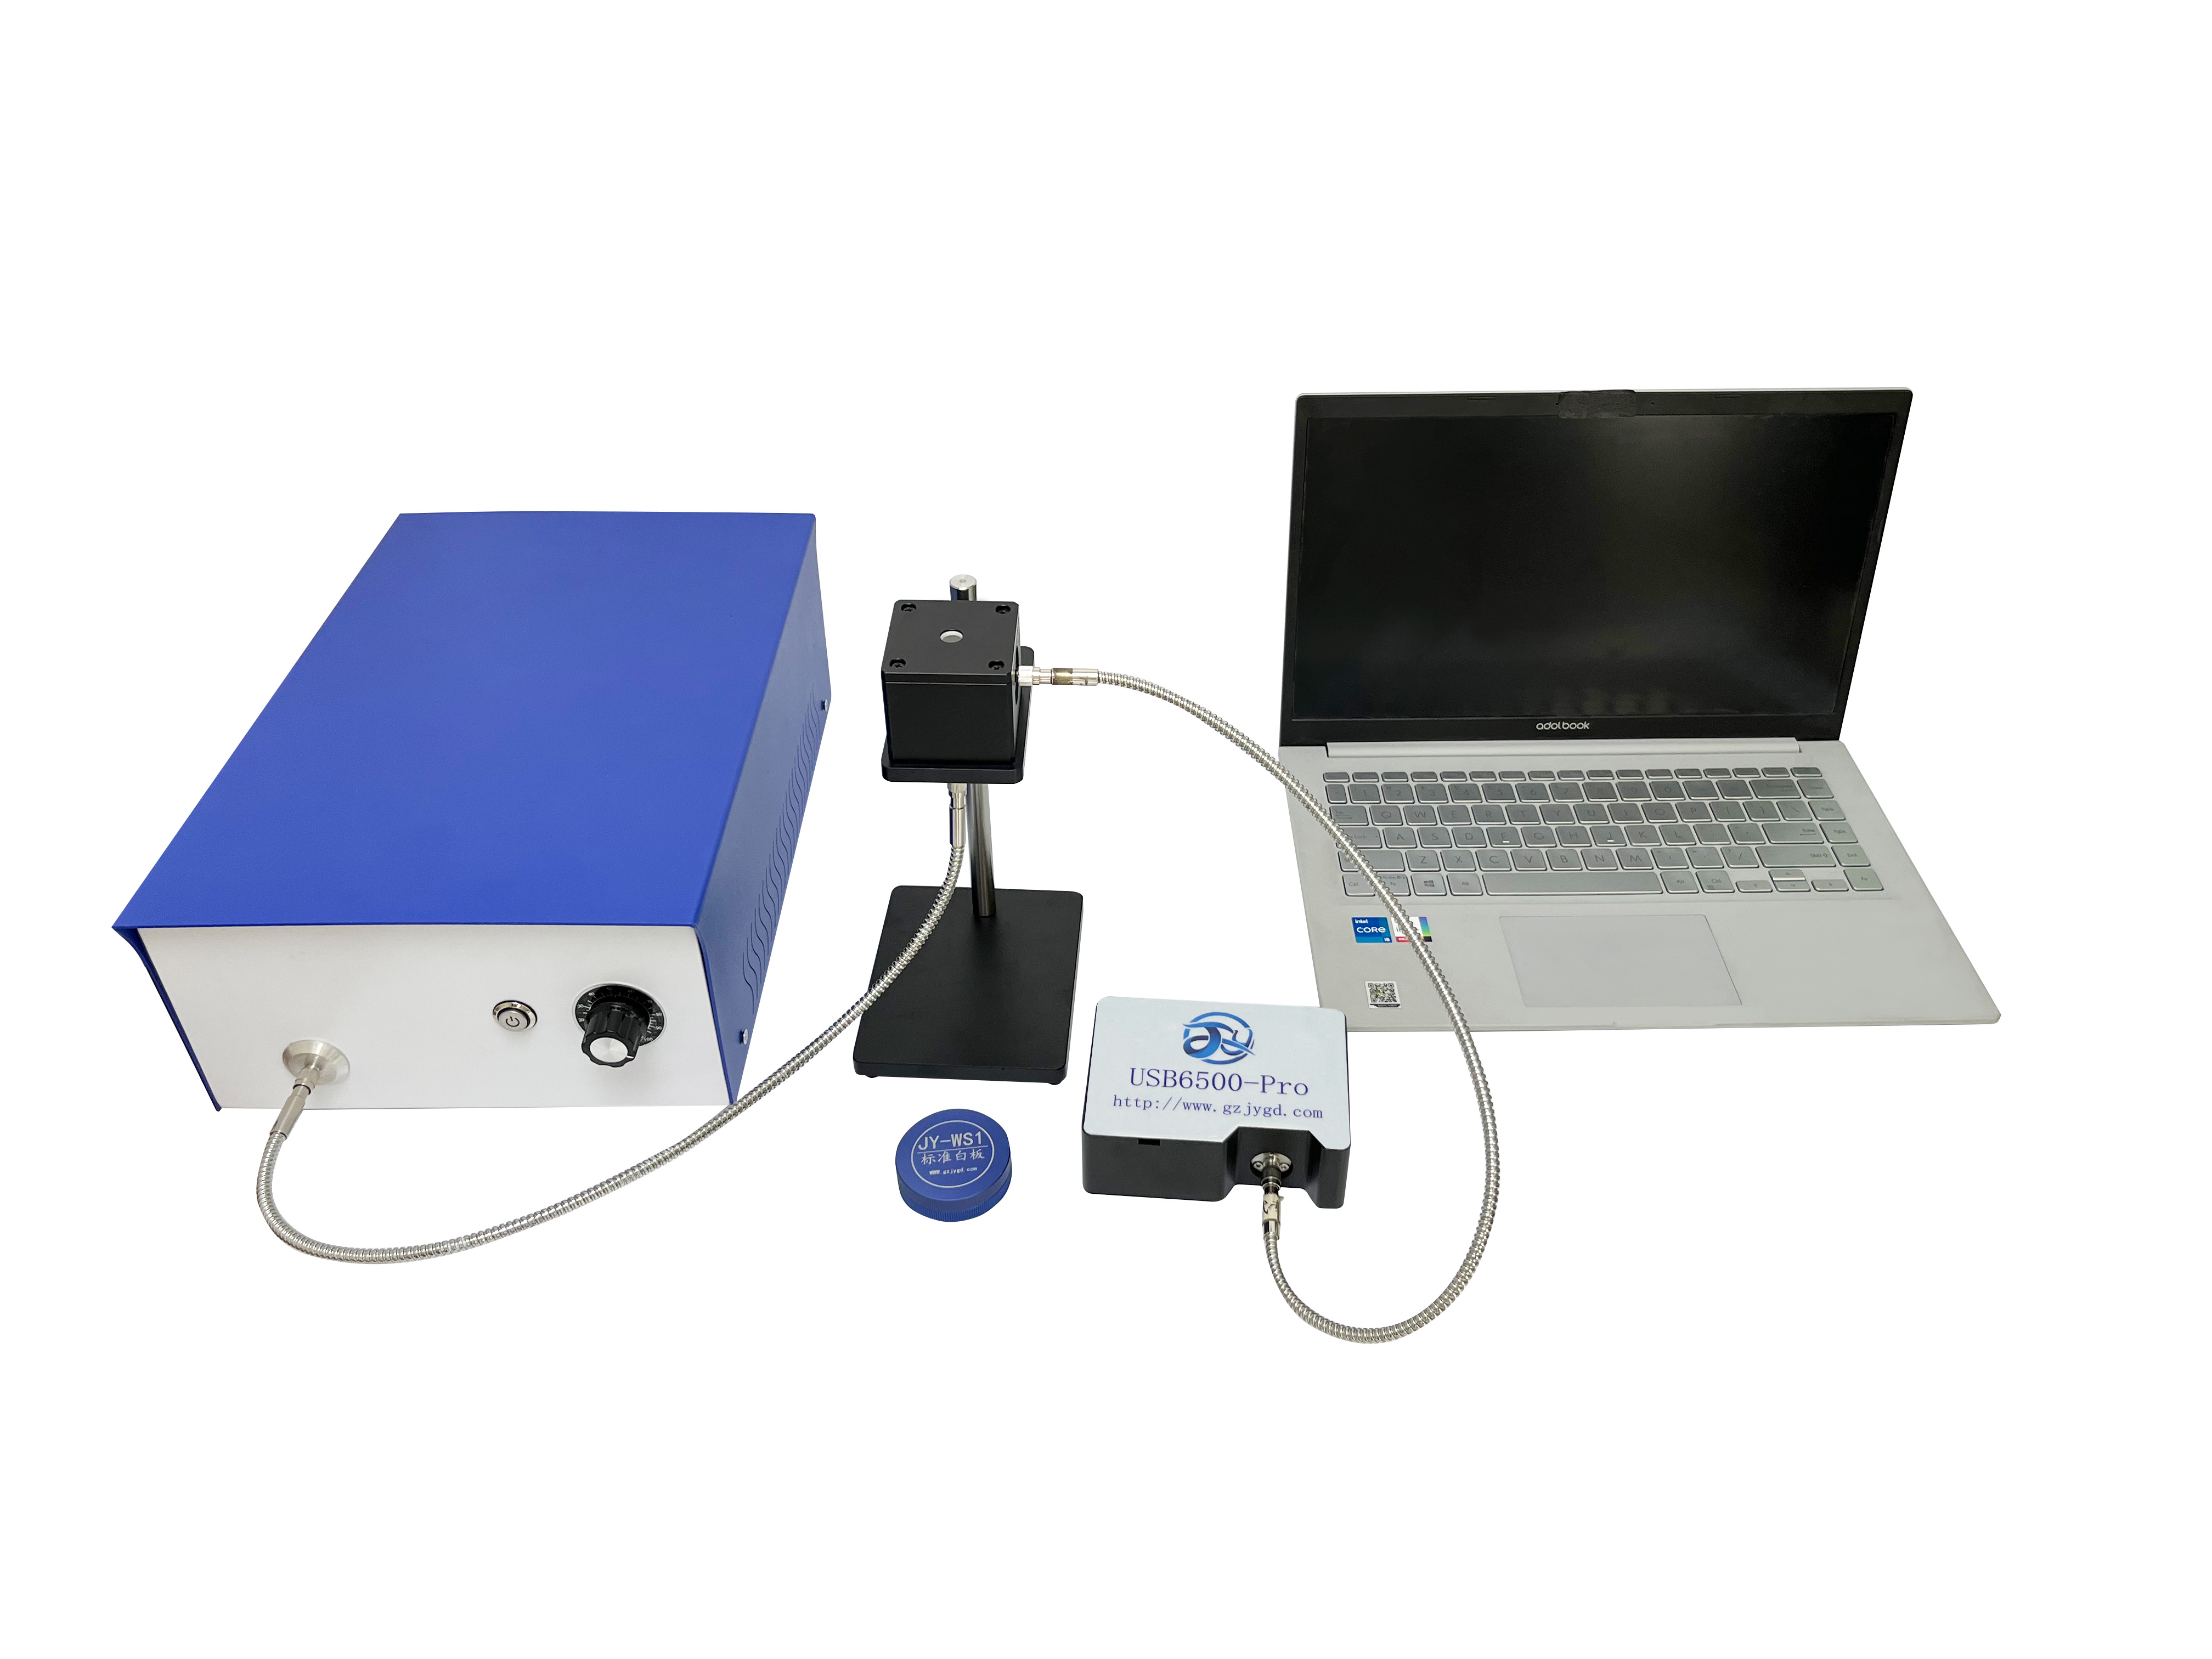
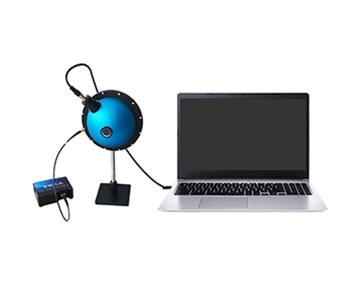
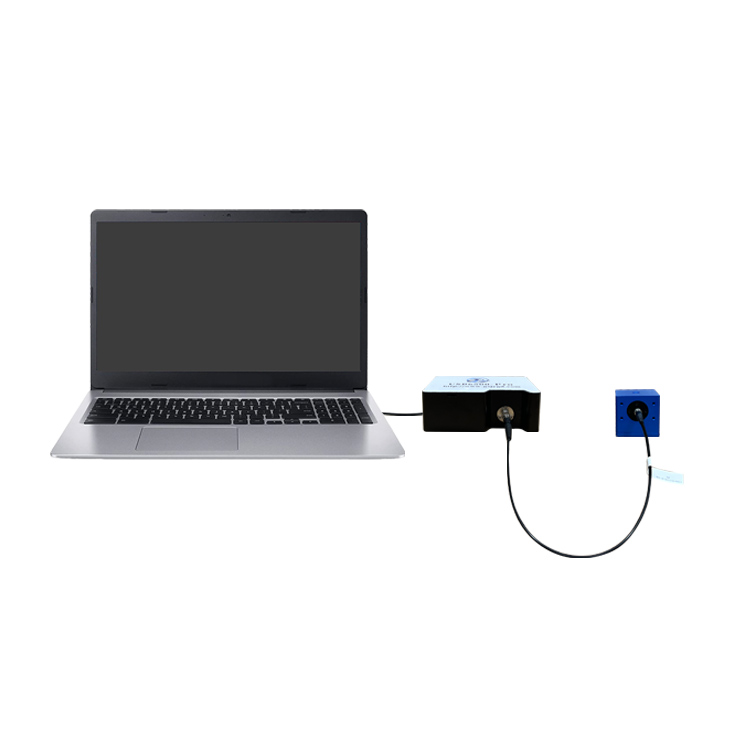
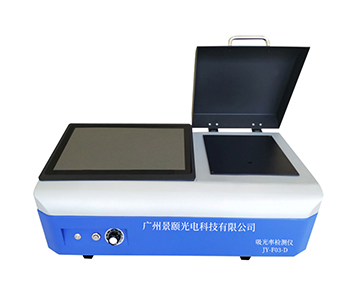
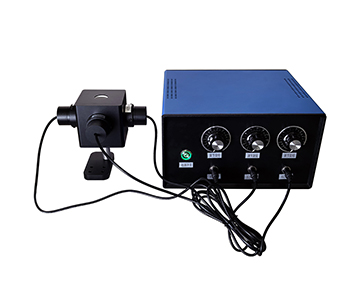
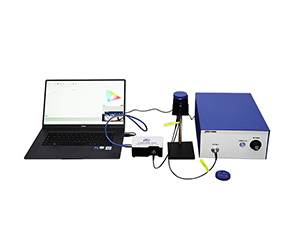
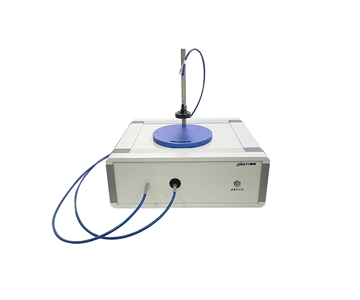
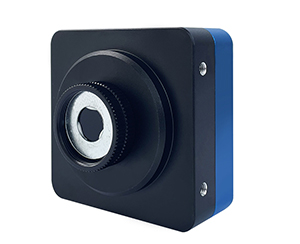
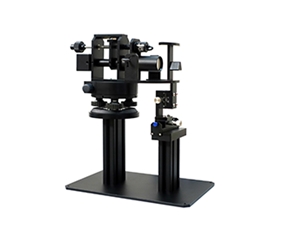
Protocol.A fiber-dedicated system (400–1,000 nm, φ10 mm port, WiFi/USB 3.0 dual interface) integrated snapshot end-face imaging with spectral output and color uniformity (ΔE) logging.
| Metric |
Good Unit |
Defective Unit (End-Face Fracture) |
Delta |
| Transmittance at 550 nm |
89.3% |
67.5% |
–21.8% |
| Spectral curve smoothness |
Continuous, no anomaly |
Sharp drop at 780 nm |
Structural defect indicator |
| Color uniformity (ΔE) |
<1.5 |
>3.0 |
Color variance exceeded |
| End-face fiber image |
Aligned, intact |
Local breakage / collapse |
Visually confirmed |
| Single inspection time |
<2 s |
<2 s |
Meets takt |
Analysis.The 780 nm spectral cliff correlated precisely with the fracture location, validating the anomaly-to-defect linkage model. Merging two previously separate stations cut per-unit inspection time from 4.5 minutes to under 2 seconds. However, the Windows 7 operating system triggers compliance risks under tightening medical-industry cybersecurity frameworks. OS modernization is now a hard requirement.
Cross-Tier Comparison: CPK and Core Parameter Matrix
| Dimension |
Imported Premium Tier |
Domestic Mainstream (Precision) |
Domestic Entry-Level |
| Wavelength range |
200–2,500 nm |
360–1,000 nm |
400–1,000 nm |
| Wavelength accuracy |
±0.2 nm |
<1 nm |
Better than 1% (transmittance) |
| Wavelength repeatability |
0.02 nm |
0.2 nm |
Not specified |
| Transmittance accuracy |
±0.5% |
≤1% |
Better than 1% |
| Spot diameter |
φ0.5–3 mm adjustable |
φ0.8 mm |
φ3 mm |
| Single-shot cycle |
5–300 ms |
<1 s |
<1 s |
| Software OS |
Win 10/11 |
Win 7/10/11 |
Win 98–10 |
| Source lifetime |
3,000 h |
2,000 h |
2,000 h |
| Warranty |
1 year (extended paid) |
1 year |
1 year |
| Typical price band |
$110K–$210K |
$21K–$49K |
$7K–$17K |
Key gap analysis.The one-order-of-magnitude difference in wavelength repeatability—0.2 nm versus 0.02 nm—means domestic systems cannot yet displace imported units in research-grade sub-nanometer resolution tasks. In industrial line inspection, however, 0.2 nm consumes only 10% of the typical ±2 nm process window for optical coatings. Source lifetime is another hidden delta: 2,000 h versus 3,000 h adds roughly 0.17 extra replacements per year under 8-hour daily operation. When source cost exceeds 30% of maintenance spend, this gap inflates five-year TCO by an estimated 8–12%. The entry-level tier’s OS compatibility span (Win 98–10) is a double-edged sword: it bridges legacy shop-floor PCs but blocks modern security frameworks, creating audit-trail and LIMS-integration deficits.
Customer Validation Statement
"We faced significant internal resistance when we brought in the domestic precision unit," recalled a quality director at the optical component manufacturer. "For ten years, the imported brand’s data authority had become departmental dogma. After three months of parallel running, deviation at 940 nm stabilized within 0.05% of the reference. The Win 7 interface, however, was less intuitive—new-operator training stretched from three days to five."
He added one detail from a weekend run: "At 2 a.m., after four hours of continuous operation, the system showed wavelength drift. A restart cleared it. Remote diagnostics traced the cause to an HVAC shutdown that pushed the ambient temperature up by 4 °C. We never ran the same stress test on the imported unit, so we cannot claim exclusivity. But it reminded us that the evaluated system may carry higher thermal sensitivity, demanding tighter environmental control."
Error Traceability and Deployment Recommendations
Systematic Error Sources
Wavelength drift.Halogen source center wavelength shifts approximately 0.05 nm per 1 °C ambient rise. House the instrument in a dedicated temperature-controlled room holding ±1 °C.
Integrating-sphere contamination.Dust and volatile organic accumulation on the sphere coating degrades diffuse reflectance. Run quarterly reference-plate cross-checks; initiate cleaning or sphere replacement when deviation exceeds 1.5%.
Fiber aging.Transmission through the fiber light path decays with bend cycles and UV exposure. Verify against a standard source every six months; replace when attenuation exceeds 2%.
Process-Specific Adaptation
For plastic laser welding deployments, complete three pre-qualification steps before sign-off: (1) calibrate the wavelength-transmittance curve with certified plastic reference standards; (2) execute 1,000 consecutive measurements within takt time and compute CPK; (3) perform regression analysis between transmittance data and weld pull strength to build a predictive model.
For photovoltaic glass, monitor the near-IR band (780–1,100 nm) as a standard practice, not just visible transmittance. AR-coating degradation typically manifests first in the near-IR; early capture shortens the process-correction loop.
Applicability Boundaries and Hard Constraints
Domestic spectral transmittance measurement systems are operationally viable for industrial line inspection, but two limitations must be acknowledged without mitigation.
First, wavelength traceability is not yet fully autonomous.
Second, long-term stability data under extreme environments is sparse.The 2,000-hour source lifetime is a laboratory nominal. At line-end positions with >80% RH and elevated particulate loads, source decay and detector noise can diverge measurably from specification. One customer reported repeatability degradation from <1% to approximately 1.3% after six months in an injection-molding hall; factory refurbishment of optical components restored performance. This signals that environmental-hardening design remains a development priority. Buyers should budget maintenance intervals 30–50% shorter than datasheet recommendations as a safety margin.
Frequently Asked Questions
Q1: Can these systems measure curved or arc-shaped samples?
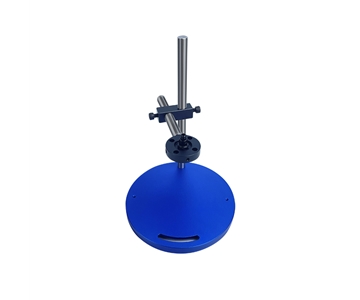
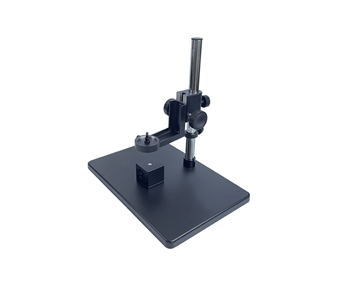
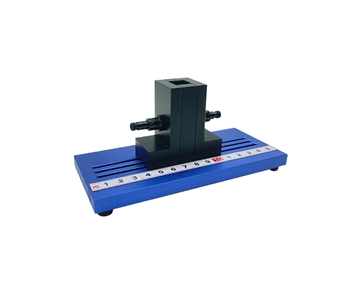
Entry-level units are designed for planar specimens with perpendicular beam incidence. For curved plastic welding parts, select a dedicated curved-surface model equipped with an arc sample stage and multi-axis adjustment bracket, supporting radial-symmetric and arc-surface inspection for parts ≥5 mm diameter and 10–150 mm length (custom fixtures available).
Q2: How often should wavelength calibration be performed?
Run automatic calibration with the built-in holmium oxide filter at every power-on; this takes approximately 30 seconds. Add an extra calibration cycle if ambient temperature shifts beyond ±3 °C or after eight hours of continuous operation. Neon lamps serve as a rapid secondary check for visible-band wavelength traceability.
Q3: Can the system generate reports acceptable to third-party auditors?
Precision-grade and mainstream systems comply with EN, ANSI, AS/NZS, GB, and other international standards. Software exports raw data, spectral curves, CIE color parameters, and pass/fail conclusions in one click. CNAS-accredited reports require supplementary calibration certificates from an accredited metrology institute; annual external verification is recommended.
Q4: What separates the price tiers at a technical level?
The $7K–$17K entry tier covers 400–1,000 nm with a φ3 mm spot, suited for routine planar-part sampling. The $21K–$49K mainstream tier extends to 360 nm, compresses the spot to φ0.8 mm, and adds CIE color calculation with automatic OK/NG classification. The high-end automated wideband tier (250–2,500 nm, pricing undisclosed) integrates an auto-test platform and hybrid gas-halogen source for full-spectrum 100% inspection on photovoltaic lines.
Q5: How can I independently verify measurement reliability before acceptance?
Execute three independent checks: (1) compare the instrument reading against your certified reference standard—deviation must be <0.5%; (2) measure the same specimen 50 times consecutively and compute the standard deviation for repeatability; (3) cross-compare the dataset against a third-party metrology lab or incumbent reference instrument, confirming systematic deviation sits inside your process tolerance. Final sign-off follows successful completion of all three checks.
About This Guide
Data Sources:SEMI annual reports, Chinese Optical Society technical white papers, GB/T 30984.1-2015, and customer-authorized in-fab validation datasets (n = 200+ specimens across four manufacturing lines).
Author:Optical metrology practitioner, 12 years in industrial precision measurement equipment.
Disclosure:Jingyi Optoelectronics manufactures spectral transmittance measurement systems. This article presents technical assessments based on published specifications, in-fab validation data, and industry public information. No compensation was received from third-party brands mentioned.
Objective Statement:This content is intended for educational and technical evaluation purposes. Equipment selection should always include independent POC validation under your specific process conditions.
Last Updated:June 2026
For detailed specifications and application notes on spectral transmittance measurement systems, search "Jingyi Optoelectronics transmittance measurement" or visit our technical library.