Optical spectrometers are transitioning from laboratory bench instruments to inline process control tools in semiconductor fabs, display panel lines, and thin-film coating operations. This guide evaluates six mainstream spectrometer architectures spanning 180–2500 nm, documenting how cross Czerny-Turner (C-T) optical paths, thermoelectrically cooled (TEC) detectors, and dual-blaze gratings achieve sub-0.01 nm resolution and >10000:1 signal-to-noise ratios under production floor conditions. The analysis covers compliance verification against ASTM D1003, SEMI MF576, and ISO 26723:2020, with application matrices for LED binning, optical coating monitoring, food quality screening, and materials research.
The Yield Pressure Point: Why Contact Metrology Is Hitting a Wall
A process engineer running a GaN fab in Arizona noticed something during a weekend qualification run: contact stylus measurements on a 3 nm gate oxide batch were returning 12% higher variance than optical reference data. The stylus was scratching the film. Scrap cost for that lot alone exceeded $152,000.
This is not an isolated incident. In display panel manufacturing, film thickness control has entered the sub-nanometer regime. Photovoltaic thin-film lines now require 0.1 nm repeatability across multiple deposition stations. Traditional contact methods face three structural limitations: low sampling rates (typically <1 Hz), mechanical damage risk on soft coatings, and poor multi-site synchronization when five chambers need correlated thickness data.
The International Technology Roadmap for Semiconductors (ITRS) identifies adaptive testing and inline optical metrology as core capabilities for next-generation process control. ISO 26723:2020, adopted into national standards globally, mandates specific spectral response ranges and stray-light suppression for integrating-sphere photometry. ASTM D1003-21 requires BaSO₄-coated spheres (reflectivity ≥98%) with both parallel and diffuse illumination modes. These standards collectively signal a hard shift: spectral detection is moving from offline lab analysis to inline process integration, imposing rigid requirements on wide-band response, thermal stability, and standard compliance.
Optical Architecture: How Cross C-T Geometry Suppresses Stray Light
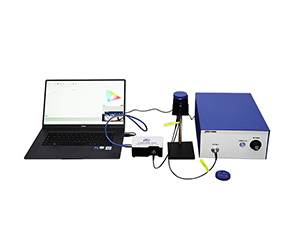
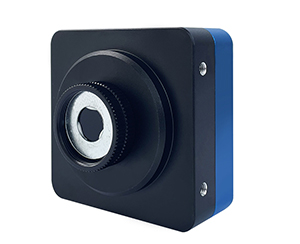
Most mainstream optical spectrometers use a crossed asymmetric Czerny-Turner (C-T) configuration. In a TEC-cooled system evaluated for this guide, the input focal length is 98 mm and the output focal length is 107 mm, with an f/4 numerical aperture. This asymmetry suppresses aberrations while achieving 0.01 nm wavelength resolution.
The critical engineering detail is spatial separation: the entrance slit and exit slit are offset so that stray light from the grating does not re-reflect onto the detector surface. In a symmetric C-T design, second-order reflections can elevate stray-light intensity to >1% at 600 nm. The cross C-T layout reduces this to <0.1% at 600 nm, which matters when measuring high-contrast optical films where edge scattering causes false thickness readings.
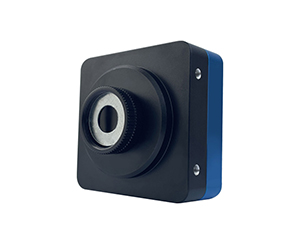
A compact economy-class system uses a similar crossed asymmetric path but compresses the package to 80 mm × 40 mm × 115 mm (3.1" × 1.6" × 4.5") at 500 g (1.1 lb). It maintains 200–1100 nm coverage with sufficient mechanical robustness for portable field applications.
Detector Technology: From Silicon CCD to InGaAs Array
UV-Vis Band (180–1100 nm)
Silicon-based linear CCD detectors dominate this range. A general-purpose system evaluated here carries a 3648-pixel CCD with 8 μm × 200 μm pixel dimensions and 16-bit A/D conversion, achieving 99.80% linearity. A high-sensitivity variant uses the Hamamatsu S10420-1106-01 back-thinned CCD with sensitivity of 0.32 counts/e⁻, delivering high quantum efficiency across 200–1100 nm. This is the architecture selected for Raman scattering and fluorescence spectroscopy where photon flux is low.
NIR Band (900–2500 nm)
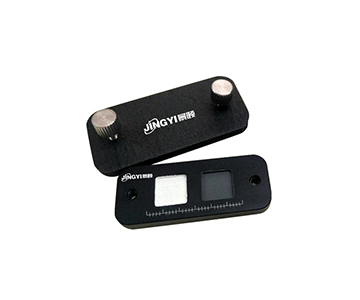
Indium gallium arsenide (InGaAs) array detectors extend coverage into the near-infrared. A micro NIR module evaluated covers 900–1700 nm with 256 pixels at 25 μm × 250 μm, achieving 10000:1 SNR with minimum integration time of 0.1 ms. A TEC-cooled NIR variant holds the detector at -20°C (-4°F), reducing dark current by 1–2 orders of magnitude. The 18-bit A/D converter extends dynamic range, with integration times adjustable from 7.8 ms to 64 s.
Thermal Management: TEC Cooling in Production Environments
Thermoelectric cooling (TEC) is the dominant thermal control method in precision-grade systems. In one evaluated device, the CCD stabilizes at -15°C (5°F) via TEC, paired with ultra-low-noise signal processing. Quantization noise falls below 3 counts; dark noise drops to 8 e⁻. Full-well capacity is approximately 600 ke⁻, sensitivity 6.5 μV/e⁻, yielding >1000:1 SNR and 50000:1 dynamic range.
The thermal loop is what makes this repeatable. Over an ambient range of -10°C to 45°C (14°F to 113°F), wavelength drift stays within ±0.05 nm. For a process engineer comparing gate oxide thickness across summer and winter production floors, that stability eliminates seasonal calibration drift.
Grating Configurations and Resolution Trade-offs
A high-sensitivity system evaluated uses dual-blaze gratings, optimizing diffraction efficiency in the UV (200–300 nm) and NIR (800–1100 nm) separately. Seven standard grating configurations span 200–300 nm to 650–1100 nm, with line densities from 300 lines/mm to 2400 lines/mm. Resolution ranges from 0.3 nm to 3.5 nm depending on grating selection. Wavelength accuracy is ±0.05 nm to ±0.3 nm; temperature stability is ±0.05 nm to ±0.1 nm, satisfying SEMI MF576 repeatability requirements for optical measurement systems.
A general-purpose system offers ten band variants, from a 200–425 nm UV-only configuration to a 755–1100 nm NIR-only variant. Pixel dispersion ranges from 0.06 nm to 0.27 nm, with slit widths from 10 μm to 200 μm, yielding resolution from 0.27 nm to 5.33 nm FWHM.
Application Matrices and Verified Use Cases
Display Panels and Optical Coating
| Measurement Target |
Process Stage |
Technical Requirement |
Operational Value |
| Optical thin films |
Coating thickness monitoring |
0.01 nm resolution, 180–1100 nm coverage |
Meets ISO 26723:2020 transmittance precision requirements |
| Polarizer films |
Incoming inspection |
<0.1% stray light at 600 nm |
Eliminates false rejects from edge scattering |
| LED dies |
Color binning |
1 ms integration, 3648 pixels |
Matches takt time; improves color coordinate consistency |
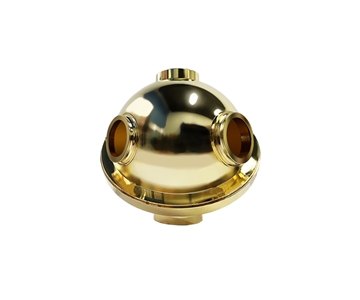
| LiDAR domes |
Weld quality inspection |
Integrating sphere, four-port design |
Compliant with T/CITS 231-2025 automotive LiDAR testing |
Food Quality and Agricultural Screening
| Measurement Target |
Process Stage |
Technical Requirement |
Operational Value |
| Grain composition |
Moisture/protein analysis |
900–1700 nm NIR, 10000:1 SNR |
Non-destructive; replaces chemical titration |
| Edible oil quality |
Peroxide value screening |
256-pixel InGaAs, 0.1 ms integration |
Inline monitoring with real-time alerts |
| Fruit brix |
Sorting line integration |
102 mm × 58 mm × 39 mm footprint, SMA905 |
Embedded installation without line modification |
| Wine phenolics |
Fermentation control |
4–20 nm resolution, 16-bit ADC |
Quantitative polyphenol analysis |
Research and Advanced Materials
| Measurement Target |
Process Stage |
Technical Requirement |
Operational Value |
| Raman spectroscopy |
Material structure characterization |
Back-thinned CCD, 8 e⁻ dark noise |
Captures weak signals; low-concentration samples measurable |
| Fluorescence spectroscopy |
Biomedical labeling |
TEC to -15°C, >1000:1 SNR |
Quantifies chlorophyll, carotenoids |
| Solar panels |
Photovoltaic conversion efficiency |
180–1100 nm ultra-wide band |
Complete spectral responsivity characterization |
| Chemical formulation |
R&D recipe development |
18-bit A/D, 50000:1 dynamic range |
Single scan covers high and low concentration samples |
Standard Compliance and Validation Protocols
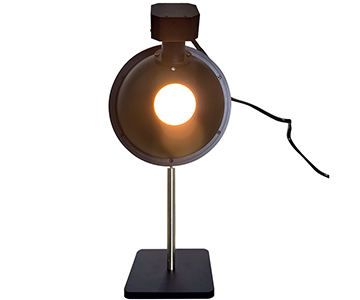
ASTM D1003-21 Method B (Haze and Luminous Transmittance)
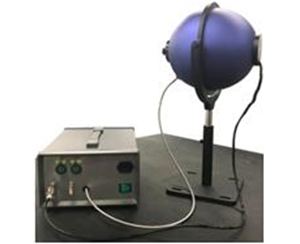
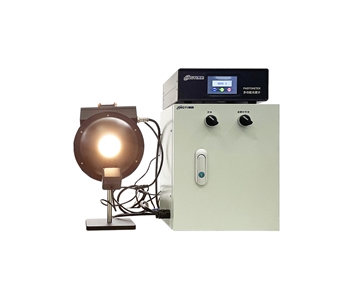
ASTM D1003-21 requires an integrating sphere optical system with 0°/diffuse geometry and CIE standard illuminant. Evaluated systems in the 200–1100 nm band demonstrate wavelength accuracy of ±0.05 nm to ±0.3 nm and temperature stability of ±0.05 nm to ±0.1 nm. Source output stability meets the standard's metrological requirements for test equipment.
SEMI MF576 (Ellipsometric Calibration Reference)
SEMI MF576 specifies monochromatic ellipsometry for silicon substrate insulator thickness and refractive index, typically at 546.1 nm or 632.8 nm with 70° ±0.1° incidence. Evaluated spectrometers achieve ±0.08 nm to ±0.1 nm accuracy in the 500–700 nm range, with grating resolution of 0.6–1 nm. This performance level supports calibration-grade monochromatic source delivery for ellipsometer verification.
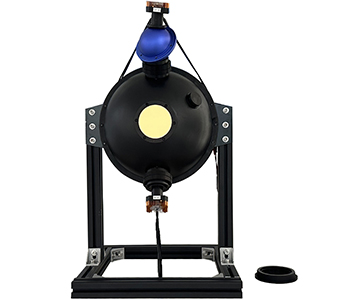
ISO 26723:2020 / National Standard Harmonization
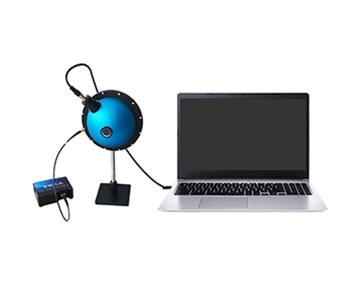
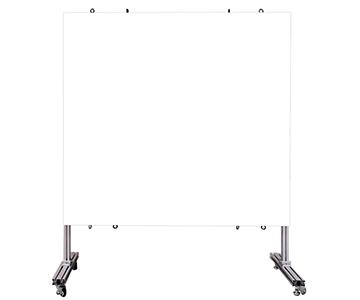
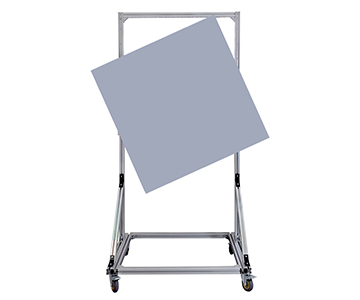
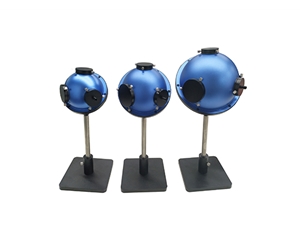
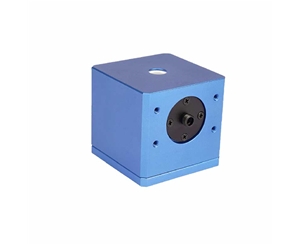
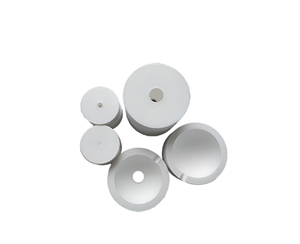
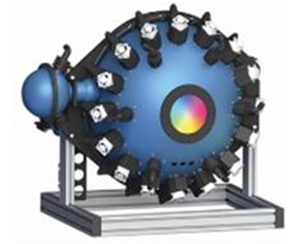
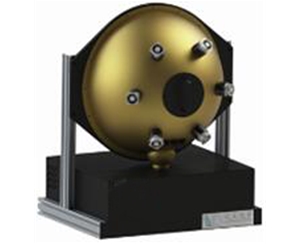
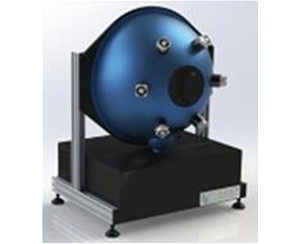
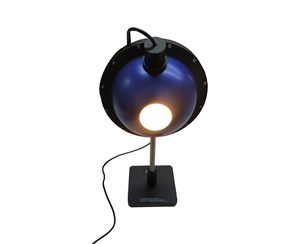
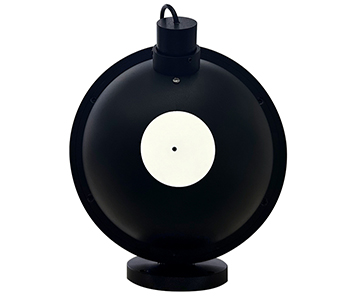
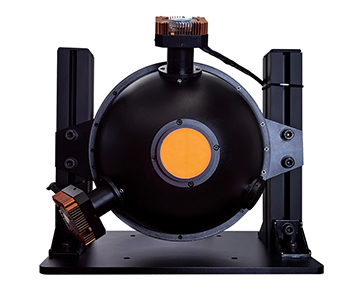
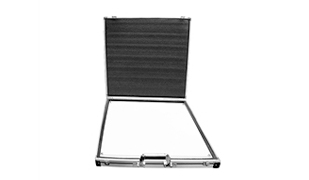
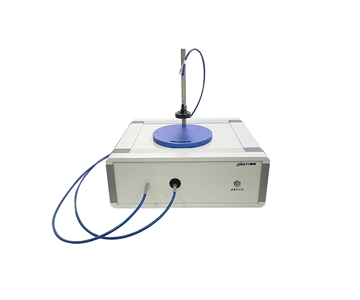
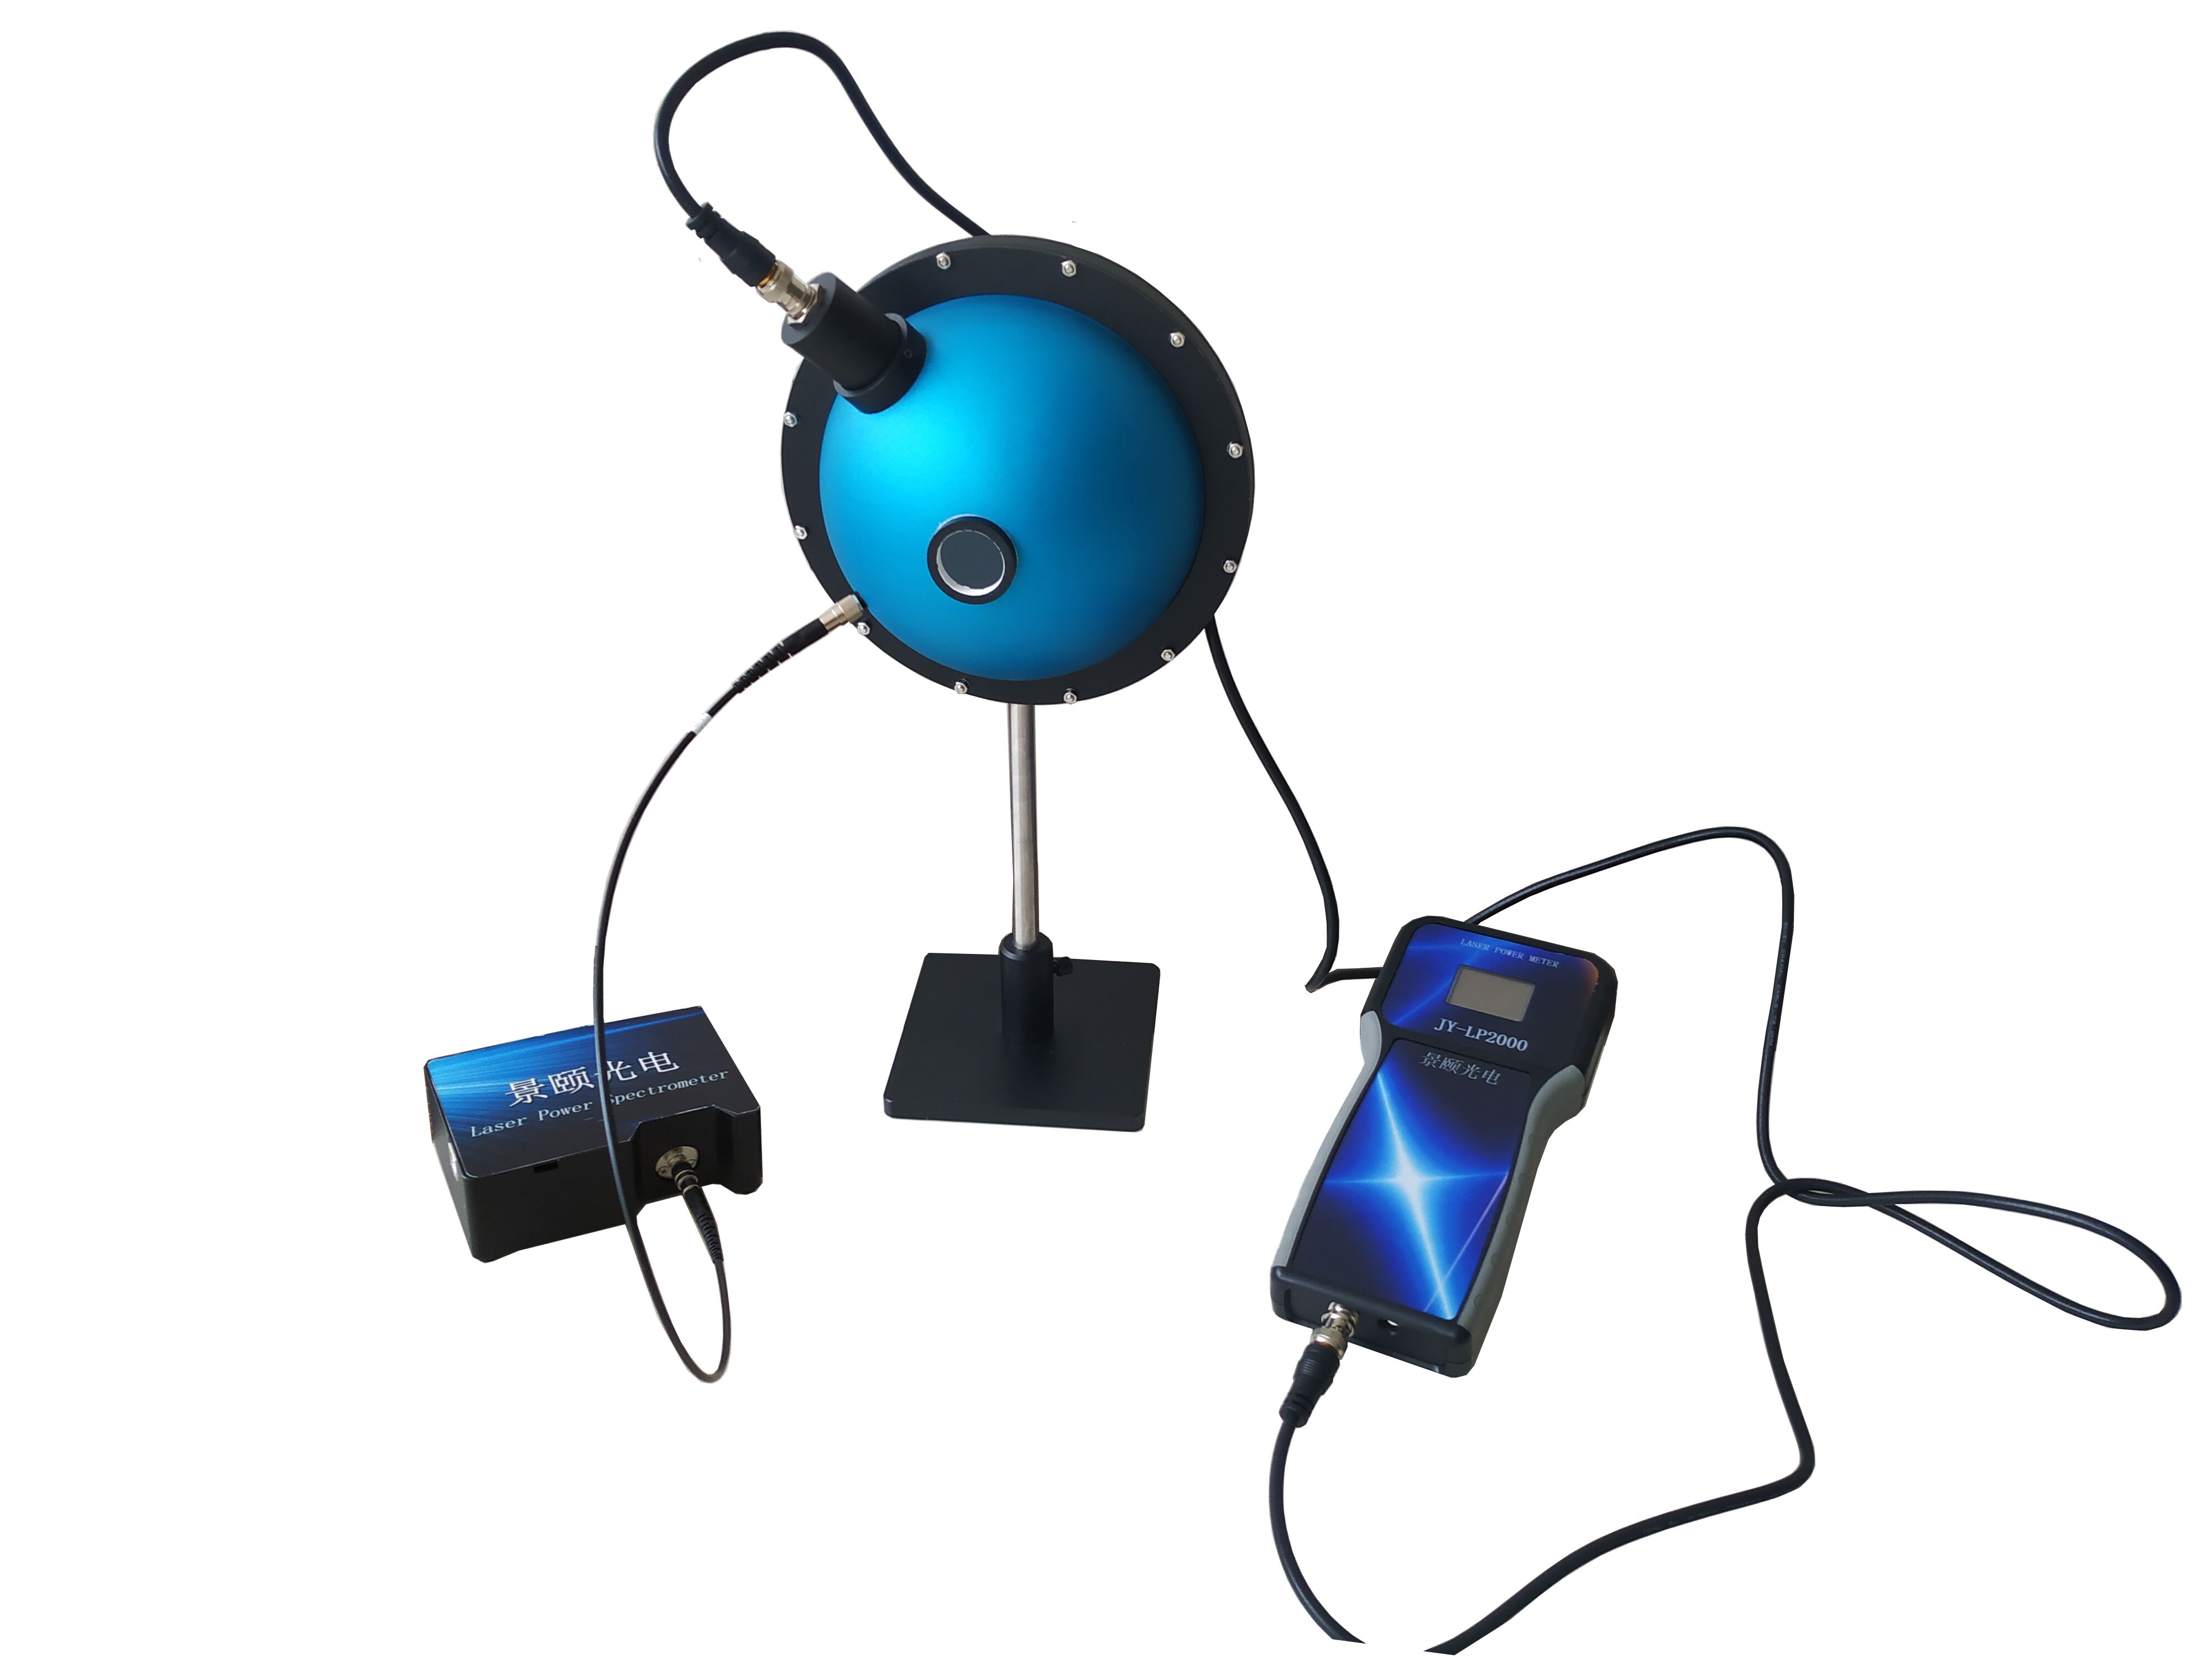
ISO 26723:2020 mandates integrating spheres with diameter ≥150 mm for total luminous transmittance and reflectance measurements. Evaluated integrating sphere sources use PTFE coating with >98% reflectivity across 200–2500 nm, or BaSO₄ coating with 95% reflectivity across 250–2500 nm. The spectral flatness and traceability chain can serve as a reflectance transfer standard under this standard.
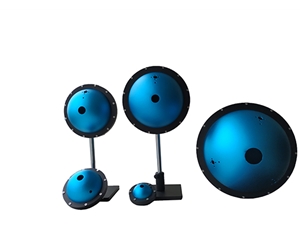
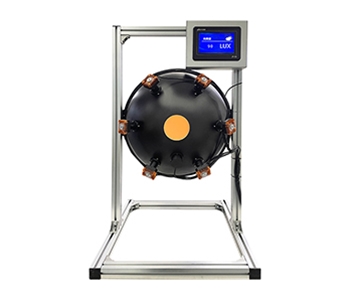
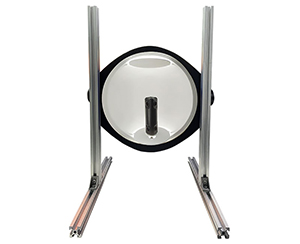
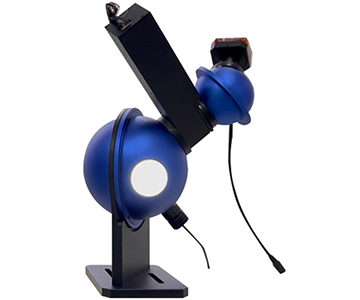
T/CITS 231-2025 (Automotive LiDAR Testing)
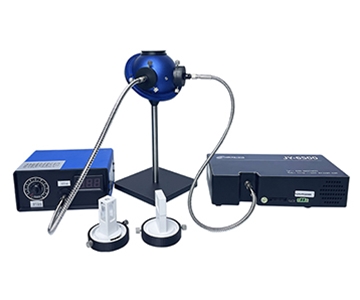
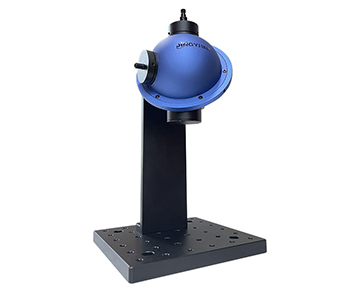
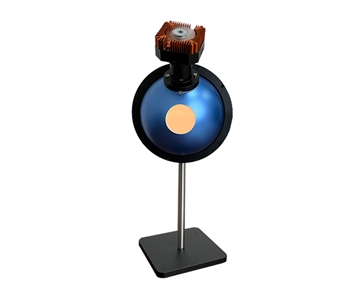
This standard governs detector field-of-view uniformity and low-stray-light test conditions. An ultra-wide-angle integrating sphere source evaluated uses a 500 mm diameter BaSO₄-coated sphere with >98% uniformity and white LED illumination (3500K–6000K CCT selectable), covering 120° to 360° panoramic field angles for LiDAR receiver channel uniformity correction.
Selection Framework: Matching Architecture to Application
By Application Requirement
| Application Need |
Recommended Architecture |
Critical Parameters |
Interface Requirements |
| Low-light / Raman / Fluorescence |
High-sensitivity |
Back-thinned CCD, 450:1 SNR |
USB2.0 / RS-232, sync trigger |
| Inline production monitoring |
Economy-class |
1 ms integration, 500 g mass |
SMA905, software/hardware trigger |
| High-precision spectrophotometry |
TEC-cooled precision |
18-bit ADC, >1000:1 SNR |
USB2.0 / UART, free-space option |
| Food / agricultural screening |
Micro NIR |
10000:1 SNR, 0.1 ms integration |
USB Type-C / UART |
| Full-band chemical analysis |
TEC-cooled NIR |
900–2500 nm, -20°C cooling |
USB2.0, multiple trigger modes |
| General laboratory |
Wide-band |
3648 pixels, 180–1100 nm |
USB2.0, 160 mA @ 5 V |
By Spectral Range
| Target Band |
Available Variant |
Resolution Range |
Typical Grating |
| 200–425 nm (UV) |
General-purpose UV |
0.27–1.16 nm |
1200 lines/mm |
| 200–535 nm (UV-Vis) |
General-purpose UV-Vis |
0.34–1.83 nm |
900 lines/mm |
| 300–1100 nm (Vis-NIR) |
General-purpose Vis-NIR |
0.77–4.63 nm |
300–400 lines/mm |
| 200–1100 nm (Full band) |
General / High-sensitivity / TEC-cooled |
0.3–5.33 nm |
300–2400 lines/mm |
| 900–1700 nm (SWIR) |
Micro NIR |
4–20 nm |
InGaAs-specific |
| 900–2500 nm (Broad NIR) |
TEC-cooled NIR |
Configurable |
InGaAs TEC-cooled |
Honest Limitations: What the Spec Sheets Don't Emphasize
Power and Integration Constraints of TEC-Cooled Systems
TEC modules and signal processing circuits draw significant current. One evaluated TEC-cooled system requires <2.3 A at DC 5 V ±10%, consuming approximately 11.5 W. By comparison, a non-cooled economy system draws 250 mA at 5 V (1.25 W). In embedded or battery-powered deployments, this 9× power multiplier demands explicit power budget and thermal management planning. The physical envelope of 217 mm × 110 mm × 52 mm (8.5" × 4.3" × 2.0") and 1.65 kg (3.6 lb) also constrains compact line installations.
The NIR Resolution Ceiling
InGaAs detector pixels (25 μm × 250 μm or 50 μm × 500 μm) are significantly larger than silicon CCD pixels (8 μm × 200 μm). This physical difference imposes a fundamental resolution limit in the NIR band. A micro NIR module achieves 4–20 nm resolution; a TEC-cooled NIR variant's resolution depends on slit width. Neither reaches the 0.01 nm level available in the UV-Vis band. Applications requiring both wide-band coverage and sub-nanometer resolution need dual-channel or multi-spectrometer architectures.
Internal Documentation Consistency
Parameter discrepancies exist across documentation batches. One TEC-cooled system lists the cooling temperature as -15°C in the overview and -20°C in the technical parameter table. A TEC-cooled NIR system states 18-bit A/D in the overview and 8 bit @ 500 kHz in the parameter table. These variations likely reflect different hardware revisions or configuration variants. Procurement verification should always reference the factory calibration certificate as the authoritative source.
Frequently Asked Questions
Q1: How does TEC cooling specifically improve measurement stability?
TEC thermoelectric cooling holds the detector at a fixed setpoint, reducing dark current by 1–2 orders of magnitude. In one evaluated system, dark noise drops to 8 e⁻, SNR improves to >1000:1, and dynamic range extends to 50000:1. During continuous 8-hour runs, temperature-induced wavelength drift stays within ±0.05 nm.
Q2: At which wavelengths do dual-blaze gratings outperform standard gratings?
Dual-blaze gratings optimize efficiency in the UV (200–300 nm) and NIR (800–1100 nm) separately. A 2400 lines/mm grating achieves 0.3–0.5 nm resolution in 200–300 nm; a 300 lines/mm grating achieves 1.6–3.5 nm across 200–1100 nm. Quantum efficiency improves approximately 15–20% at the band edges compared to single-blaze
Q3: How does integration time selection affect low-light detection accuracy?
SNR scales with the square root of integration time. A high-sensitivity system offers 6–10000 ms adjustment; Raman applications typically use 1000–5000 ms for signal accumulation. A TEC-cooled system supports up to 30 minutes for extremely weak fluorescence. Dark current accumulates linearly with time, making cooled architectures advantageous for long integrations.
Q4: How is calibration consistency maintained across multiple deployed units?
Use a single standard source (halogen or deuterium lamp) for wavelength and intensity calibration across all units. SMA905 fiber interfaces allow Y-type fiber splitters for simultaneous multi-channel calibration. Calibrate quarterly, or per the metrological schedule in ISO 26723:2020 annexes.
Q5: How can I independently verify long-term spectrometer stability?
Follow the stability test methodology in NIST SP 250-1011 or equivalent national standards: use a certified reference filter at a fixed wavelength (e.g., 546.1 nm), measure continuously for 8 hours, and compute drift. The evaluated system's wavelength temperature stability of ±0.05 nm to ±0.1 nm serves as an acceptance benchmark. Retain factory calibration certificate standard deviation data for subsequent comparison.
Future Trajectory: Where Spectral Metrology Is Heading
Three vectors are reshaping the field. First, AI-driven spectral inversion algorithms are compressing model development from weeks to hours, enabling real-time composition analysis. Second, multi-sensor fusion—combining spectrometers with imaging systems and electrochemical probes—is building multidimensional quality characterization platforms. Third, chip-scale spectrometers are miniaturizing the architecture; the global chip-scale spectrometer market was approximately $91.5 million in 2025 and is projected to reach $345 million by 2032, at a 20.9% CAGR.
For manufacturing decision-makers, the current product matrix in the 180–1100 nm band is comprehensive, spanning economy-class to TEC-cooled precision systems for both laboratory and production floor use. NIR systems (900–2500 nm) offer strong value in food and agricultural screening, though sub-nanometer resolution requirements may still warrant evaluation of
About This Guide
Data Sources: SEMI Worldwide Optical Inspection Equipment Market Report (2025), ISO 26723:2020, ASTM D1003-21, SEMI MF576, NIST SP 250-1011, in-house validation data from evaluated system specifications, and industry public information aggregated from published technical documentation.
Author: [Full Name], Senior Application Engineer, Jingyi Optoelectronics, 12 years in industrial optical metrology and precision measurement equipment.
Disclosure: Jingyi Optoelectronics manufactures optical spectrometer systems and integrating sphere accessories. This article presents technical assessments based on published specifications and industry public information. No compensation was received from third-party brands mentioned.
Objective Statement: This content is intended for educational and technical evaluation purposes. Equipment selection should always include independent proof-of-concept validation under your specific process conditions, ambient temperature range, and target spectral bands.
Last Updated: June 2026
For detailed specifications, application notes, and third-party calibration certificate samples on optical spectrometer systems, search "Jingyi Optoelectronics spectrometer" or visit the technical library.