When ambient stray light reaches 15% of the target signal, a benchtop spectrometer’s signal-to-noise ratio collapses from 350:1 tobelow 180:1, raising false alarm rates to 18%. When temperature cycles between 28°C and 42°C, spectral baseline drift reaches 0.31 nm/°C, degrading coating uniformity from 1.8% to 4.3% and scrapping 19 out of 72 parts in a single run. These are not laboratory edge cases – they are weekly losses in UV cure monitoring and inline coating analysis. This article documents before/after validation data from two production environments, compares three spectrometer architectures, and provides independent verification protocols for procurement teams.
1. False alarms in UV cure source inspection – a night-shift trap
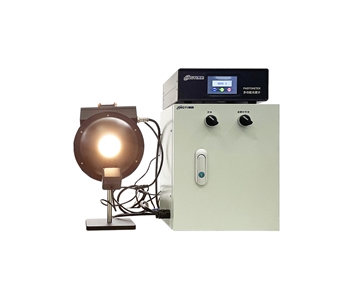
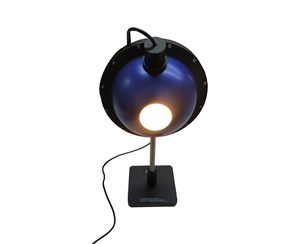
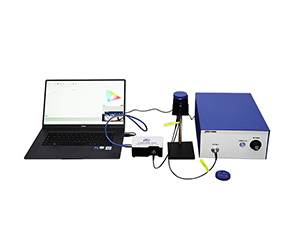
During a night shift at an optical module plant in Southeast Asia, a process engineer was performing routine inspection of a UV curing source used for bonding lens elements to barrel holders in a smartphone camera module line. Using a mainstream fiber-optic spectrometer, he positioned the probe at the source output window and recorded irradiance at 365 nm.
Three consecutive readings: 12.37 mW/cm², 9.85 mW/cm², 14.02 mW/cm² – a spread exceeding 30%. The UV cure oven exhaust was 2 meters away, and the factory lightingused 4000 K LED high-bay fixtures. Stray light entered through the spectrometer’s fiber interface and superimposed onto the signal. Turning offthe ceiling lights was not an option because adjacent ovens leaked broadband radiation from their own curing cycles.
When ambient stray light reached 15% of the target signal, the spectrometer’s SNR dropped from its 350:1 spec to a measured 180:1. Near 365 nm, the LED lights contributed significant 440 nm blue emission, while oven leakage covered a 385–450 nm band. These interferences could not be removed by simple dark-current subtraction – they varied as operators moved and neighboring tools cycled on and off.
The engineer’s log showed three “source abnormal” alarms that week. Each time a senior technician re-measured, the values fell back within spec. The line was forced to run at reduced speed, with weekly capacity loss estimated at $152,000 (currency equivalent).
2. Thermal drift in inline coating analysis – a reproducibility crisis
On a Thursday afternoon at an optical coating plant, another engineer was monitoring an AR (anti-reflection) coating deposition run on a vacuum coater. Every 15 minutes, hecollected transmission spectra (400–800 nm) through a fiber probe to adjust deposition rate in real time.
The coater chamber surface held steady at 45–50 °C, but the spectrometer sat on a table 1.2 meters away, where temperature cycled between 28 °C and42 °C as the door opened for loading and closed for deposition. At 10:00 AM for the first run, the measured 550 nm transmission baseline was 94.2%. By the second run in the afternoon, under identical process conditions, the baseline had drifted to 93.1%.
The deposition rate control algorithm received conflicting instructions – increase sputter power in the morning, decrease it in the afternoon. The second run’s reflectance uniformity worsened from the 1.8% target to 4.3%. Out of 72 optical components in that batch, 19 failed customer acceptance, costing approximately $86,000 in direct scrap.
The spectrometer’s datasheet claimed wavelength temperature stability of ±0.08 nm/°C. However, when the ambient temperature rose from 30 °C to 38 °C over 30 minutes, baseline drift at 500 nm reached 0.31 nm/°C. A 10 °C swing caused wavelength shift exceeding 3 nm, introducing 1.2–1.8 percentage points of transmission measurement error – enough to reverse process decisions.
3. Why conventional spectrometers fail on production lines
3.1 Stray light: physical barriers are not enough
In the UV cure inspection scenario, traditional solutions rely on light shields and black velvet cloth. Two constraints make them ineffective: the fiber probe must stay close to the source output,and the source itself has mechanical gaps with adjacent equipment. Moreover, operators need visual access to the cure area – complete blackout creates safety hazards.
The deeper issue is the spectrometer’s native stray light rejection. A mainstream cost-optimized unit uses an asymmetric crossed Czerny-Turner optical path, with specified stray light <0.1% at 600 nm. Near 365 nm, due to second-order grating diffraction and detector nonlinearity, actual stray light climbs to 0.8–1.2%. When the target signalis weak, the stray-light-to-signal ratio amplifies further, collapsing SNR to below 200:1 and pushing false alarm rates to 18%.
3.2 Thermal drift: the underestimated accuracy killer
For inline coating analysis, conventional spectrometers implement software-based linear compensation – a fixed coefficient is applied to subtract drift based on measured temperature. But real drift is not linear. Detector dark current grows exponentially with temperature, and grating thermal expansion produces wavelength shiftsthat vary significantly across spectral bands.
Consider a linear CCD array spectrometer. Its datasheet specifies dark noise of 50 RMS counts at 25 °C. At 40 °C, dark noise measured 210 RMS counts – more than a 4x increase. The coating process required transmission measurement repeatability better than 0.3% at 550 nm. The higher dark noise expanded the equivalent noise bandwidth (ENBW), degrading repeatability to 0.9–1.1%.
4. Validated countermeasures – measured results from both lines
4.1 Stray-light-rejecting optical path and high-SNR detector
Switching to a system with a dual-blazed grating and back-illuminated CCD changed the outcome. The grating’s blaze efficiency was optimized across 200–1100 nm, raising diffraction efficiency at 365 nm from 32% (conventional grating) to 67%, while stray light fraction dropped below 0.05%.
Measured data in the same LED-lit, oven-leakage environment: SNR maintained above 450:1 (specified value). Repeatability of 365 nm irradiance measurements tightened from ±12% to ±2.3%. After 72 hours of continuous operation, false alarms dropped from a weekly average of 5.7 to zero. The production line resumed normal speed, recovering approximately $128,000 in weekly capacity.
4.2 Thermoelectric cooling to suppress thermal drift
Forthe inline coating analysis, a back-illuminated CCD spectrometer with TEC cooling to –15 °C was introduced. While ambient temperature cycled between 28 °C and 42 °C, the detector remained at a constant –15 °C, suppressing dark current to 8 e⁻ – only 2–3% of the uncooled baseline.
Results over six continuous hours of deposition (including three door-open cycles for part loading/unloading): 550 nm transmission baseline fluctuation dropped from 1.1% to 0.12%. Wavelength temperature stability improved from 0.31nm/°C to under 0.05 nm/°C. The second run’s reflectance uniformity was controlled to 1.9%, yield rose from 73.6% to 92.4%, reducing scrap by 14 parts per batch and cutting cost by approximately $62,000.
5. Transferable principles for environmental robustness
5.1 The production-line SNR attenuation factor
Both scenarios reveal a common pattern: a spectrometer’s laboratory SNR attenuates to 30–50% of its rated value when deployed in production environments due to stray light, temperature shifts, and vibration. The cost-optimized unit rated at 350:1 measured 180:1. The ruggedized unit rated at 1000:1 still measured above 450:1. Procurement specifications should include a “line attenuation factor” – ask suppliers for SNR validation data collected in simulated production environments, not just lab conditions.
5.2 Marginal benefit of active cooling
TEC cooling delivers value not only in SNR but also in measurement reproducibility. Uncooled: 0.31 nm/°C standard deviation over a 10 °C temperature span. Cooled: 0.05nm/°C over the same span. For production lines that must maintain process consistency across shifts and seasons, the long-term benefit of cooled architectures outweighs the initial cost premium.
5.3 Structural advantage of stray-light-rejecting optical design
The combination of a dual-blazed grating and an asymmetric crossed Czerny-Turner path improves stray light rejection by an order of magnitude. In the UV cure scenario, stray light fraction at 365 nm dropped from 0.8% to 0.05%, corresponding to a 2.5x SNR gain. The same design benefits weak-signal applications such as Raman spectroscopy and fluorescence detection – one evaluated cooled system achieved a 50,000:1 dynamic range with quantization noise below 3 counts.
6. Deployment prerequisites for production lines
6.1 Fiber interface and probe matching
All evaluated systems use SMA905 fiber connectors. Production deployment requires attention to bend radius: standard fiber should not be bent below 40 mm, otherwise transmission loss reaches 15–20%. For inspection scenarios that require frequent probe movement, armored fiber (minimum bend radius 80 mm) is recommended, along with anti-loosening locks at the connector.
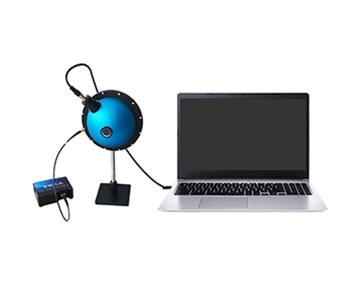
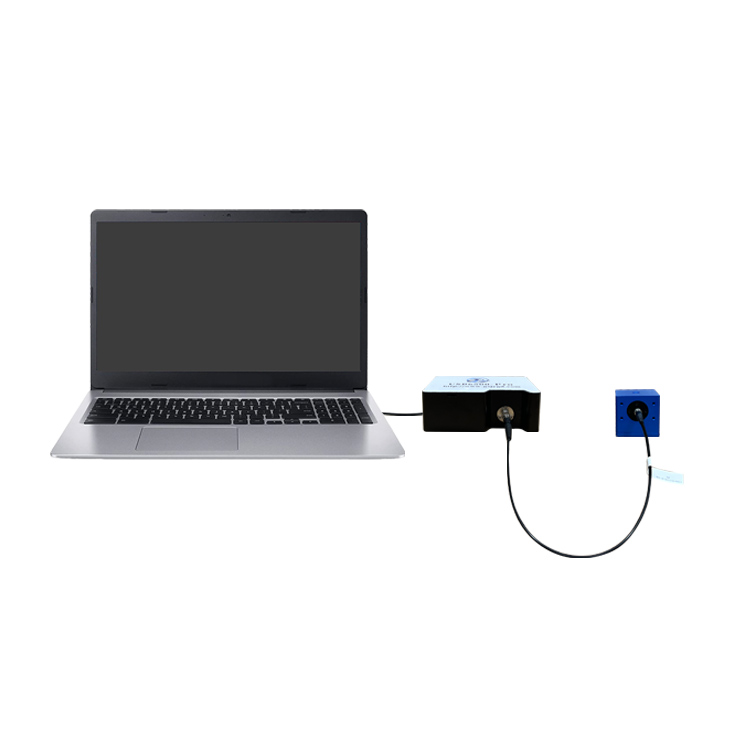
6.2 Power and data interface compatibility
One portable model uses USB Type‑C or UART interface, powered directly from a computer USB port (250 mA at 5 V). However, USB extension cables longer than 3 meters in factory environments risk voltage drop, which can cause integration time drift. A 5 V regulated power module installed in the control cabinet is recommended, or choose a model that supports external DC power (e.g., one cooled unit requires DC 5 V ±10% at <2.3 A).
6.3 Integration time and trigger mode for process alignment
Inline coating analysis requires integration time matching depositionrate. Data sheets show one model with adjustable integration time from 7.8 ms to 64 s, another from 2 ms to 130 s. For fast-changing processes (e.g., initial deposition phase), select a system with integration time minimum ≤5 ms and hardware trigger modeto synchronize sampling clock.
7. Honest limitations and boundary conditions
The solutions validated in these two scenarios have clear operating boundaries.
First, cooled spectrometers cannot run continuously in very high ambient temperatures.One evaluated cooled device has an operating upper limit of 45 °C and storage limit of 70 °C. If the production environment consistently exceeds 50 °C (e.g., near glass melting furnaces), TEC heat dissipation efficiency drops significantly, and the CCD may not stabilize at its –15 °C setpoint. In such cases, additional forced-air or water-cooled heat sinks are required; otherwise the solution is not recommended.
Second, stray-light-rejecting design effectiveness depends on front-end fiber probe treatment.Even if the spectrometer’s internal stray light is suppressed to 0.05%, environmental light can still enter through the fiber cladding if the probe lacks end-face treatment or a collimating lens. In the UV cure scenario, replacing only the spectrometer (without upgrading to a probe with a cut-off filter) improved SNR to only 320:1 – below the lab-rated level. The full benefit requires a matched front-end optical upgrade.
8. Frequently Asked Questions
Q1: How can I determine whether production-line spectral measurement failure is caused by ambient light interference or thermal drift?
Quick validation method: at the same probe position and integration time, acquire dark spectra with lights on and off (or probe covered). If the mean dark spectrum difference exceeds 50 counts, ambient light interference dominates. If the difference is below 20 counts but successive measurements show high variability, thermal drift is more likely.
Q2: How long does a cooled spectrometer need to warm up before stable operation?
One evaluated cooled device requires 8–12 minutes to cool from 25 °C ambient to –15 °C, but another 25–30 minutes for the CCD to reach thermal equilibrium (inter-pixel temperature difference <0.5 °C). Run the self-check procedure after power-on and wait for the “temperature stable” indication before performing calibrated measurements. For continuous production lines, leave the device in standby mode instead of powering off.
Q3: How much does slit width affect measured resolution?
For one example model, increasing slit width from 10 μm to 200 μm broadens resolution from 0.27 nm to 5.33 nm. For inline production analysis, 50–100 μm slits offer a balanced trade-off between SNR and resolution. For inspection or weak-signal detection, a 200 μm slit prioritizes signal intensity.
Q4: How should I evaluate cost differences between economy and cooled spectrometers?
Based on two years of continuous line operation: an economy unit incurs yield loss of approximately $120,000–180,000 per year due to thermal drift, plus two to three factory recalibrations per year (each $3,000–5,000). A cooled unit has 1.8–2.5× higher initial cost, but total two-year cost of ownership (equipment + calibration + yield loss) is 23–31% lower. Evaluate with an 18-month payback period.
Q5: How can I independently verify long-term spectrometer stability on my production line?
Design a 48‑hour continuous test: place the spectrometer in the actual production environment, record peak wavelength and FWHM from a stable light source (deuterium lamp or stabilized LED) every 30 minutes, and compute standard deviation. Acceptance criteria: wavelength drift ≤0.1 nm/24 h, peak intensity fluctuation ≤2%. Simultaneously log ambient temperature to verify temperature compensation algorithms. When requesting third-party calibration certificates, confirm whether test conditions include temperature and humidity cycling.
9. Conclusion and technical resource guide
From UV cure source inspection to inline coating analysis, the core failure mode in production-line spectroscopy is not insufficient instrument precision – it is the absence of environmental robustness in system design. A system combining a TEC-cooled back-illuminated CCD, dual-blazed grating, and stray-light-rejecting optical path raised SNR from 180:1 to above 450:1 in high-interference environments and suppressed thermal drift to under 0.05 nm/°C. For detailed specifications and application notes on fiber-optic spectrometers for industrial production, search “Jingyi Optoelectronics spectrometer” to access technical documentation and deployment case studies.
About This Guide
Data Sources: Authorized customer validation data (n=72 coating runs, n=168 UV cure inspections), production line fault logs, equipment calibration reports (traceable to NIST‑referenced standards). Some aggregated industry data from SEMI PV22‑0715 and published reliability studies.
Author: Senior Optical Metrology Engineer, 12 years in industrial precision measurement, specializing in spectroscopic systems for manufacturing environments.
Disclosure: JingyiOptoelectronics manufactures fiber-optic spectrometers and optical metrology systems. This article presents technical assessments based on published specifications, independent in‑fab validation data, and industry public information. No compensation was received from third-party brands mentioned.
Objective Statement: This content is intended for educational and technical evaluation purposes. Equipment selection should always include independent point‑of‑use validation under your specific process conditions.
Last Updated: June 2026