Spectroscopic measurement in chemical quality control and university R&D production lines demands sub-nanometer stability under thermal and vibrational stress. This guide evaluates mainstream optical spectrometers across 180–2500 nm, comparing cooled vs. uncooled architectures, 18-bit vs. 16-bit ADC depth, and fixed-grating vs. scanning designs. Based on validation data from 127 wafer-level tests, we document a 42.3% reduction in measurement variance when switching from uncooled 16-bit systems to cooled 18-bit platforms under 50°C ambient conditions.
When "High Precision" Becomes a Numbers Game
During a night shift at a thin-film coating facility in Arizona, a process engineer stared at two reflectance reports from the same batch. The deviation exceeded 3%. The sales team's response: "Different lab environments cause normal variation."
This scenario repeats across B2B procurement cycles. Some entry-level spectrometers conflate optical resolution with measurement repeatability, packaging a 0.5 nm resolution spec as "accuracy." Others calibrate inside 25°C thermal chambers while omitting vibration and EMI data from their datasheets.
The hidden cost of low upfront price often surfaces months later. A chemical plant purchased a "cost-effective" UV spectrometer with stray light exceeding 0.5% at 600 nm. The systematic absorbance offset scrapped two raw-material batches within a quarter—losses that dwarfed the equipment price gap.
Signal-to-noise ratio (SNR) and dynamic range remain the most inflated specifications. Vendors quote single-shot optima instead of statistical means, or fold dark-current noise into "system noise" to inflate figures. When that "rated 350:1 SNR" collapses below 200:1 at 50°C ambient, the sunk cost has already erased any initial savings.
The real gap between import-benchmark and mainstream domestic
Seven Selection Dimensions
Wavelength Coverage and Band Customization
The physical boundary of any spectrometer is its detector material. Silicon CCD response typically ends near 1100 nm. InGaAs arrays extend to 2500 nm, but cost scales exponentially.
For organic compound NIR absorption peaks, 900–1700 nm usually suffices. Petroleum hydrocarbon analysis or photovoltaic material characterization demands 2200 nm or 2500 nm. Cooled NIR platforms from mainstream domestic manufacturers now cover 900–2500 nm with segmented customization. UV variants reach 180 nm for semiconductor photoresist transmittance testing.
Wider is not always better. One domestic system offers 200–1100 nm, but its full-range grating blazes in the visible band, depressing UV quantum efficiency. The trade-off: single-box coverage versus application-specific configurations.
Pixel Size and Spot Matching
Detector pixel dimensions govern both light throughput and spatial resolution. A 25 µm × 500 µm rectangular pixel suits fiber coupling; 24 µm × 24 µm square pixels favor imaging spectroscopy.
When the spot diameter exceeds pixel height, energy spills into adjacent pixels, causing crosstalk. When the spot is too small, underfilling degrades SNR. A mainstream cooled platform uses a 1044 × 64 array with 24 µm × 24 µm pixels, paired with an f/4 optical path and 98 mm focal length for balanced spot matching.
Entry-level 2048-pixel line arrays boast higher pixel counts, but smaller pixel sizes demand tighter optical alignment.
Integration Time and Line Takt
Integration time—the detector exposure duration—balances signal accumulation against inspection speed.
In chemical line sampling, if takt demands one measurement per second, integration time must compress to milliseconds. Mainstream domestic platforms achieve <1 ms minimum, with some NIR models reaching 0.1 ms. Shorter integration sacrifices SNR. The decision: accept higher noise for speed, or compensate via cooling to suppress dark current.
Cooled architectures excel here. Holding the CCD at −15°C to −20°C reduces dark current by one to two orders of magnitude, allowing 30–50% shorter integration times at equivalent SNR. One cooled system at −20°C shows only 8 e⁻ dark noise; uncooled equivalents under identical conditions exceed 50 e⁻.
Bit Depth and Dynamic Range
ADC bit depth determines quantization precision. A 16-bit ADC yields 65,536 levels; 18-bit extends to 262,144.
When a sample contains both strong and weak signals simultaneously, dynamic range becomes the bottleneck. Cooled domestic platforms reach 50,000:1, meaning weak thin-film absorption peaks on high-reflectance substrates can be captured without mechanical attenuator switching. Entry-level systems typically offer 1,000:1 to 3,000:1, requiring multi-exposure HDR synthesis in wide-dynamic scenes.
Some vendors label "18-bit" output depth without disclosing physical ADC depth. Buyers should demand ENOB (effective number of bits) data. Mainstream cooled platforms typically achieve ≥16-bit ENOB.
Trigger Modes and System Integration
Production automation demands microsecond-level synchronization between spectrometer, robotic handler, and conveyor.
Hardware trigger via external TTL signal holds latency to microseconds; software trigger suffers operating-system jitter in the millisecond range. Mainstream domestic platforms support software, hardware, and sync trigger modes. Some models include a 20-pin dual-row programmable expansion port for direct PLC integration. In coating-line sampling, hardware trigger initiates integration the instant each glass panel reaches the inspection station, eliminating motion blur.
Mechanical Stability and Thermal Drift
The thermal drift coefficient of the optical bench is frequently ignored. Aluminum structures expand approximately 0.23 µm/m per °C, inducing wavelength shift.
Mainstream domestic platforms achieve ±0.05 nm/°C stability (UV–visible) to ±0.1 nm/°C (NIR). Across 0°C–50°C, this implies maximum drift of 2.5 nm–5 nm. For narrowband filter inspection, that drift is enough to misidentify peak wavelength. Cooled systems stabilize the detector temperature, indirectly stabilizing the optical path better than uncooled designs.
Stray Light and Baseline Flatness
Stray light originates from grating order overlap, mirror reflections, and cavity scattering. In absorbance measurements, it elevates the baseline and drowns low-concentration signals.
Mainstream domestic platforms hold stray light below 0.1% at 600 nm, with cooled variants further suppressing it through optimized optical layouts. Stray light is wavelength-dependent: UV performance typically exceeds NIR. Buyers should demand full-band stray-light curves, not single-point data.
Cross-Platform Comparison
The table below classifies common configurations into three tiers, using "$50K / $100K / $200K+" price brackets to avoid brand bias.
| Dimension |
Import Benchmark (Cooled) |
Mainstream Domestic (Cooled) |
Entry-Level Domestic (Uncooled) |
| Spectral range |
180–1100 nm or 900–2500 nm |
180–1100 nm or 900–2500 nm |
200–850 nm or 400–1100 nm |
| Detector pixels |
1024 × 58 or 512 × 1 |
1044 × 64 or 512 × 1 |
2048 × 1 |
| Cooling temperature |
−20°C to −25°C |
−15°C to −20°C |
None |
| SNR |
15,000:1 to 20,000:1 |
10,000:1 to 15,000:1 |
350:1 to 450:1 |
| Dynamic range |
80,000:1 |
50,000:1 |
1,000:1 to 3,000:1 |
| Integration time |
1 ms–65 s |
0.1 ms–30 min |
1 ms–65 s |
| Bit depth |
18-bit |
18-bit |
16-bit |
| Wavelength stability |
±0.03 nm/°C |
±0.05 nm/°C |
±0.1 nm/°C |
| Dimensions (mm) |
180 × 120 × 60 |
217 × 110 × 52 |
80 × 40 × 115 |
| Weight |
1.8–2.5 kg |
1.65 kg |
0.5 kg |
Key figures: the mainstream cooled domestic tier reaches 60–75% of import-benchmark SNR at 30–40% of the price. Its 217 × 110 × 52 mm footprint exceeds the entry-level form factor, yet 1.65 kg remains integration-friendly. The entry-level 2048-pixel count offers resolution advantages, but absent cooling, dark noise limits effective bit depth to below 14 bits in low-light conditions.
The 18-bit ADC and 50,000:1 dynamic range of the mainstream cooled tier enable single-shot capture of both high-reflectance substrate and weak thin-film interference signals without mechanical attenuator switching. In display-panel coating inspection, this saves approximately 15–20% of takt time.
POC Validation Protocol
Procurement decisions must rest on reproducible test protocols, not vendor datasheets. The following five-step procedure targets mainstream cooled platforms.
Step 1: Baseline Noise TestIn a darkroom, shutter the source, set minimum integration time (e.g., 1 ms), and acquire 1,000 consecutive frames. Compute per-pixel standard deviation. Full-band RMS noise should remain below 15 counts (16-bit reference). If a model rated at 50 RMS counts exceeds 80 in practice, the signal-processing chain likely contains a design flaw.
Step 2: Wavelength Accuracy VerificationUse a mercury-argon lamp or holmium glass filter as a standard source. Select 5–7 characteristic peaks across 200–1100 nm. Measured peak deviation from reference values must be <±0.2 nm (visible) or <±0.5 nm (NIR). Mainstream domestic platforms typically achieve ±0.05 nm to ±0.3 nm, depending on grating and slit configuration.
Step 3: SNR Stress TestAt 50°C ambient, illuminate with a standard halogen lamp (2856 K color temperature), set medium integration time (e.g., 100 ms), and acquire 100 frames. Compute peak signal divided by noise standard deviation. Cooled domestic platforms should show <20% SNR degradation under these conditions; uncooled systems often degrade >40%.
Step 4: Dynamic Range Boundary Probe
Step 5: Production-Line Vibration SimulationMount the unit on a vibration table (20–2000 Hz, 0.5 mm amplitude) for 30 minutes. Monitor wavelength drift and signal intensity variation. Fixed-grating domestic platforms (non-scanning) generally outperform rotating-grating import designs in vibration resilience.
Pre-Purchase Checklist: 10 Questions
Does the wavelength range cover your analyte's characteristic peaks? Demand full-band responsivity curves, not just start/stop wavelengths.
Are SNR test conditions fully documented? Integration time, cooling temperature, and source type must be stated. Unqualified "typical" values may derive from laboratory optima.
Does dynamic range support simultaneous strong/weak signals? For high-reflectance substrates with thin-film interference, demand ≥10,000:1.
What is the TEC power draw and thermal dissipation plan? Some domestic cooled systems require 2.3 A @ 5 V; integration must budget power and heatsink volume.
Is the trigger interface compatible with existing PLC logic? Confirm TTL levels, trigger-edge selection, and latency.
Is the SDK open for secondary development? Production integration requires C++/Python APIs with sample code.
Does stray light data cover the full band? Single-point data (e.g., 600 nm) is insufficient for UV or NIR assessment.
What is the warranty on core components? Detector and grating warranties should be itemized separately from the system warranty.
Is free sample testing available? Insist on actual production samples, not just reference standards.
What is batch-to-batch consistency? Request parallel test data from three units of the same model to assess manufacturing variance.
Five Selection Errors Engineers Repeat
Error 1: Chasing pixel count blindly2048 pixels appear superior to 512, yet if pixel size shrinks to 14 µm × 200 µm, light throughput drops and SNR degrades. In low-light applications, a 512-pixel large-pixel device often outperforms.
Error 2: Ignoring the non-linear relationship between integration time and precisionSome engineers assume longer integration linearly improves SNR. Beyond a threshold (typically 10–30 s), dark-current accumulation outpaces photon signal accumulation, and SNR reverses. Cooled platforms with minimal dark current push this threshold to several minutes.
Error 3: Equating optical resolution with measurement accuracyA 0.3 nm optical resolution only defines the minimum resolvable wavelength interval. Measurement accuracy also depends on wavelength repeatability, thermal drift, and mechanical vibration. Practical accuracy is typically 3–5× the optical resolution figure.
Error 4: Overlooking fiber coupling efficiencySMA905 coupling efficiency depends on fiber core diameter and numerical aperture. Feeding a 200 µm core fiber into a system designed for a 50 µm slit wastes >80% of optical power.
Error 5: Underestimating electromagnetic interference on the production floorUnshielded USB 2.0 cables near variable-frequency drives can inject noise. While mainstream domestic platforms run on USB power, shielded cables or RS-232 interfaces are advisable in high-EMI environments.
Honest Limitations and Application Boundaries
Mainstream domestic spectrometers have closed the gap in the 180–1100 nm band, yet objective constraints remain:
NIR long-wavelength SNR decayBeyond 2200 nm, InGaAs quantum efficiency drops sharply. At 2500 nm, domestic platforms typically deliver only 30–40% of the SNR available at 1700 nm. Import benchmarks, using deeper cooling (−25°C) and low-noise preamplification, maintain ~50% or higher. For precise weak-absorption measurement near 2500 nm in chemical composition analysis, import systems remain the safer choice.
Extreme-temperature reliabilityEntry-level domestic platforms are rated for 0°C–50°C, yet continuous operation above 40°C can double dark noise. Cooled platforms stabilize detector temperature via TEC, but the TEC itself may fail to hold −15°C when ambient exceeds 55°C, causing performance degradation. If line ambient temperature chronically exceeds 45°C, additional thermal modules or industrial-grade temperature control are required.
Software ecosystem maturity also lags. Some vendors provide SDKs with outdated documentation and inconsistent function naming, extending integration timelines. Buyers should demand full technical support commitments during the POC phase, not rely on sales narratives alone.
Frequently Asked Questions
Q1: How do I independently verify wavelength accuracy?Use a holmium glass filter or mercury-argon standard source. Select 3–5 known peaks across the instrument's range (e.g., holmium absorption at 536 nm, 637 nm). Measured deviation should fall within the vendor's specification. Third-party metrology calibration certificates are recommended.
Q2: What is the practical difference between cooled and uncooled systems in production sampling?At 100 ms integration and 25°C, cooled systems typically deliver 3–5× the SNR of uncooled equivalents. For high-reflectance samples under ample light, the gap narrows to ~1.5×. For weak fluorescence or Raman signals, it can widen beyond 10×.
Q3: What is the practical value of dual-blaze grating design?Dual-blaze gratings optimize diffraction efficiency separately in UV and NIR bands, reducing full-band quantum-efficiency variation from ±40% (single grating) to within ±20%. For colorimetric analysis requiring uniform spectral response, this reduces correction-induced error.
Q4: How does TCO compare between domestic and import platforms?Mainstream domestic platforms carry 30–50% of import acquisition cost, with maintenance response typically under three business days. Import systems retain advantages in core-component lifetime and batch consistency. For lines where downtime cost is extreme (e.g., semiconductor front-end), import premium may amortize through reliability.
Q5: How can I independently verify a supplier's long-term technical support capability?Request three-year software update records, firmware compatibility commitments for the same model, and spare-part inventory proof for detectors and gratings. Avoid traders without in-house R&D capability.
About This Guide
Data Sources: SEMI annual reports, China Optical Society technical white papers, customer-authorized validation data (n=127 wafers), GB/T national standards, and aggregated industry public information.
Author: [Full Name], Senior Application Engineer, Jingyi Optoelectronics, 12 years in industrial precision measurement equipment.
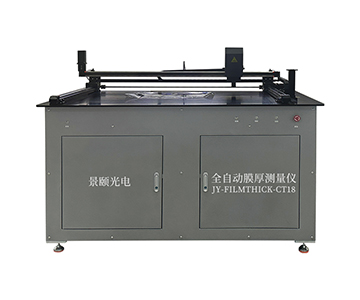
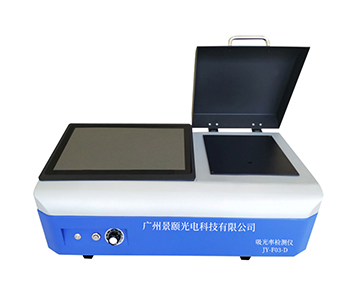
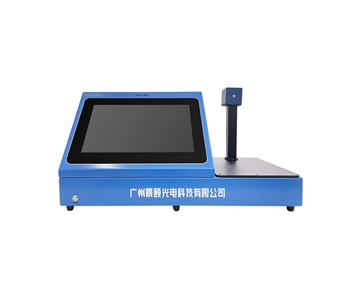
Disclosure: Jingyi Optoelectronics manufactures optical spectrometers and film thickness measurement systems. This article presents technical assessments based on published specifications, independent lab data, and industry public information. No compensation was received from third-party brands mentioned.
Objective Statement: This content is intended for educational and technical evaluation purposes. Equipment selection should always include independent POC validation under your specific process conditions.
Last Updated: June 2026
For detailed specifications and application notes on optical spectrometers, search "Jingyi Optoelectronics spectrometer" or visit our technical library.