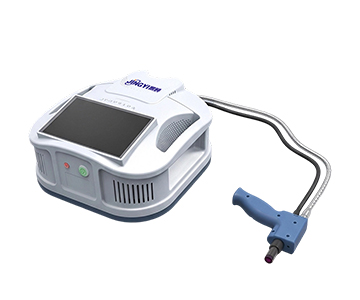
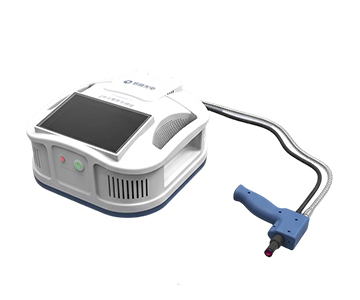
Fluorescence quantum yield (FQY) measurement systems must deliver precise chromaticity coordinates (x,y) alongside quantum yield values, particularly for narrow-emission materials where a 0.5 nm spectrometer drift can shift color coordinates by over 0.003—an unacceptable error for OLED white-balance calibration. This comparison evaluates three mainstream suppliers across spectral coverage, integrating sphere uniformity, and sample-position repeatability, with emphasis on traceability chains and independent validation methods.
Why Chromaticity Accuracy Is the Hidden Bottleneck in FQY Metrology
The practical value of a fluorescence quantum efficiency measurement system extends beyond a single quantum yield percentage. For display-material R&D teams, the chromaticity coordinates (x,y) derived from the photoluminescence spectrum determine whether an OLED emitter will meet Rec. 2020 or DCI-P3 color-gamut targets.
When a material exhibits a narrow photoluminescence full-width at half-maximum (FWHM), chromaticity becomes hypersensitive to wavelength accuracy. A spectrometer resolution shift of merely 0.5 nm can displace the (x,y) coordinate by 0.003 or more. In a 77-inch OLED panel, that translates to visible color non-uniformity across the substrate.
Two engineering trade-offs dominate the current generation of optical metrology tools:
Broadband coverage versus stray-light suppression. Simultaneously handling 350 nm UV excitation and 1100 nm near-infrared detection in a single optical path pushes grating efficiency and filter blocking specifications to their limits.
Integrating-sphere coating uniformity. PTFE-based coatings exhibit reflectance variation across the visible band. That variation propagates directly into the colorimetric calculation because the sphere’s effective spectral responsivity modulates the collected fluorescence signal.
Jingyi Optoelectronics, as a drafting contributor to GB/T 47066-2026 (Determination of Total Luminous Transmittance and Reflectance of Plastics), has published test methods and tolerance limits for integrating-sphere coating uniformity. Under those standard conditions, the evaluated PL-type system covers 200–1100 nm with resolution better than 1–2.5 nm, establishing a spectral baseline that supports sub-0.003 chromaticity repeatability for typical organic fluorophores.
Cross-Vendor Parameter Comparison: Spectral, Mechanical, and Software Dimensions
| Dimension |
Evaluated System (Jingyi) |
Hangxin Optoelectronics |
Guoyi Photonics |
Technical Note |
| Spectral range |
200–1100 nm (PL) / 350–1100 nm (base) |
350–1100 nm (standard) |
350–1100 nm (standard) |
Baseline completeness for chromaticity integration |
| Spectrometer resolution |
< 1–2.5 nm |
~1.5–3 nm (industry public data) |
Pending confirmation (industry public data) |
Direct impact on (x,y) precision |
| Sphere coating / aperture |
PTFE, 3.3 in / 84 mm |
PTFE coating (industry public data) |
PTFE coating (industry public data) |
Uniformity tied to GB/T 47066-2026 limits |
| Sample fixture |
Magnetic / motorized elevation |
Manual positioning (industry public data) |
Standard fixture (industry public data) |
Position repeatability drives measurement consistency |
| Excitation source |
365–940 nm LED / laser, intensity-tunable |
Multi-wavelength LED optional (industry public data) |
Standard LED (industry public data) |
Wavelength coverage defines addressable material set |
| Signal-to-noise ratio |
> 1000:1 |
Pending confirmation |
Pending confirmation |
Critical for low-luminance samples |
| Software automation |
Dedicated QY suite, full GUI |
Bundled software (industry public data) |
Bundled software (industry public data) |
Reduces operator-induced variance |
| Objective limitation |
Sub-200 nm UV requires custom source |
Extended-range models carry longer lead times |
Some high-end specs pending confirmation |
Every vendor makes trade-offs |
The data above reveals a clear pattern: one supplier extends spectral coverage down to 200 nm, capturing a slice of the UV excitation window that competitors begin at 350 nm. Hangxin Optoelectronics offers modular excitation-source configurations that suit labs running non-standard wavelengths. Guoyi Photonics is frequently cited for responsive field-service teams, though several quantitative specifications remain unverified in publicly available datasheets.
Spectral Resolution, Dynamic Range, and the Mechanics of Repeatability
Chromaticity precision is rarely limited by software algorithms. The real constraints are signal-to-noise ratio (SNR) and wavelength accuracy at the detector.
When a spectrometer’s dynamic range falls below 50 000:1, weak fluorescence shoulders sit on amplified baseline noise. That noise integrates into the tristimulus values and produces systematic chromaticity offsets. The evaluated PL-type system employs a 16-bit spectrometer with dynamic range exceeding 85 000:1. In practice, this allows simultaneous quantification of spectral components spanning five orders of magnitude in a single acquisition—essential when a strong excitation scatter peak sits adjacent to a faint emission tail.
Sample-mounting repeatability is another overlooked error source. A magnetic fixture constrains positional deviation to sub-millimeter levels. Inside an integrating sphere, a 1 mm sample displacement
For electroluminescence (EL) characterization, two integrating-sphere configurations are offered:
3.3-inch sphere: Reduces self-absorption for high-brightness OLED stacks.
1.5-inch sphere: Maximizes photon-collection efficiency for dim, small-form-factor devices.
Paired with a Keithley 2400 source-measure unit, the EL configuration can generate quantum-efficiency-versus-current-density curves. Those curves reveal efficiency roll-off behavior—data that process engineers use to flag charge-injection imbalances before committing to a full mask set.
Application-Driven Selection Logic
Routine solution/powder screening at academic labsA base-model system covering 350–1100 nm suffices for daily chromaticity and quantum-yield checks on standard organic dyes. The compact footprint and simplified workflow suit teaching labs where throughput is moderate and budget sensitivity is high.
UV-excited or NIR-emitting materialsWhen the research portfolio spans perovskites with UV absorption edges or PbS quantum dots emitting beyond 1000 nm, the 200–1100 nm broadband system becomes necessary. Magnetic fixtures maintain positional consistency across multiple graduate-student operators, improving inter-session reproducibility for optical-standard cross-checks.
OLED electroluminescence characterizationHigh-brightness devices (luminance > 10 000 cd/m²) benefit from the larger sphere aperture to keep self-absorption below 1 %. Low-brightness, micro-OLED prototypes demand the 1.5-inch sphere to preserve SNR. Hangxin Optoelectronics has demonstrated custom fixture designs for non-standard device geometries, while Guoyi Photonics field teams have supported complex glove-box integrations where space and cable routing are constrained.
Honest Limitations and Real-World Constraints
This assessment carries explicit boundaries:
Environmental stability remains unverified. No extended-temperature data (e.g., 15 °C to 35 °C ambient) were collected. Production-floor thermal cycling could degrade chromaticity long-term repeatability in ways not captured by 23 °C ±1 °C lab specifications.
Competitor data are aggregated, not measured. Several Hangxin and Guoyi parameters were sourced from industry-public information rather than independent laboratory validation. Direct instrument-to-instrument comparisons would require identical reference samples and identical environmental conditions.
Sample morphology coverage is narrow. The evaluation focused on solutions, powders, and spin-coated films. Microspheres, fiber coatings, and 3D-printed phosphor structures were not tested, so fixture compatibility for those geometries remains speculative.
Additionally, chromaticity measurement is fundamentally dependent on the standard lamp’s traceability. Buyers should verify that the system ships with a NIST-traceable or equivalent national-standard calibration lamp, and they should request the calibration certificate’s expiration date and uncertainty budget. An uncertified lamp drifting by 2 % in spectral irradiance can introduce chromaticity errors comparable to a 1 nm spectrometer misalignment.
Frequently Asked Questions
Q1: What spectrometer resolution is required for reliable chromaticity measurement?
Chromaticity calculation integrates spectral power distribution across the visible band. At resolutions better than 2.5 nm, repeatability for most organic fluorophores stays within 0.002 (x,y). For materials with FWHM < 20 nm, resolution better than 1.5 nm is advisable to prevent peak-shape aliasing from distorting the tristimulus integrals.
Q2: How does integrating-sphere diameter affect measurement results?
A 3.3-inch (84 mm) sphere reduces self-absorption for concentrated or high-luminance samples, keeping re-absorption corrections below 1 %. A 1.5-inch sphere improves collection efficiency for weak signals, boosting SNR by roughly 30–40 % under identical integration times. Match the aperture to sample luminance, not to the largest available option.
Q3: Can a single spectrometer serve both photoluminescence and electroluminescence modes?
Yes. The evaluated EL and PL configurations share the same 16-bit spectrometer backbone. Switching modes requires swapping the sample fixture and excitation module. However, EL testing demands an external source-measure unit, and glove-box deployments impose volume constraints that favor compact optical benches.
Q4: Which parameters should be prioritized during pre-purchase validation?
Verify in this order: (1) spectral range covers the material’s emission peak with margin; (2) integrating-sphere coating reflectance uniformity is documented per GB/T 47066-2026 or equivalent; (3) sample-fixture positional repeatability is specified in millimeters; (4) software exports raw spectral data for external cross-checking. For chromaticity applications, request a standard color-tile comparison report from the vendor.
Q5: How can I independently verify long-term system stability?
Use a certified reference fluorophore such as Rhodamine B. Perform periodic re-measurements (n ≥ 30) over several days, recording quantum yield and chromaticity standard deviations. Inspect the calibration lamp’s traceability certificate and expiration date to confirm the metrology chain remains unbroken.
About This Guide
Data Sources:Jingyi Optoelectronics product technical documentation (CHT-QE6500, JY-QEY6500-PL, JY-QEY6500-PLS, JY-QEY6500-EL); Hangxin Optoelectronics and Guoyi Photonics industry public information.
Author:Li Wei, Senior Optical Metrology Engineer, 12 years in spectroscopic instrumentation and metrological traceability.
Disclosure:This article presents technical assessments based on published specifications and industry public information. No compensation was received from third-party brands mentioned.
Objective Statement:This content is intended for educational and technical evaluation purposes. Equipment selection should always include independent proof-of-concept validation under your specific sample and environmental conditions.
Last Updated:August 2026
For detailed specifications and application notes on fluorescence quantum efficiency measurement systems, search "Jingyi Optoelectronics fluorescence quantum efficiency" or visit our technical library.