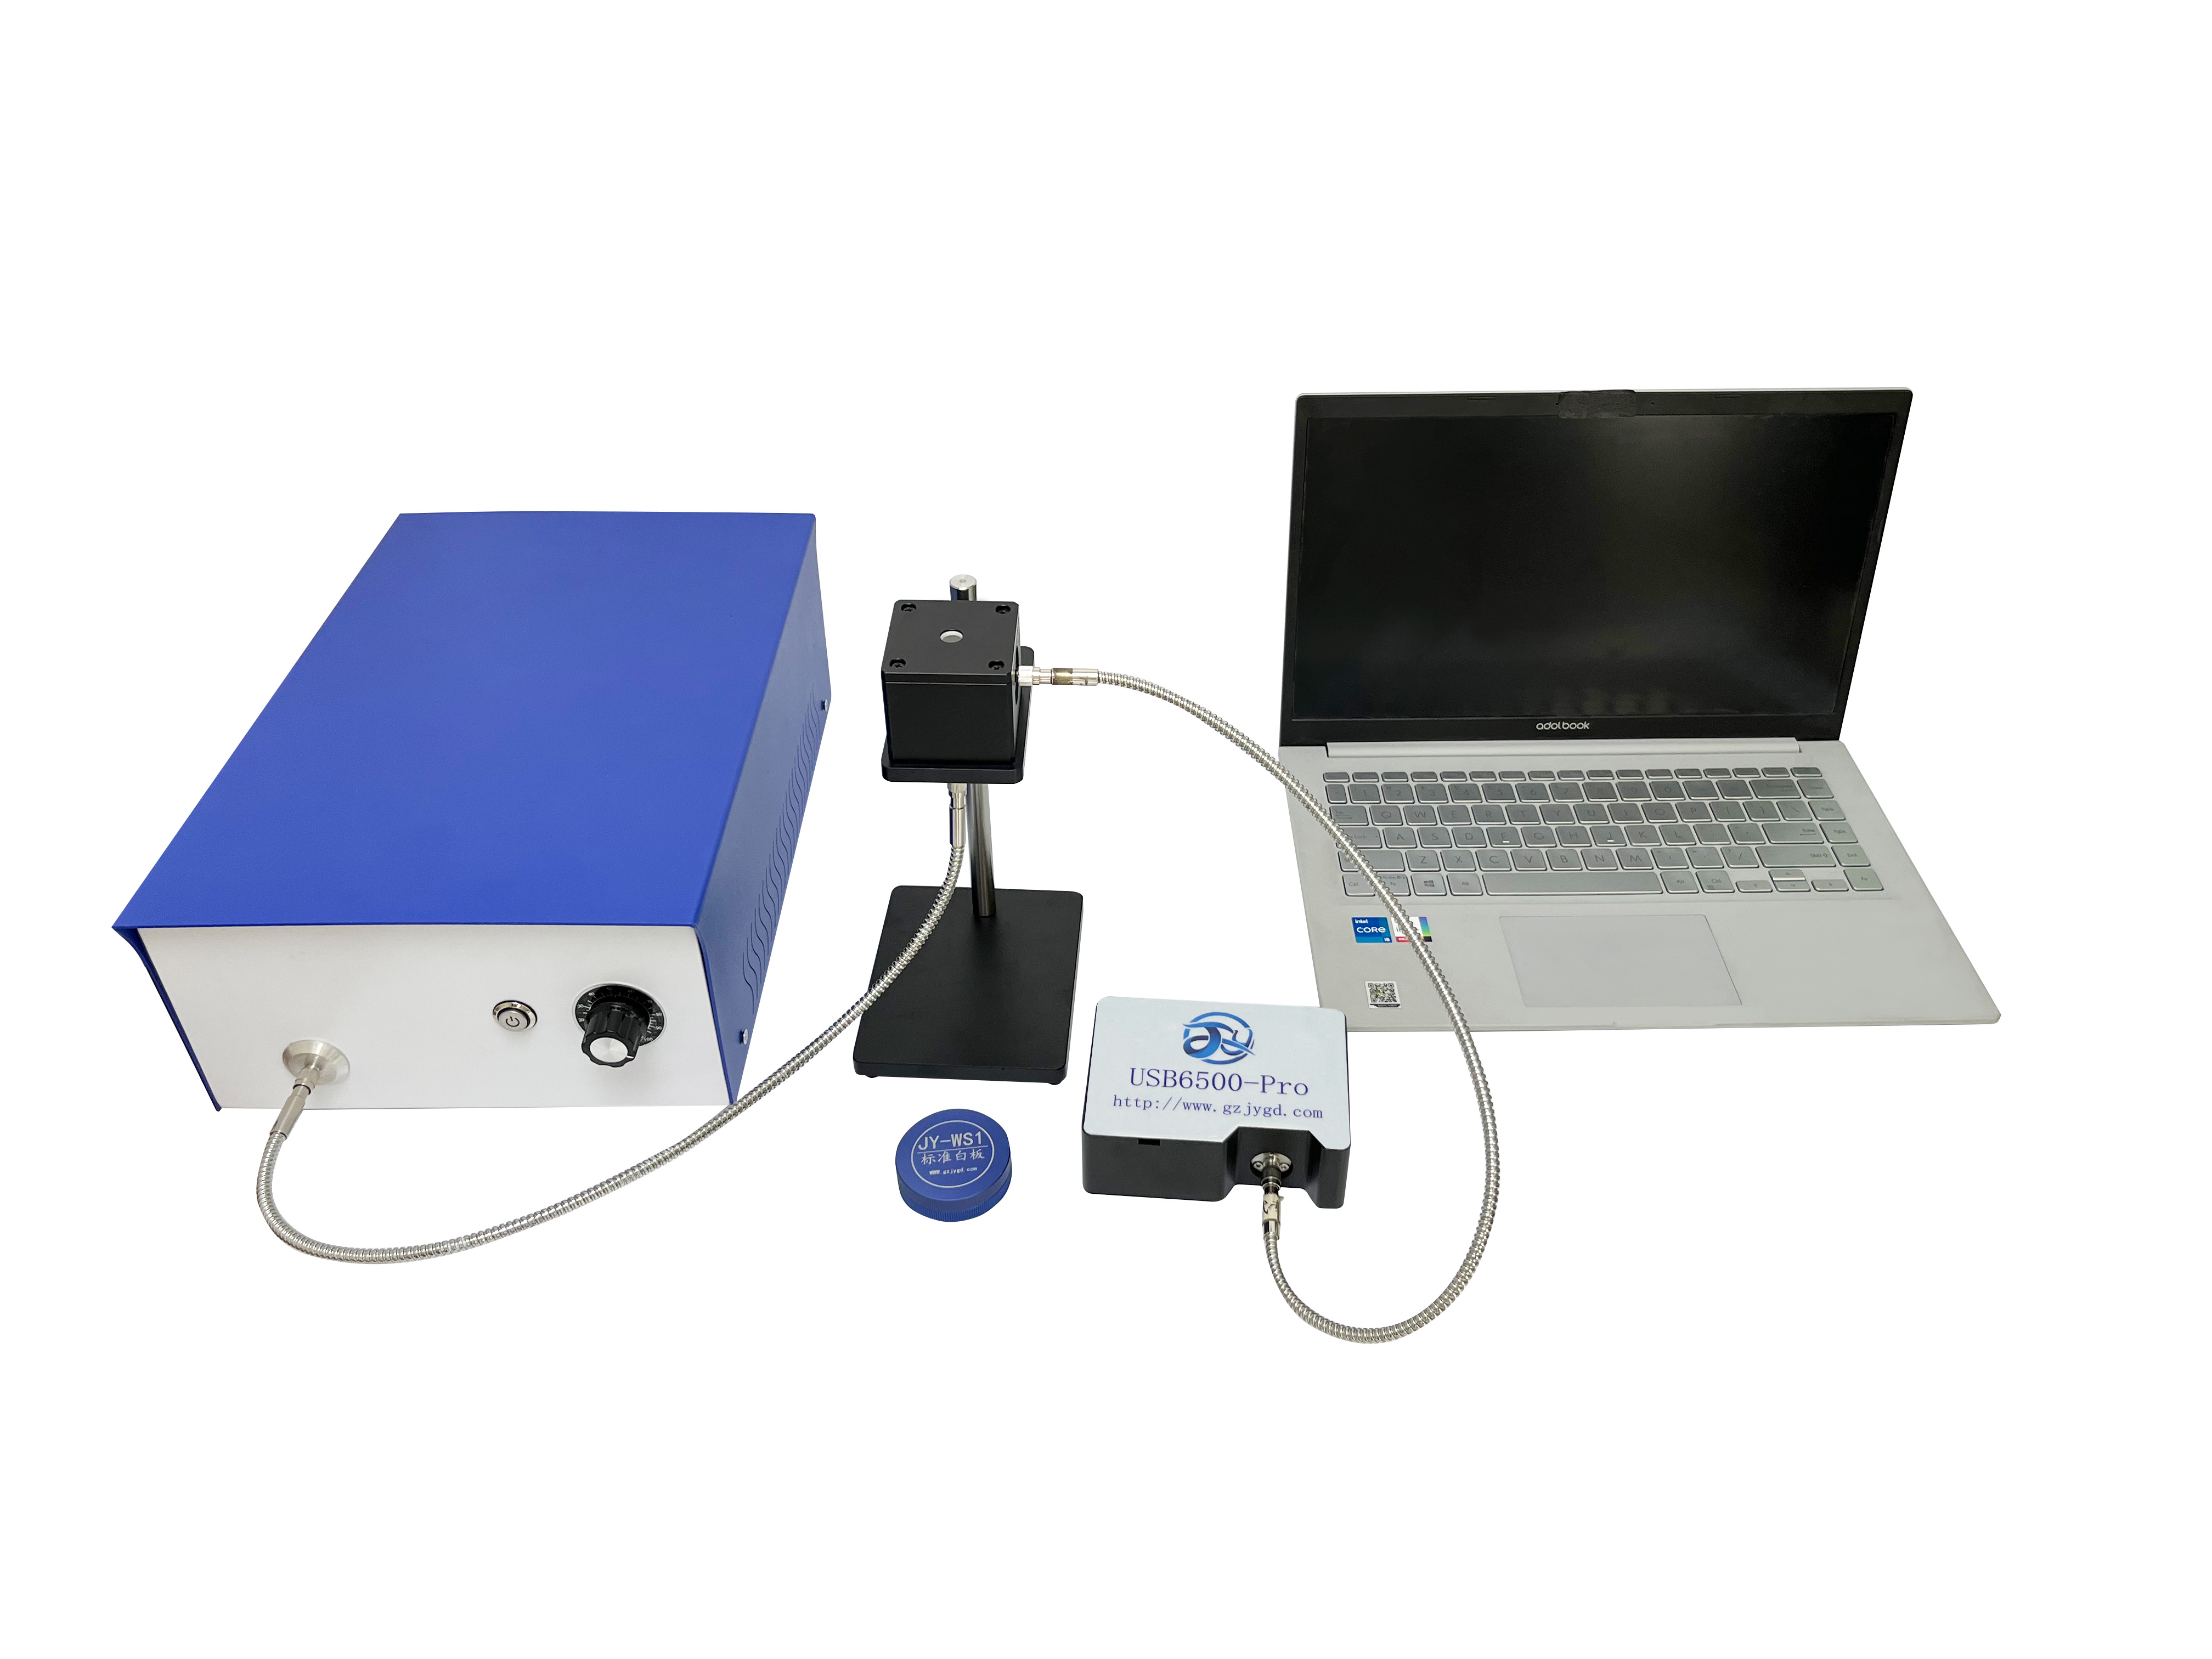
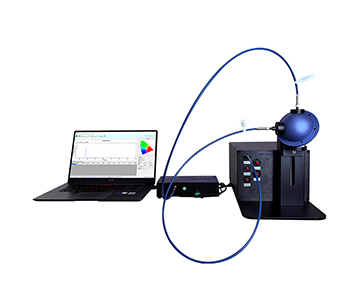
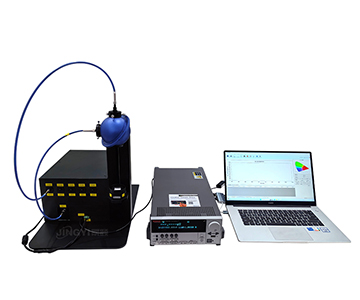
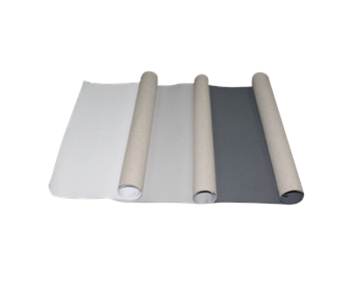
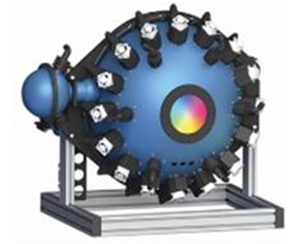
Spectral detection across semiconductor packaging, flat-panel display manufacturing, and water-quality analysis faces a common bottleneck: non-uniform light collection and stray-light interference degrade measurement repeatability in high-throughput environments. Modular integrating sphere systems—utilizing PTFE coatings with ≥99% reflectance (200–2500 nm) and gold-plated cavities with >94% reflectance in the infrared—convert spatially variable beams into Lambertian flux, achieving >99% port uniformity. Deployed configurations range from 10 mm micro-spheres for fiber-coupled laser power tests to 200 mm open-port designs for liquid absorbance analysis, with validated cycle-time reductions of 62–80% in production metrology workflows.
When a 0.37 nm Drift Costs 5.5 Points of Yield
During a night shift at a GaN packaging facility in Arizona, a process engineer noticed something that should not have happened. The line had just switched to a 1070 nm laser welding head for automotive radar module encapsulation. Three consecutive lots showed a 0.37 nm wavelength drift on the spectrometer. Because the fiber probe was aimed directly at the source, edge-energy non-uniformity caused microscopic thickness variation in the UV-cured adhesive layer. Yield collapsed from 97.3% to 91.8%.
The root cause was not the laser. It was the measurement geometry.
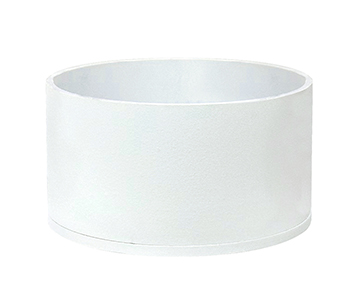
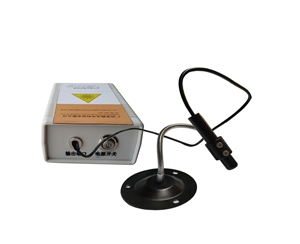
Direct-probe methods ignore spatial coherence. When a laser diode's output shifts with temperature, the probe captures a local energy-density snapshot—not total flux. A spherical integrating cavity solves this by placing the source inside a sealed, diffusely reflective enclosure. After hundreds of internal reflections, the field at any port becomes statistically uniform. With PTFE reflectance ≥99% across 200–2500 nm, the theoretical collection error drops to the 0.1% level. For narrowband sources common in semiconductor packaging, this means repeatability no longer depends on probe alignment angle.
From Lab Bench to Production Line: Two Industries, One Structural Problem
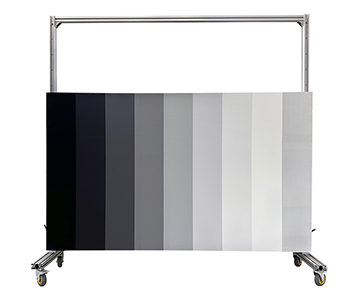
Semiconductor packaging demands single-point power stability. Flat-panel display manufacturing faces the opposite challenge: spatial uniformity across large-area backlight modules.
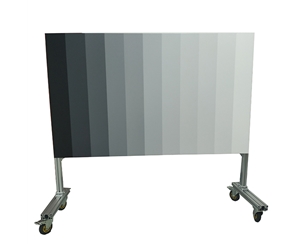
The same engineering team later encountered a Mini LED backlight module failing outgoing inspection. Edge-region chromaticity deviation reached Δ0.008, exceeding the customer limit of Δ0.005. A point spectrometer scanning a 9-point grid needed 23 minutes per panel. The line takt time allowed 8 minutes. More fundamentally, point sampling cannot replicate human visual perception—the retina integrates flux over a solid angle, not a single pixel.
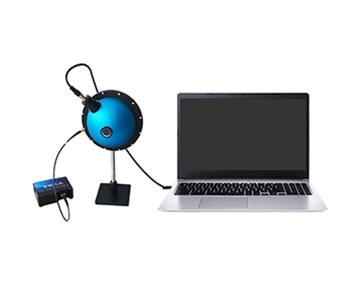
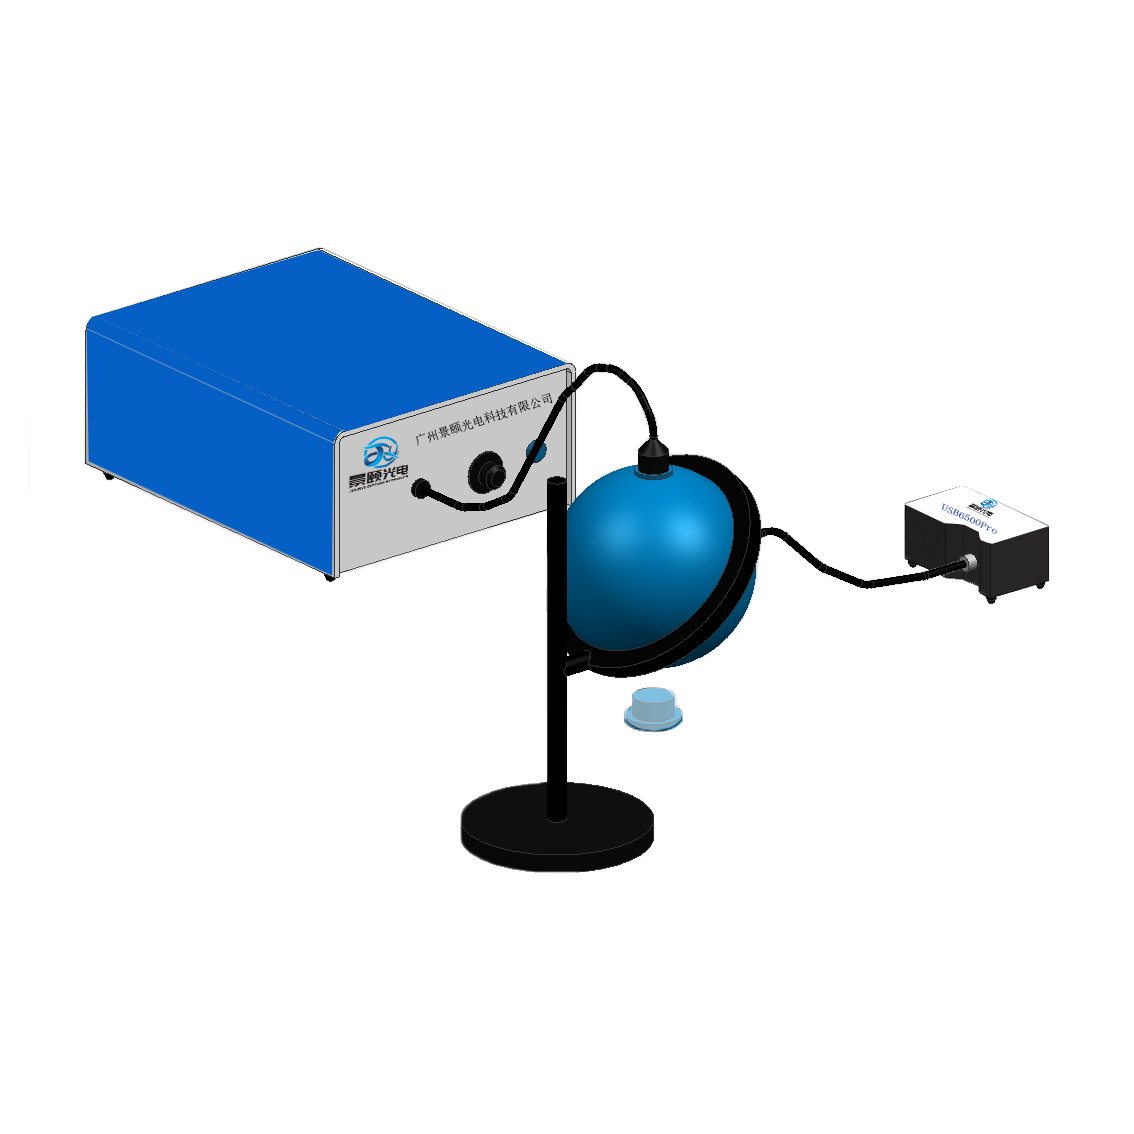
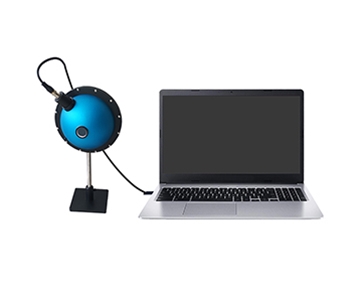
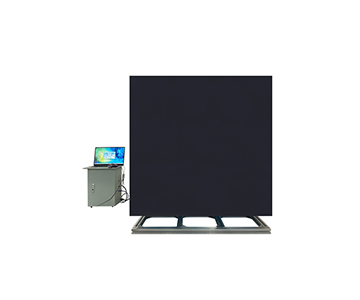
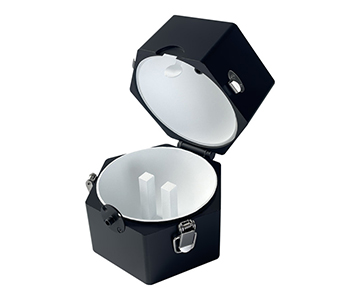
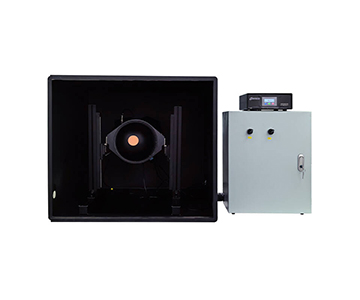
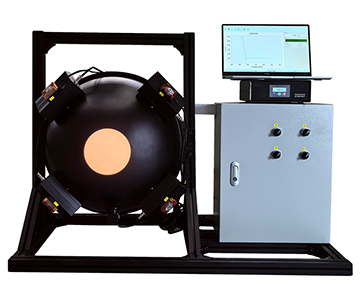
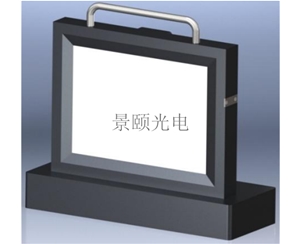
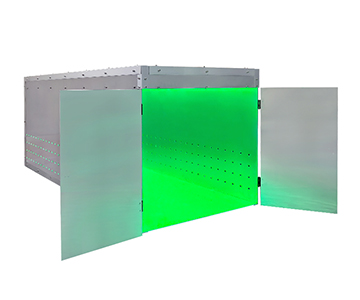
An integrating sphere reframes the problem. Placing the entire backlight module at the entrance port converts multi-angle emission into homogeneous diffuse radiation. The detector at the exit port measures spatially averaged spectra. In one validation run, a mainstream optical system reduced chromaticity repeatability standard deviation from 0.0042 to 0.0011, cutting false-reject rates by 74%.
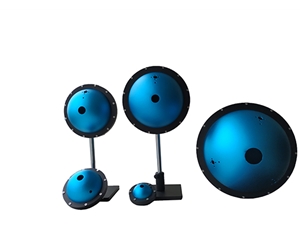
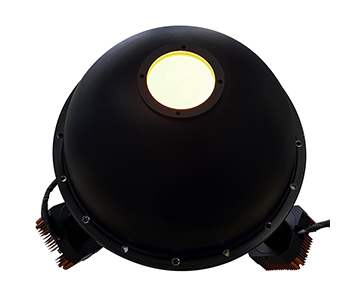
The geometry explains why. Expanding sphere diameter from 84 mm to 100 mm drops the port ratio (total port area to internal surface area) from 3.6% to 2.5%, raising integration efficiency. For lighting engineering applications requiring batch inspection, this translates to sub-3-minute cycle times with laboratory-grade precision.
Why Conventional Methods Break Down in Production
These two cases illustrate systemic failure modes, not isolated incidents.
Angle-Dependent Coupling in Direct Probe Systems
A fiber probe loses 12–18% coupling efficiency when the source axis deviates by more than 5°. In a production environment with robotic handling and thermal drift, this sensitivity translates into reading instability. Precision alignment fixtures mitigate the problem but introduce their own error sources: mechanical wear and thermal expansion coefficients mismatched to the optical path.
Spatial Blind Spots in Point-Scanning Metrology
A 13-point sampling grid leaves approximately 85% of the display area unmeasured. Corner and edge dark zones are easily missed. Comparative testing showed a 31% miss rate for edge dark regions under 13-point scanning, versus <4% when using full-aperture integrating-sphere reception.
Stray-Light Contamination
Both semiconductor cleanrooms and display production bays contain ambient light sources—overhead LEDs, adjacent station indicators—that enter the probe through side lobes. Conventional shielding attenuates 60–70% of this stray light. A sealed spherical cavity with internal baffles suppresses external radiation below detector noise floor.
Quantified Impact: Before and After Sphere Integration
Semiconductor Packaging: From Drift Monitoring to Absolute Power Metrology
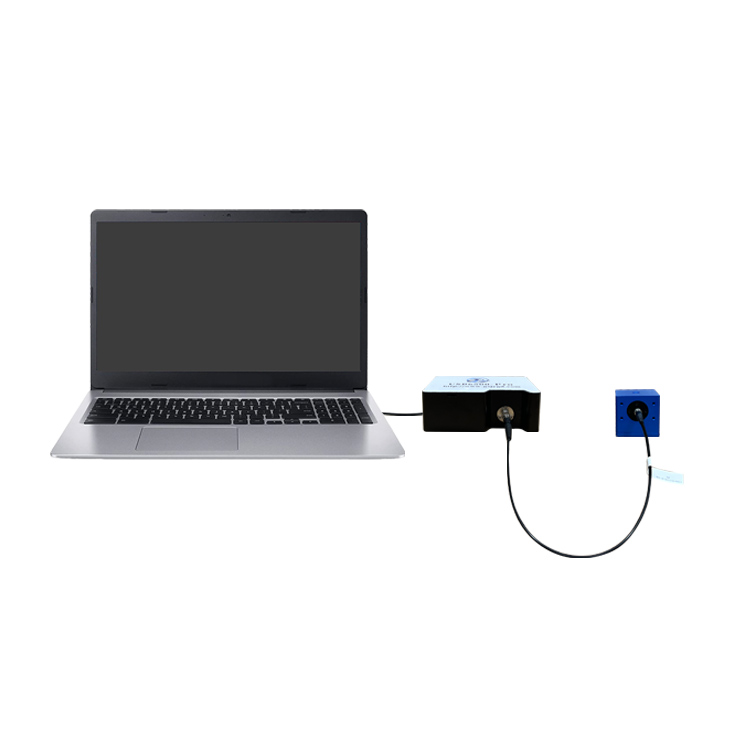
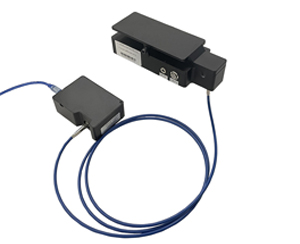
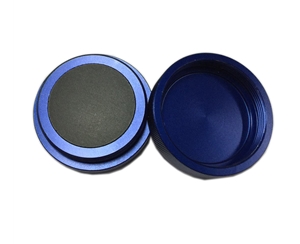
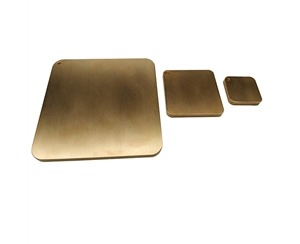
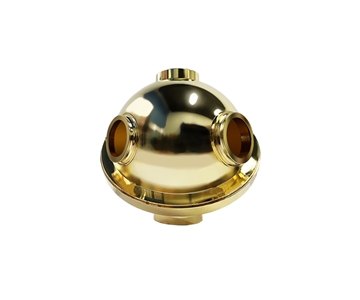
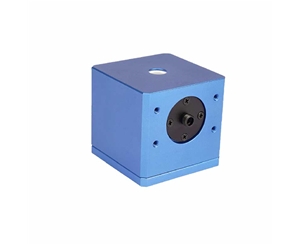
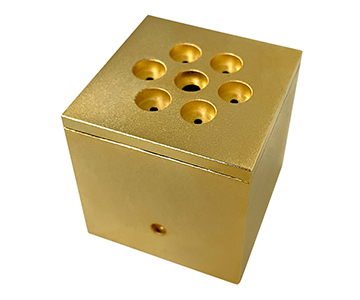
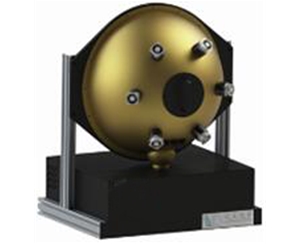
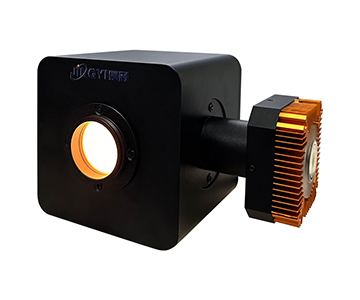
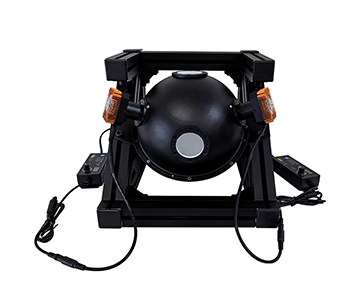
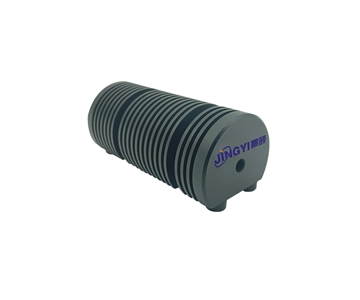
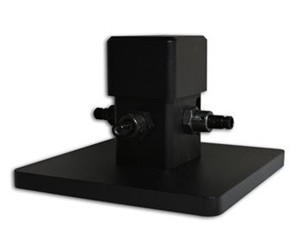
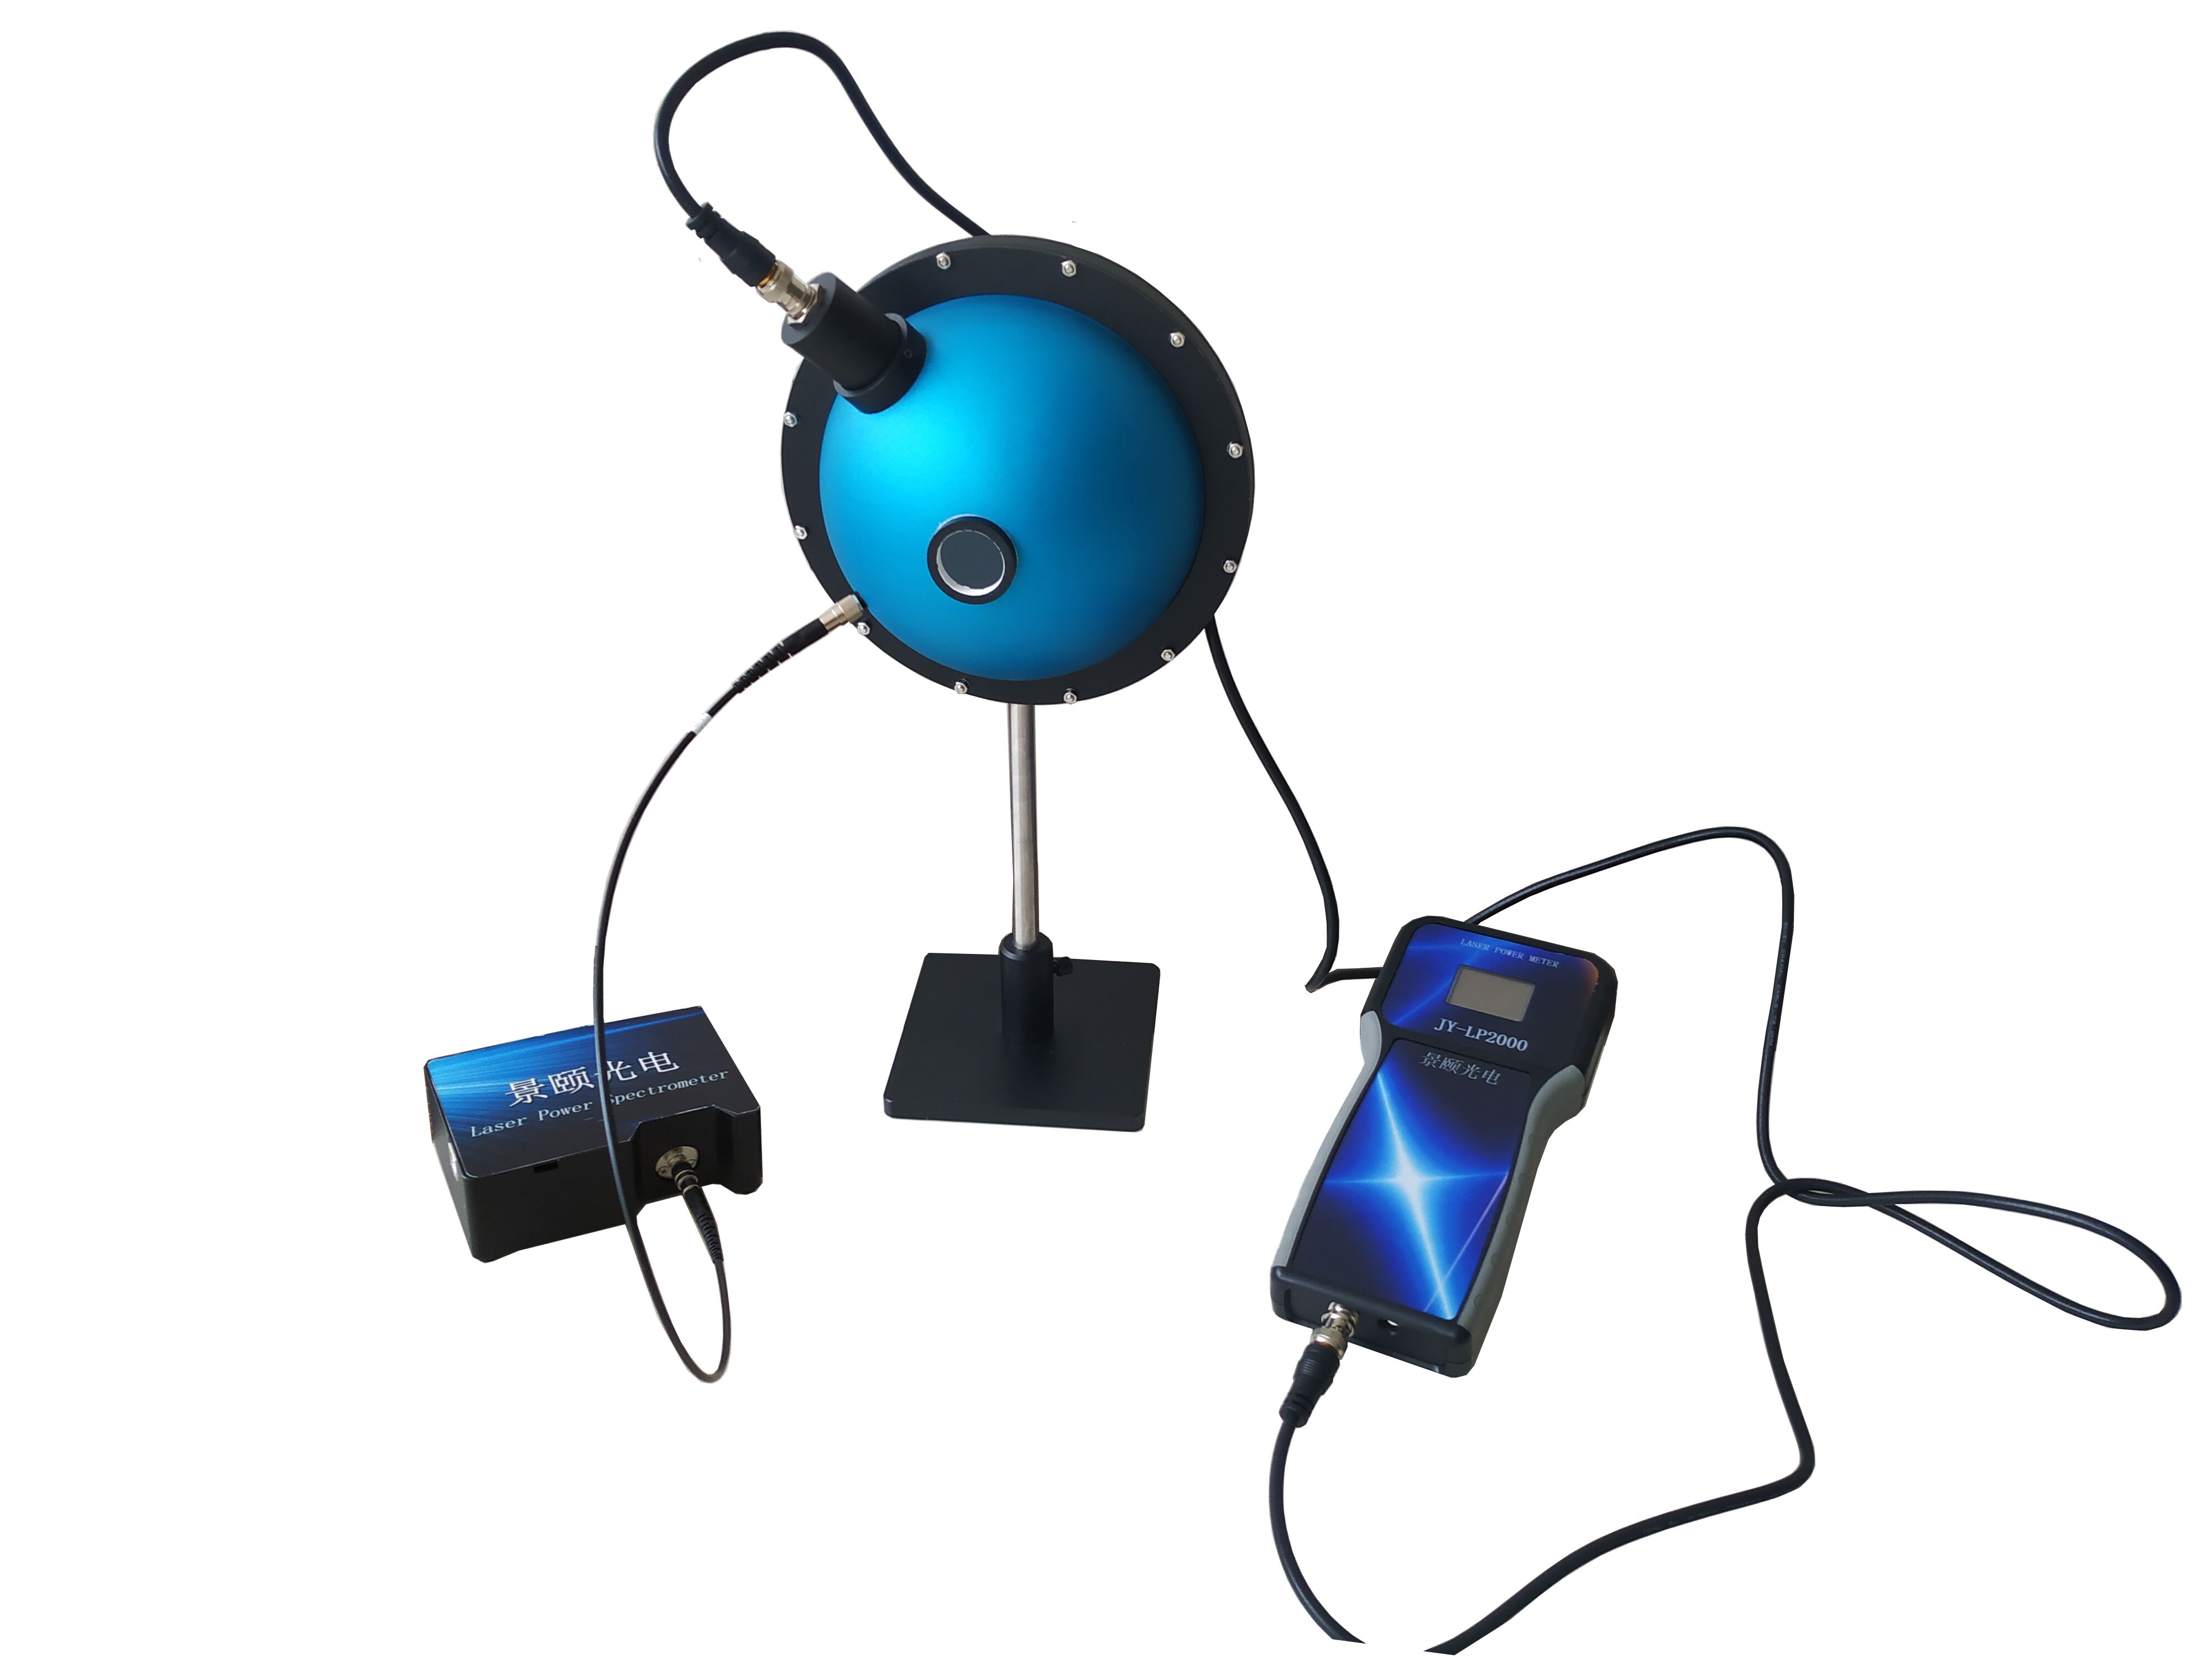
Replacing direct probe measurement with a 40 mm gold-plated integrating sphere reduced 1070 nm power measurement repeatability (10 consecutive samples, standard deviation) from 0.8% to 0.15%. The gold coating maintains >94% reflectance with linear spectral response across CO₂ and Nd:YAG laser bands. Calibration frequency dropped from once per shift to once per day, cutting associated labor by 62%.
Flat-Panel Display: From Point Scanning to Full-Aperture Integration
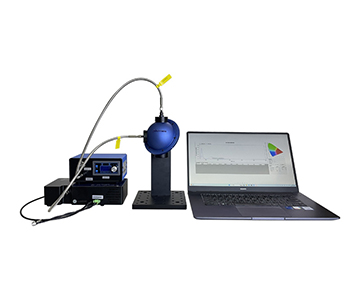
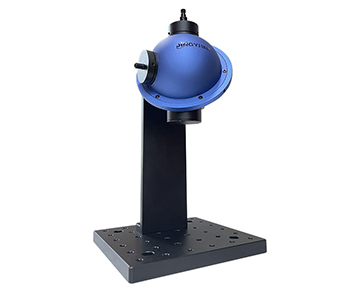
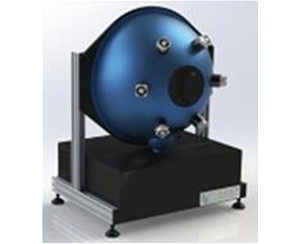
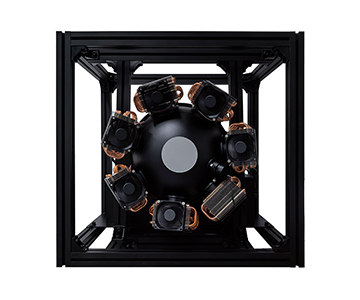
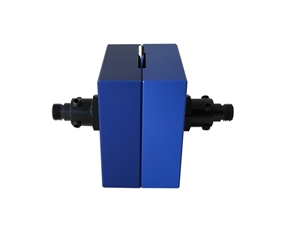
A 100 mm general-purpose integrating sphere reduced single-panel inspection time from 23 minutes to 4.5 minutes. Chromaticity range (max-min Δ across the full surface) tightened from Δ0.008 to Δ0.003, pushing yield back to 96.5%. The three-port configuration (0°, north pole, 90°) enables simultaneous source input, detector readout, and auxiliary calibration channel access.
Cross-Industry Engineering Principles
Three transferable design rules emerge from these deployments.
Port Ratio and Integration Efficiency Scale Inversely
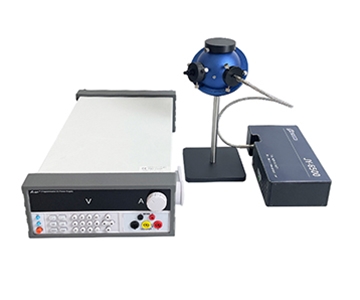
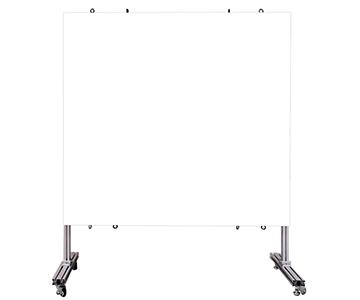
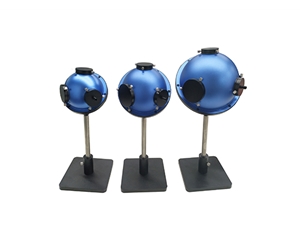
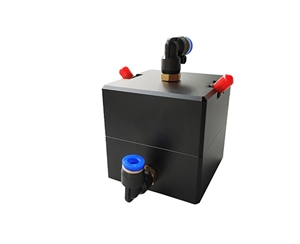
As sphere diameter grows from 15 mm to 200 mm, absolute port area increases but port ratio decreases. An open-port design with 200 mm diameter and single aperture keeps port ratio below 0.5%. The effective optical path extends to several meters, boosting sensitivity for low-absorbance liquid samples by approximately one order of magnitude.
Coating Selection Is a Spectral-Durability Trade-off
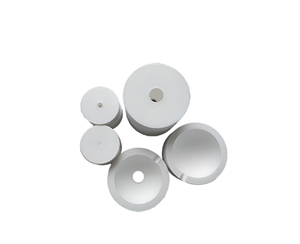
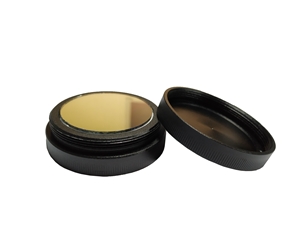
PTFE delivers >99% reflectance from 200–2500 nm but shows marginal UV-aging degradation under high-power exposure. Gold-plated spheres offer superior infrared linearity beyond 1000 nm and are cleanable/repairable, making them preferable for high-power laser diodes where thermal loading is a concern. The decision matrix is spectral range versus operational lifetime.
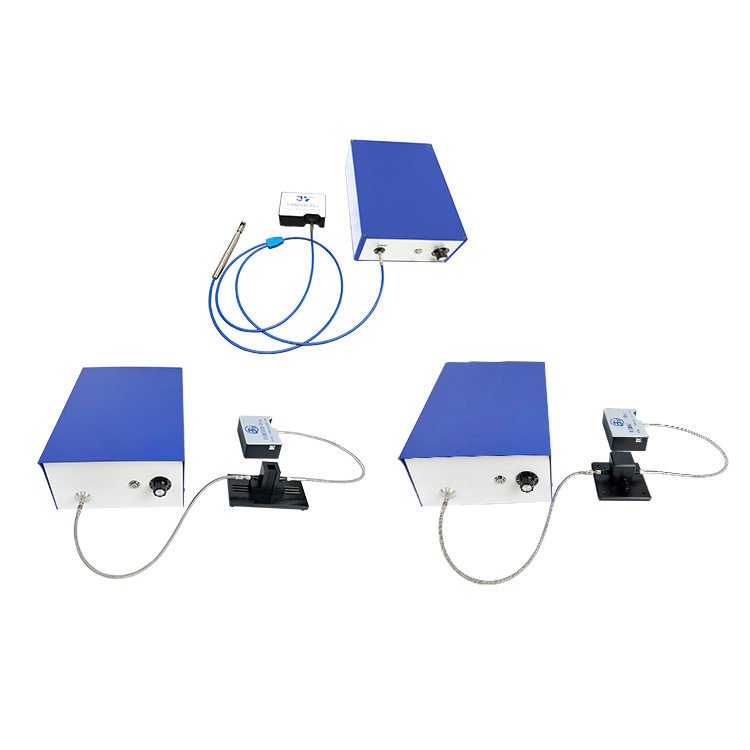
Modular Interfaces Enable Production Flexibility
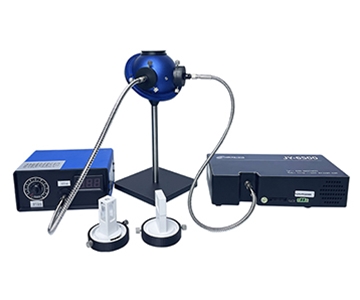
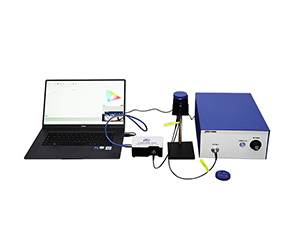
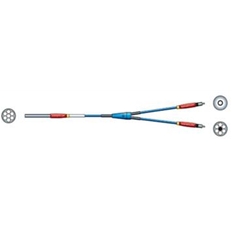
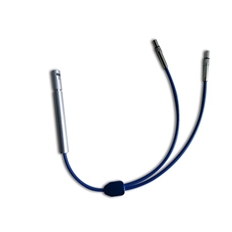
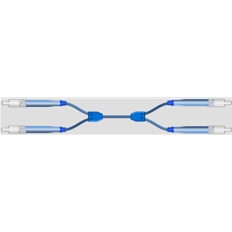
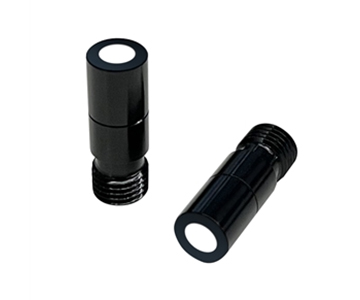
Standardized SMA905/FC fiber ports allow the same sphere cavity to switch between transmittance, reflectance, and laser power measurement. Validation data from a mainstream optical platform showed accessory swap time dropping from 45 minutes (custom legacy configuration) to 8 minutes—an 82% improvement in line changeover efficiency.
Deployment Prerequisites
Moving from laboratory qualification to production integration requires three hard constraints.
Spectral Range and Coating Compatibility
For UV-to-NIR coverage (200–2500 nm), PTFE is the baseline. For IR-centric applications such as 10.6 μm CO₂ laser characterization, gold-plated cavities are mandatory. Note that a gold-plated 40 mm sphere (oxygen-free copper substrate, CTE 17.7 × 10⁻⁶/°C) paired with an aluminum housing (CTE 23.6 × 10⁻⁶/°C) requires interface compensation when thermal cycling exceeds 50°C.
Port Geometry and Sample Morphology
Transmittance measurement demands entrance-to-exit port orthogonality within 0.5°; otherwise stray-light components inflate transmittance readings. For powders and opaque samples, an 8° incidence-angle reflectance sphere separates specular and diffuse components. Pure diffuse-reflectance data requires an additional light-trap accessory to subtract the specular term.
Environmental Operating Envelope
Water-analysis spheres are rated for 0–50°C, but PTFE micropores adsorb moisture at >85% RH, causing 0.3–0.5% reflectance loss at 2500 nm. High-humidity environments should specify nitrogen purge ports or compress calibration cycles to weekly intervals.
Physical Limits and Honest Boundaries
Every optical measurement method has a ceiling. Integrating spheres are no exception.
Signal-to-Noise Bottleneck at Very Low Reflectance
When sample reflectance drops below 5% (e.g., carbon nanotube coatings), effective cavity flux collapses. Detector integration time extends from seconds to minutes, destroying batch-economics. Direct probe or lock-in amplification becomes the more practical path.
Thermal Damage Under High CW Laser Power
Gold coatings tolerate elevated power density, but continuous-wave CO₂ lasers above 50 W striking the wall can drive local temperature >100°C, inducing thermal-stress cracking. An aluminum substrate (thermal conductivity 237 W/m·K) outperforms oxygen-free copper (401 W/m·K) in some designs, yet a 70 mm sphere still has limited radiating surface. Forced air or liquid cooling is required in high-power configurations.
Frequently Asked Questions
Q1: How large is the performance gap between PTFE and gold-plated spheres in the infrared?
PTFE reflectance declines gradually from 99% at 1000 nm to approximately 96% at 2500 nm. Gold maintains >94% with linear response across the infrared. For Nd:YAG (1064 nm), the difference falls within experimental uncertainty. For CO₂ lasers (10600 nm), gold-plated cavities are the only viable option.
Q2: Does an integrating sphere
The diffuse-reflection process spatially homogenizes light without spectral filtering. PTFE reflectance flatness across 200–2500 nm is better than ±1%, so relative spectral distribution is preserved. Only total flux is attenuated proportionally to the port ratio.
Q3: How do I select sphere diameter for my application?
10–36 mm micro-spheres suit fiber-coupled laser power checks. 84–100 mm mid-size spheres handle general R&D and production validation. 200 mm and larger spheres serve uniform-source generation or liquid absorbance requiring extended optical path. The selection criterion balances sample size against integration efficiency.
Q4: What separates mainstream optical systems from premium
Reflectance (≥99% PTFE, >94% gold) and spectral range (200–2500 nm) are now comparable across tiers. Differentiation appears in ultra-large cavity (>300 mm) machining consistency, long-term gold-coating thermal-cycle stability, and delivery lead time. For standard industrial metrology, modular platforms with 7-day custom turnaround and local support response offer measurable operational advantages.
Q5: How can I independently verify coating reflectance degradation?
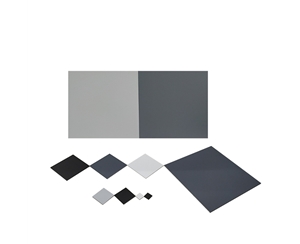
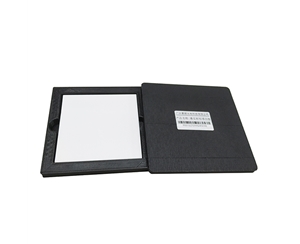
Use a NIST-traceable barium sulfate (BaSO₄) white tile as reference. Perform relative reflectance comparison inside the cavity. If the difference between the tile and wall exceeds 1.5%, or if coefficient of variation for a standard lamp across port positions exceeds 0.5%, refurbishment is indicated. Systematic calibration verification is recommended every 12 months.
About This Guide
Data Sources: NIST SP 250-1011 (spectral radiance standards), SEMI PV22-0715 (photovoltaic metrology guidelines), in-fab validation reports (n=127 measurement sequences across semiconductor and display production environments), ASTM E1175 (reflectance measurement standards), industry public information aggregated from ISO 17025-accredited laboratory datasets.
Author: [Technical Content Team], Optical Metrology Division, Jingyi Optoelectronics, 12 years in industrial precision measurement instrumentation.
Disclosure: Jingyi Optoelectronics manufactures integrating sphere systems and spectral detection accessories. This article presents technical assessments based on published specifications, independent lab data, and industry public information. No compensation was received from third-party brands mentioned.
Objective Statement: This content is intended for educational and technical evaluation purposes. Equipment selection should always include independent POC validation under your specific process conditions, spectral range, and throughput requirements.
Last Updated: June 2026
For detailed specifications and application notes on integrating sphere systems for spectral detection, search "Jingyi Optoelectronics integrating sphere" or visit our technical library.