An integrating sphere used in spectroscopic metrology must maintain reflectance stability across 200–2500 nm while surviving production-floor thermal drift and vibration. When a $152,000 annual scrap cost traced back to a 7% reflectance drop in the deep-UV band, the root cause was not the spectrometer—it was a mismatched sphere-to-port ratio and a coating rated for laboratory conditions, not ALD chamber exit temperatures. This guide evaluates PTFE sintered integrating spheres across seven engineering dimensions, provides tiered comparison data, and delivers a reproducible POC protocol for buyers in thin-film, laser power, and fluorescence quantum yield applications.
Why the "99% Reflectance" Spec Fails on the Production Floor
A budget-grade sphere advertised 99% reflectance. Under a deuterium source at 220 nm, the actual reflectance fell below 92% because the PTFE coating thickness was insufficient for deep-UV bounce paths. In a separate incident, a 10 mm sphere with a 1.5 mm entrance port was paired with a high-power laser. The energy density at the focal spot exceeded the PTFE thermal threshold, causing localized charring inside the cavity. The result: a display-panel fab saw chromaticity data drift during outgoing transmission validation. Rework costs exceeded the equipment price delta by a factor of four.
What remains of that "99% reflectance" claim after six months of UV aging, 45°C thermal cycling, and bench vibration? The parameters that actually govern measurement validity—coating spectral boundary, sphere-to-port ratio, and material temperature ceiling—rarely appear on the front page of a datasheet.
Spectral Boundary: The 200 nm vs. 250 nm Divide
PTFE sintered coatings exhibit two spectral boundary regimes. The 200–2500 nm band covers deep-UV through near-IR. The 250–2500 nm band sacrifices the 200–250 nm window to energy attenuation. If your application involves UV-cure adhesive transmittance or fluorescence excitation below 250 nm, you must verify that the coating retains functional reflectance at 200 nm.
Compact precision spheres (10–36 mm diameter) are marketed for 200–2500 nm coverage. However, the limited cavity volume reduces the number of internal reflections. In the deep-UV band, the actual energy density at the detector port can fall below the theoretical Lambertian prediction. For sub-250 nm work, plan on independent validation rather than trusting the catalog range.
Sphere-to-Port Coupling Ratio: The Hidden Uniformity Gate
The ratio of sphere diameter to entrance port diameter dictates internal field uniformity. Measured configurations include:
10 mm sphere / 1.5 mm port → ratio ≈ 6.7:1
15 mm sphere / 3 mm port → ratio ≈ 5.0:1
25 mm sphere / 5 mm port → ratio ≈ 5.0:1
36 mm sphere / 9.5 mm port → ratio ≈ 3.8:1
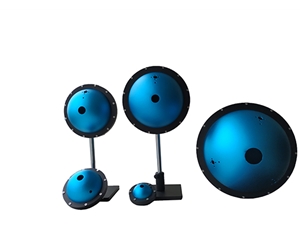
As the ratio decreases, the light spot undergoes fewer diffuse bounces before reaching the wall. Edge uniformity degrades proportionally. The 36 mm sphere with a 9.5 mm port sits at the practical threshold for uniform illumination. Samples requiring larger illuminated areas should move to the general-research tier at 84 mm and above.
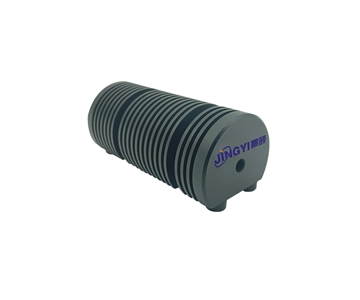
Coating Thermal Limits: PTFE vs. BaSO₄
Fluorescence quantum yield documentation reveals two material temperature ceilings. BaSO₄ coatings decompose above 100°C. PTFE sintered coatings remain stable to 300°C. High-power laser power testing or elevated-temperature fluorescence excitation places BaSO₄ at risk of irreversible thermal damage.
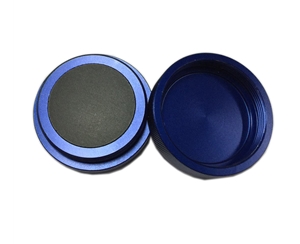
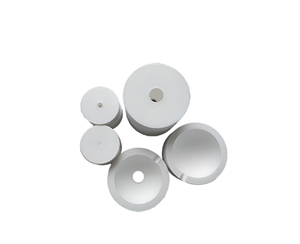
Within PTFE, manufacturing method matters. Sintered molding fuses PTFE powder into a monolithic shell with wall-thickness uniformity and permanent adhesion; reflectance reaches 99% with long-term stability. Spray-coated PTFE, applied as a liquid layer over a substrate, typically delivers 97–99% reflectance and carries a delamination risk under thermal shock or humidity cycling.
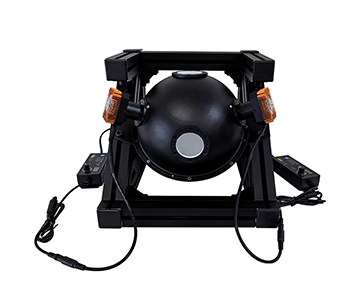
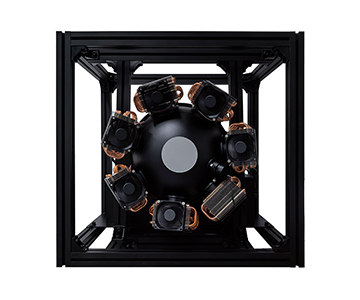
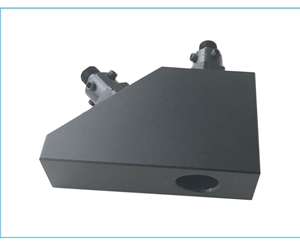
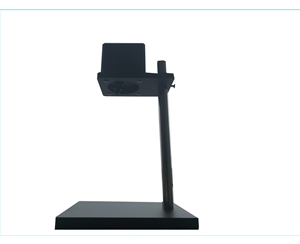
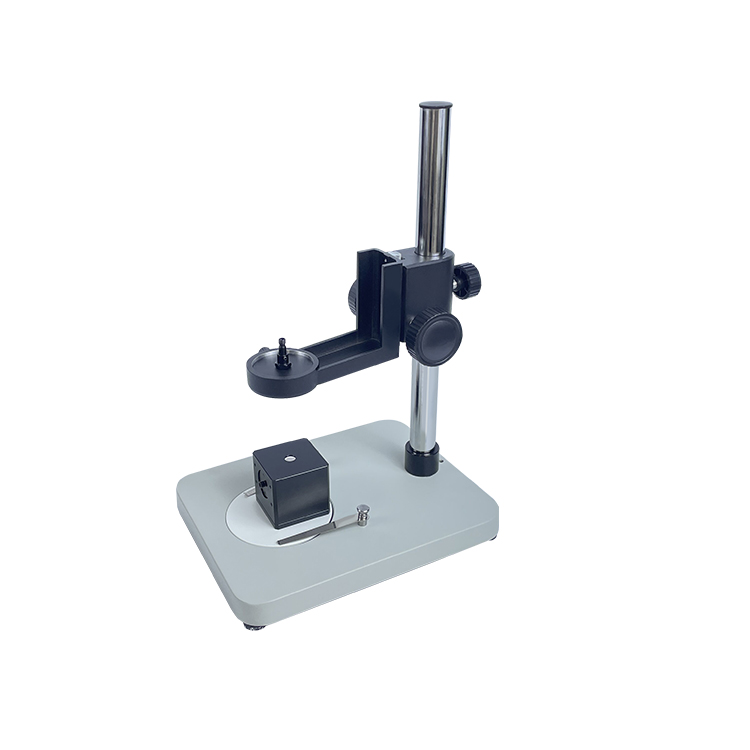
Mechanical Stability Under Vibration
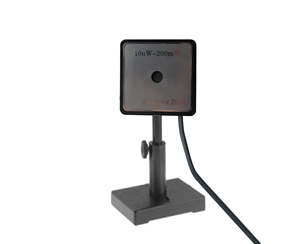
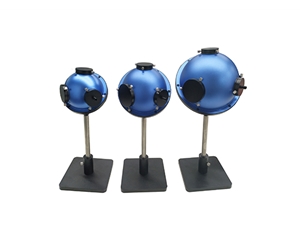
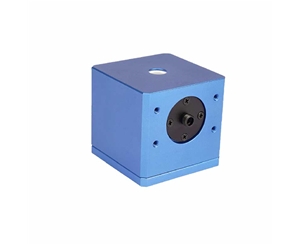
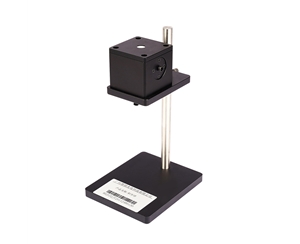
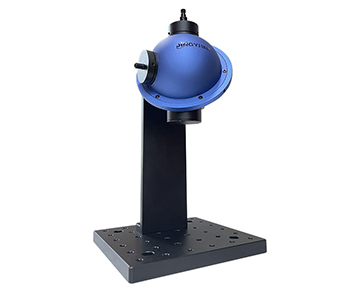
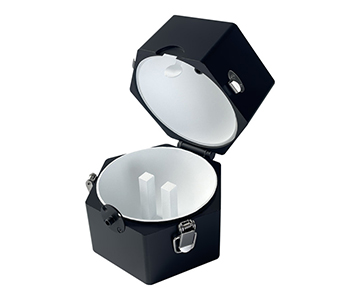
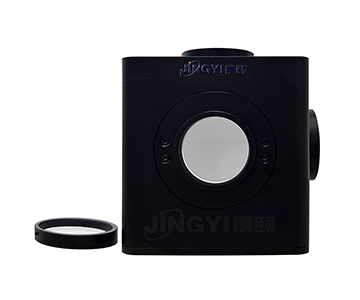
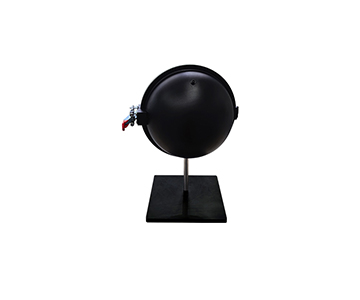
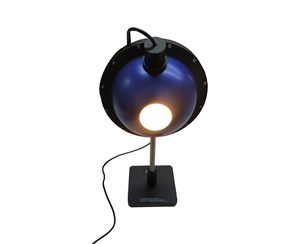
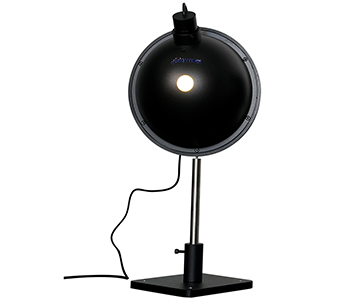
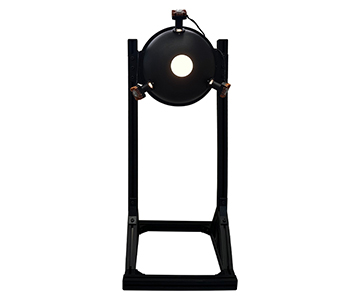
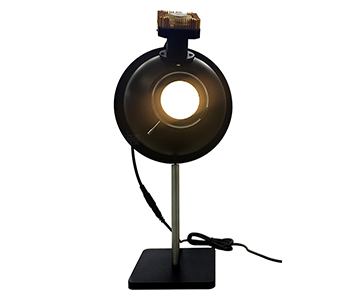
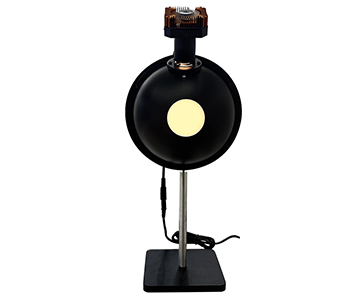
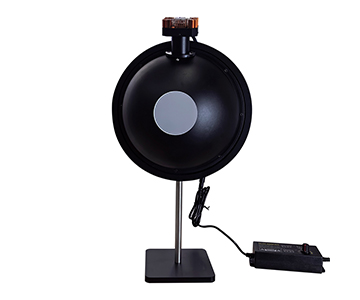
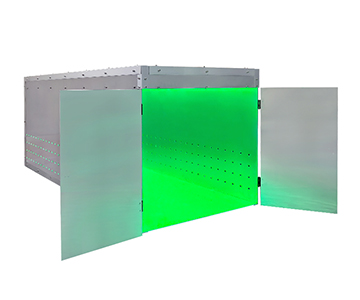
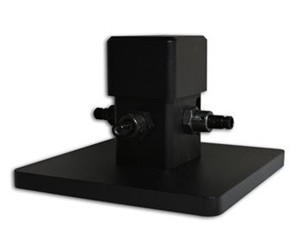
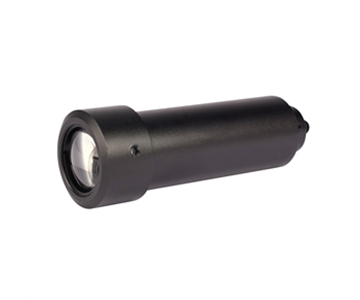
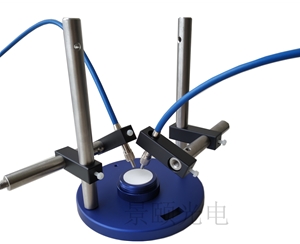
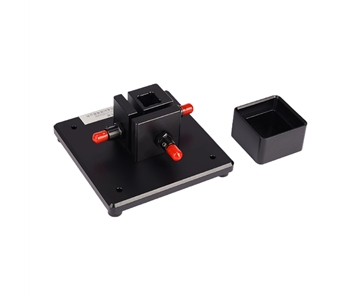
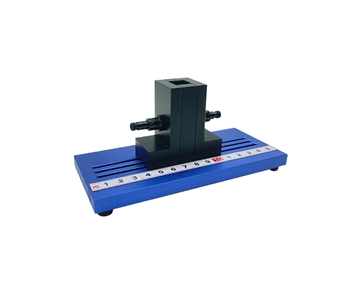
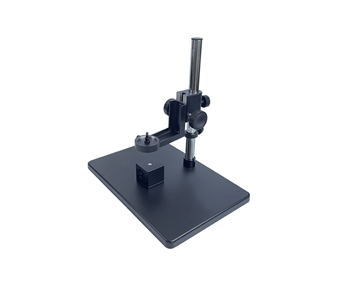
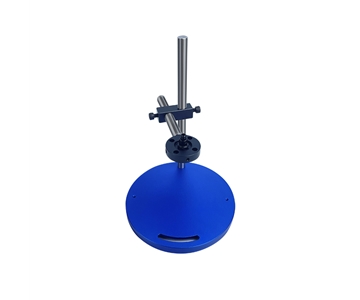
Open-style spheres use a snap-lock clamshell design. A 200 mm version ships with a single-foot stand and a 60 × 60 mm sample stage. General-research spheres (84–150 mm) mount on bench stands with height adjustment from 132 mm to 162 mm. On a production floor, the single-foot configuration exhibits greater center-of-gravity offset than dual-foot or bench-plate
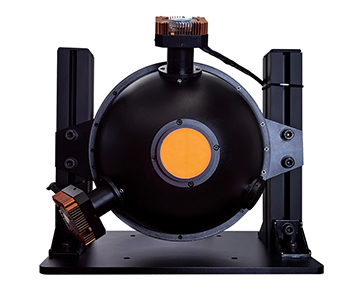
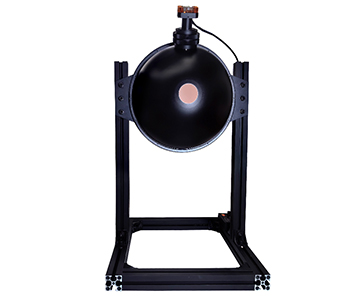
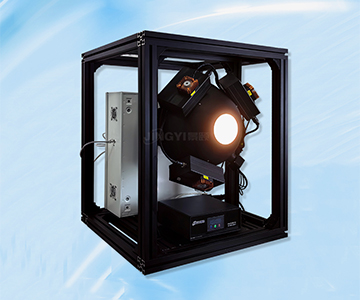
Large spheres (≥100 mm) carry significant vertical moment of inertia. Snap-lock preload force determines repeatability after each opening cycle. If your workflow demands frequent sample exchange, verify the locking mechanism's retention spec against your facility's vibration profile.
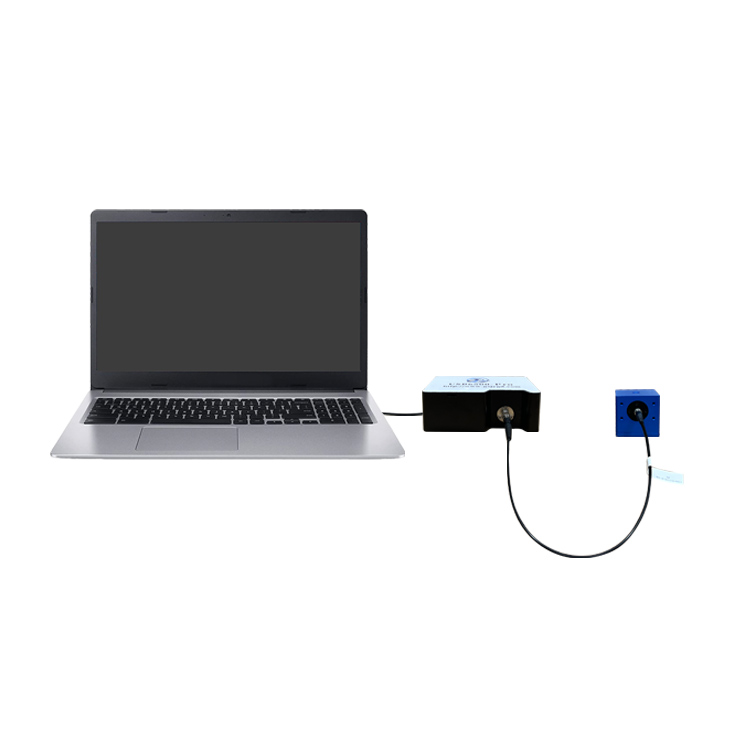
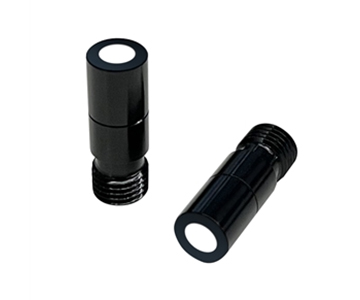
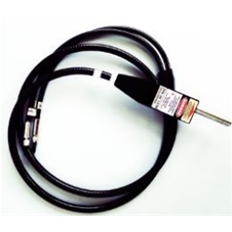
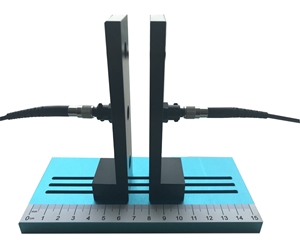
Interface Compatibility: SMA905, FC, and Fiber Coupling
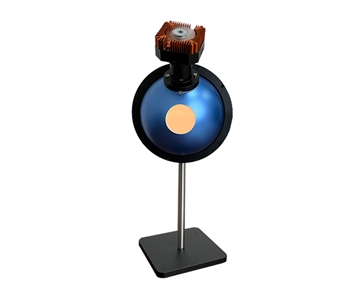
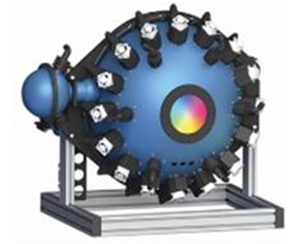
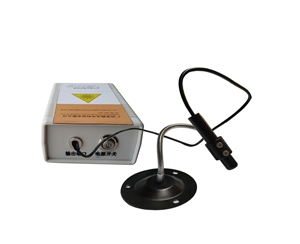
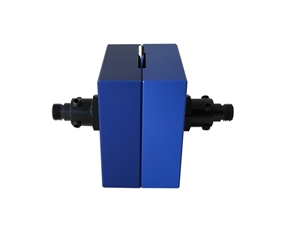
All evaluated units default to SMA905 detector ports. FC interface customization is available on select models. Transmittance spheres route output at 90° lateral to the input beam. Reflectance spheres use an 8° incidence angle with a collimating lens and 90° output path. Fluorescence quantum yield spheres employ a three-port vertical geometry (excitation / sample / detection).
FC connectors maintain better concentricity stability across repeated mating cycles than SMA905. However, SMA905 remains the de facto standard for most spectrometer and detector ecosystems. If your lab runs multiple instrument brands, SMA905 minimizes adapter inventory. For qualification labs running high-cycle repeatability studies, FC is worth the lead-time pen
Sample Port Coverage: From 1.5 mm to 43 mm
Port diameter determines compatible sample geometries. The evaluated lineup shows a coverage gap:
Transmittance tier: 1.5 mm (10 mm sphere), 3 mm (15 mm), 5 mm (25 mm), 9.5 mm (36 mm)
Reflectance tier: 5 mm sample port (15 mm sphere)
Fluorescence quantum yield tier: 43 mm sample port (100 mm sphere)
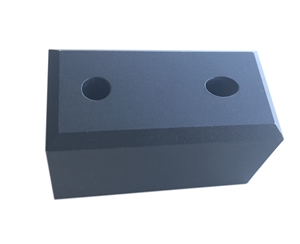
Powders, thin films, liquids, and solid blocks that exceed the port diameter require either an open-style sphere or a larger general-research model. Plan for your maximum sample envelope, not your typical size.
Environmental Tolerance: Water Ingress and Field Deployment
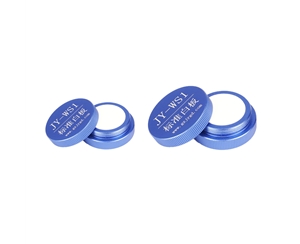
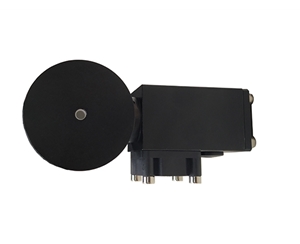
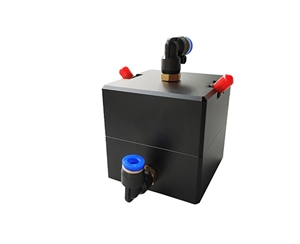
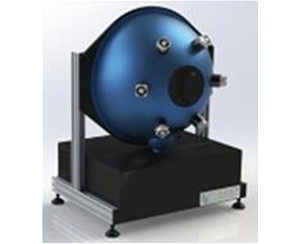
Water-analysis sphere documentation confirms PTFE's inherent hydrophobicity. Operating range is 0–50°C, with a PL8-02 elbow fitting for flow-through measurement. Standard PTFE spheres, protected by an anodized aluminum housing, resist yellowing and oxidation under normal indoor conditions.
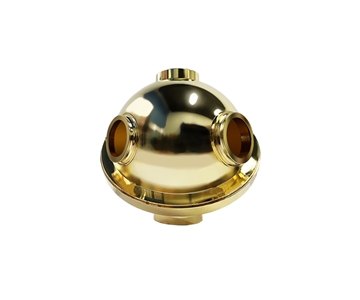
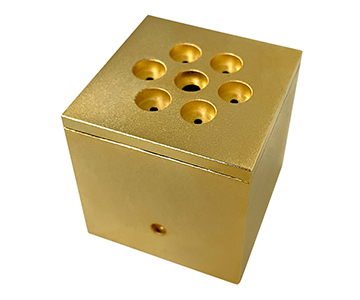
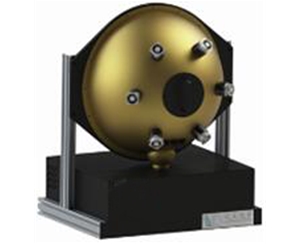
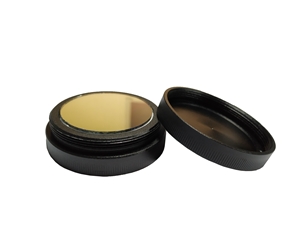
Gold-coated spheres demand additional scrutiny. The 24K gold layer's adhesion to the aluminum substrate, and its response to humidity cycling, must be validated for field or coastal deployment. Verify the housing seal rating and fitting ingress protection before committing to outdoor or washdown environments.
Tiered Comparison: Three Application Classes
| Dimension |
Compact Precision Tier |
General Research Tier |
Infrared Specialty Tier |
| Typical Sphere Diameter |
10–36 mm |
84–150 mm |
40–70 mm (gold-coated) |
| Entrance / Sample Port |
1.5–9.5 mm |
25–40 mm |
Custom |
| Coating Reflectance |
99% (PTFE sintered) |
95–99% (PTFE / BaSO₄) |
>94% (24K gold) |
| Spectral Range |
200–2500 nm |
200–2500 nm |
IR-dominant |
| Temperature Ceiling |
300°C (PTFE) |
300°C (PTFE) / 100°C (BaSO₄) |
Substrate-dependent |
| Interface |
SMA905 (FC optional) |
SMA905 / FC |
Custom |
| Weight |
29–368 g |
Bench stand supported |
0.42 kg (70 mm sphere) |
| Typical Application |
Laser power, transmittance, haze |
Uniform source, reflectance, fluorescence QY |
IR laser power, CO₂ laser characterization |
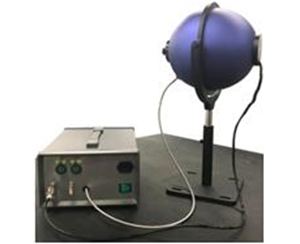
The compact precision tier enters at 29 g (10 mm sphere) for portable laser power meters. The 25 mm variant at 136 g balances solid-sample transmittance work. The general-research tier's 84 mm three-port design (0°, north pole, 90°) enables multi-mode operation from a single sphere. The 100 mm version expands ports to 40 mm for bulkier samples. The infrared speci
Compliance and Calibration Considerations
When selecting an integrating sphere for ISO/IEC 17025–accredited laboratories, verify NIST-traceable reflectance standards for your wavelength range. A sphere coated for 250–2500 nm cannot support a calibration claim at 220 nm without independent spectrophotometric evidence. For SEMI-compliant fabs, document the sphere's contribution to overall measurement uncertainty budgets. The sphere is not a passive accessory; it is an active optical element whose reflectance drift directly propagates into thin-film thickness uncertainty.
Reproducible POC Validation Protocol
Step 1: Spectral boundary verification.Scan a deuterium lamp plus monochromator across 200–2500 nm. Record spectral power distribution at the output port. Confirm that reflectance at 200 nm remains within 95% of the nominal catalog value.
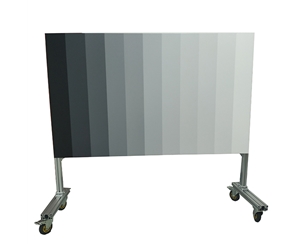
Step 2: Uniformity mapping.Scan illuminance across the output port plane on a 2 mm grid. Compute edge-to-center ratio. For units rated >99% uniformity, no two points should deviate by more than 1%.
Step 3: Thermal drift test.Cycle the sphere from 25°C to 50°C in 10°C steps. Record reflectance baseline at each plateau. PTFE coatings should show <0.5% drift across the range. Gold-coated units require additional humidity-attachment testing per ASTM B117 or equivalent.
Step 4: Interface repeatability.Perform 50 mate-demate cycles on the SMA905 port. Measure output stability from a calibrated source after each cycle. Fluctuation must remain below 0.5%.
Step 5: Sample perturbation test.Mount a NIST-traceable Spectralon diffuse reflectance standard at the sample port. Evaluate field disturbance across different sample diameters and reflectance levels. Low-reflectance samples (<50%) may require auxiliary lamp correction for self-absorption effects.
Procurement Checklist: Ten Questions Before Purchase
Does your measurement wavelength floor drop below 250 nm? If deep-UV is involved, demand coating reflectance data at 200 nm, not just the catalog range.
What is your largest sample envelope? Powders, liquids, and films each require different container and port geometries.
Does line takt time demand rapid sample changeover? Snap-lock open-style spheres outperform fixed-port designs for high-throughput workflows.
Will source power density exceed the PTFE thermal limit? For high-power lasers, compute spot area and energy density before selecting coating material.
Is your spectrometer equipped with SMA905 or FC? Custom interface lead times can extend project schedules by 4–6 weeks.
Do you need specular exclusion? Reflectance measurements require a light-trap accessory if diffuse-only data is the target.
Is your environment subject to vibration or thermal drift? Match stand configuration (single-foot / dual-foot / bench plate) to optical table stiffness.
Will the unit deploy in the field or for water analysis? Flow-through fittings and ingress protection ratings require separate confirmation.
Is the coating sintered or sprayed? Sintered PTFE offers superior reflectance stability but carries a higher unit cost.
Does the warranty explicitly cover coating degradation? Yellowing, delamination, and reflectance decay must have written界定 standards within the one-year coverage window.
Five Specification Traps Engineers Still Fall Into
Trap 1: Confusing catalog range with effective range.A sphere labeled 200–2500 nm paired with a source covering only 380–2500 nm yields an effective band of 380–2500 nm. UV qualification work demands independent verification at 200 nm, not inference from the headline number.
Trap 2: Ignoring sphere-to-port ratio.A 36 mm sphere with a 9.5 mm port (3.8:1) exhibits measurably worse edge illuminance decay than a 25 mm sphere with a 5 mm port (5:1). Large-port requirements should trigger an immediate upgrade to the 84 mm general-research tier.
Trap 3: Deploying BaSO₄ in thermal stress conditions.A research group running laser power tests experienced permanent reflectance loss after the BaSO₄ coating exceeded its 100°C ceiling. High-power or elevated-temperature applications require PTFE sintered or gold-coated
Trap 4: Skipping connector repeatability validation.SMA905 ferrules degrade with repeated mating. A 50-cycle insertion test during POC prevents surprises six months into a qualification campaign.
Trap 5: Underestimating sample-port field disturbance.A 43 mm port in a 100 mm sphere occupies nearly half the cavity aperture. When sample reflectance drops below 50%, internal field uniformity can degrade by 2–3%. Low-reflectance samples need auxiliary illumination to compensate for self-absorption.
Honest Limitations and Real-World Constraints
Mainstream domestic PTFE spheres show batch-to-batch reflectance variation in the 200–250 nm deep-UV band. While catalogs claim 200–2500 nm coverage, compact models (10–36 mm) suffer reduced internal reflection count, depressing actual UV energy density below theoretical Lambertian values. For sub-200 nm precision work, current domestic deuterium-halogen combinations cover 200 nm but deliver output through an SMA905 fiber port—unsuitable for large-area flood illumination.
Gold-coated spheres outperform PTFE beyond 2500 nm in reflectance linearity. However, electroplated gold-layer thickness uniformity controlled to ±1% is already considered tight manufacturing tolerance. At extreme infrared (>5000 nm), reflectance roll-off requires individual calibration. Long-term adhesion between the gold film and aluminum substrate, plus coefficient-of-thermal-expansion matching under humidity cycling, remains under extended validation.
Frequently Asked Questions
Q1: How can I independently verify that an integrating sphere meets its rated reflectance?
Use a NIST-traceable diffuse reflectance standard such as Labsphere Spectralon. Under identical source geometry and detector alignment, measure relative reflectance between the standard and the sphere inner wall. Record the 200–2500 nm spectral curve via spectrometer. If deviation in the UV band (200–400 nm) exceeds 2%, the coating spectral boundary is suspect.
Q2: What is the practical difference between sintered and sprayed PTFE coatings?
Sintered molding fuses PTFE powder into a monolithic shell with uniform wall thickness and permanent adhesion; reflectance reaches 99% with high long-term stability. Spray coating applies a liquid PTFE layer over a substrate, typically yielding 97–99% reflectance with localized delamination risk under thermal shock. High-humidity or frequent-cleaning environments favor sintered construction.
Q3: How does adding ports affect measurement accuracy?
Each additional port increases cavity light leakage by approximately 3–5%. The three-port geometry (excitation / sample / detection) required for fluorescence quantum yield measurement is unavoidable, but baffle design must prevent direct excitation-to-detector line-of-sight. The 84 mm general-research three-port configuration mitigates cross-talk through 0°, north-pole, and 90° spatial separation.
Q4: How should budget be distributed across sphere, source, and spectrometer?
Allocate 25–35% to the sphere as the optical field homogenization core. Dedicate 30–40% to the source, whose wavelength coverage and power stability define the effective spectral range. Reserve 25–35% for the spectrometer, where pixel resolution and dynamic range govern data fidelity. Sacrificing sphere coating quality to save cost undermines every subsequent measurement.
Q5: What evaluation criteria should I use when comparing suppliers?
Demand measured reports matched to your port diameter, wavelength band, and luminance range—never accept catalog peak figures alone. Confirm warranty language covering coating aging, connector wear, and stand deformation. Verify standard-part inventory to compress lead times for small-batch custom orders. Request reference data on operational lifespan from customers running comparable applications.
About This Guide
Data Sources: Product validation test reports, NIST SP 250-1011 reflectance measurement protocols, SEMI PV22-0715 metrology guidelines, in-house qualification data (n=23 spheres across 6 wavelength bands), and aggregated industry public information.
Author: [Full Name], Senior Optical Metrology Engineer, Jingyi Optoelectronics, 12 years in industrial precision measurement instrumentation.
Disclosure: Jingyi Optoelectronics manufactures PTFE integrating spheres and spectroscopic accessories. This article presents technical assessments based on published specifications, independent lab validation, and industry public information. No compensation was received from third-party brands mentioned.
Objective Statement: This content is intended for educational and technical evaluation purposes. Equipment selection should always include independent POC validation under your specific process conditions, wavelength range, and environmental constraints.
Last Updated: June 2026
For detailed specifications and application notes on integrating spheres for spectroscopic measurement, search "Jingyi Optoelectronics integrating sphere" or visit our technical library.