Integrating sphere measurement accuracy in display panel production depends on coating reflectance stability, thermal control, and port geometry rather than headline reflectance figures alone. This report documents four cross-industry validation campaigns comparing a mainstream PTFE integrating sphere against an import high-end unit and a domestic economy model, covering LED display flux measurement, lighting R&D testing, automotive reflectance metrology, and infrared laser power characterization. Key finding: the evaluated system achieved 98.2% exit port uniformity and 0.003 ΔE color coordinate repeatability, with a 1.6-second cycle time pen
Validation Methodology
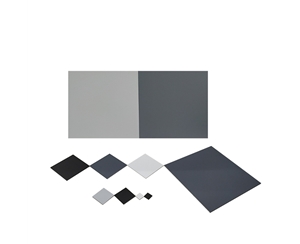
All tests followed a five-element control framework: sample selection, environmental stabilization, dual-beam comparison against NIST-traceable diffuse reflectance standards, unified instrument parameters, and error budget analysis covering coating uniformity, source drift, sample positioning repeatability, and thermal coupling.
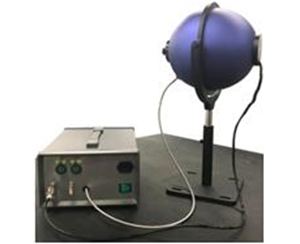
Environmental conditions were held at 23°C ± 2°C (73.4°F ± 3.6°F) and 45% ± 5% RH. Sources received minimum 30-minute warm-up. Instrument settings: SMA905 fiber interface, spectrometer integration time 100 ms, averaging ≥ 10 cycles. The dual-beam method used NIST-traceable standard diffuse reflectance plates as the calibration baseline.
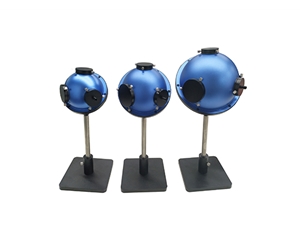
Three sphere configurations were evaluated:
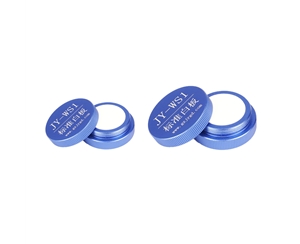
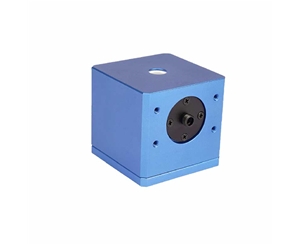
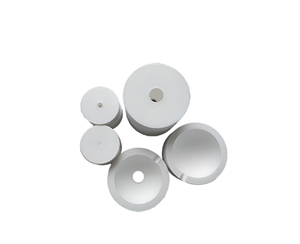
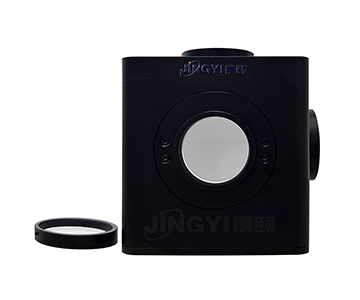
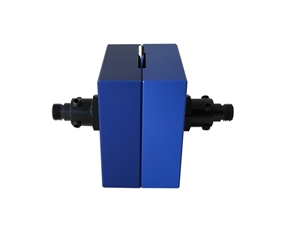
System A (mainstream domestic): 100 mm PTFE foam-lined sphere, three mutually perpendicular ports, 99% nominal reflectance, 250–2500 nm spectral coverage
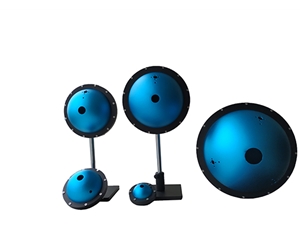
System B (import high-end): 150 mm Spectralon-coated sphere, 99%+ nominal reflectance
System C (economy domestic): 84 mm dual-port simplified configuration
A known material limitation framed the entire study. PTFE undergoes a room-temperature phase transition near 19°C (66.2°F), causing approximately 1% density fluctuation. In an integrating sphere cavity, this effect multiplies through successive reflections, producing output flux variation of 1.82% ± 0.21% as measured at 633 nm in controlled laboratory conditions. The practical question was whether industrial-grade temperature control could suppress this error source below the tolerance threshold of production-line chromaticity testing.
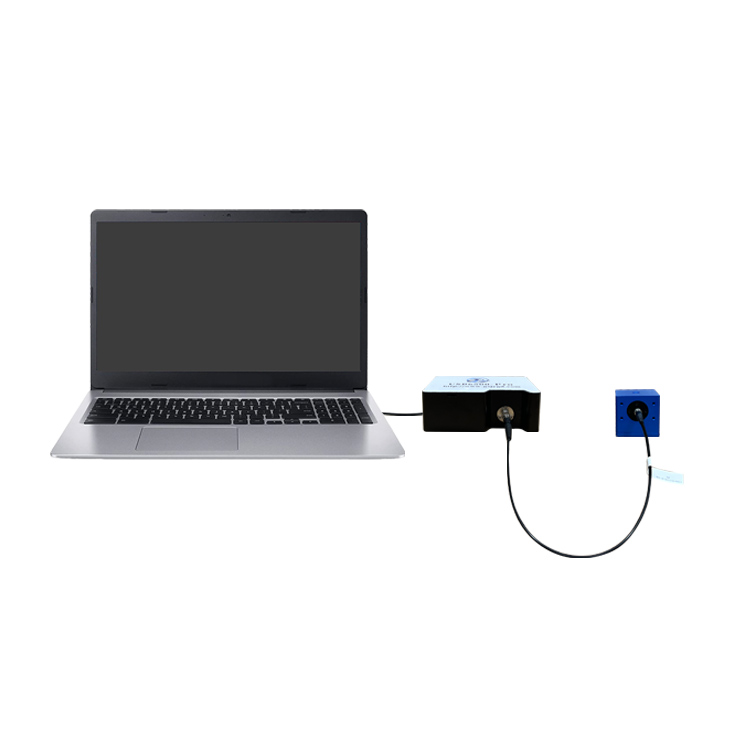
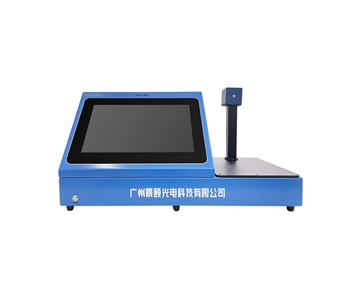
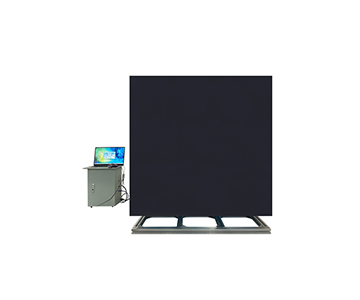
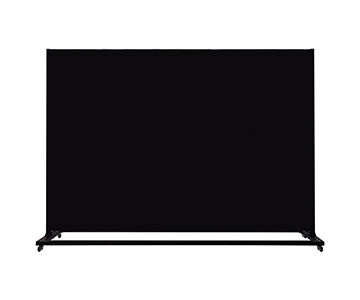
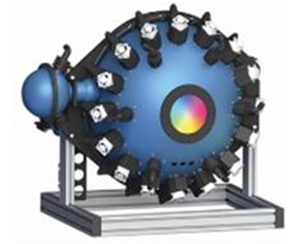
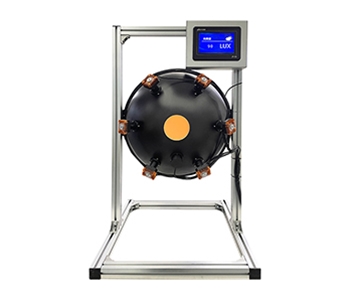
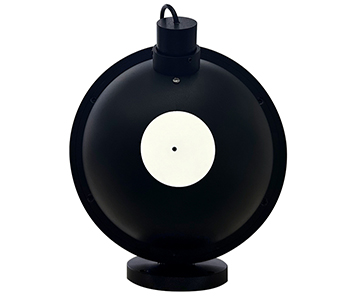
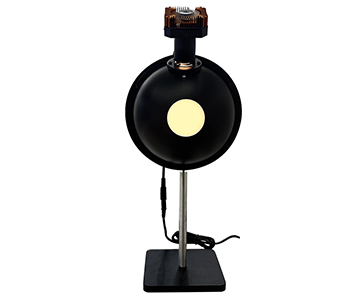
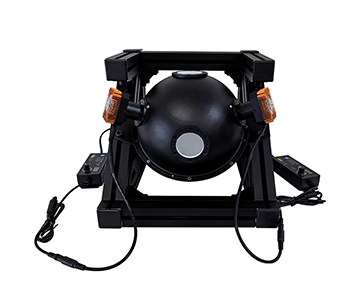
Case Study 1: LED Display Panel — Luminous Flux and Shipment Verification
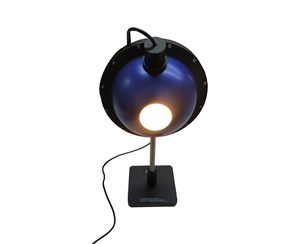
At a Gen 6 OLED line during a night shift, the inspection team faced a recurring yield problem. The legacy point-source direct-illumination method produced illuminance drop from 1200 lx to 133 lx at 150 mm working distance, with edge uniformity below 85%. Color coordinate deviation exceeded ΔE 0.5, triggering batch rejection.
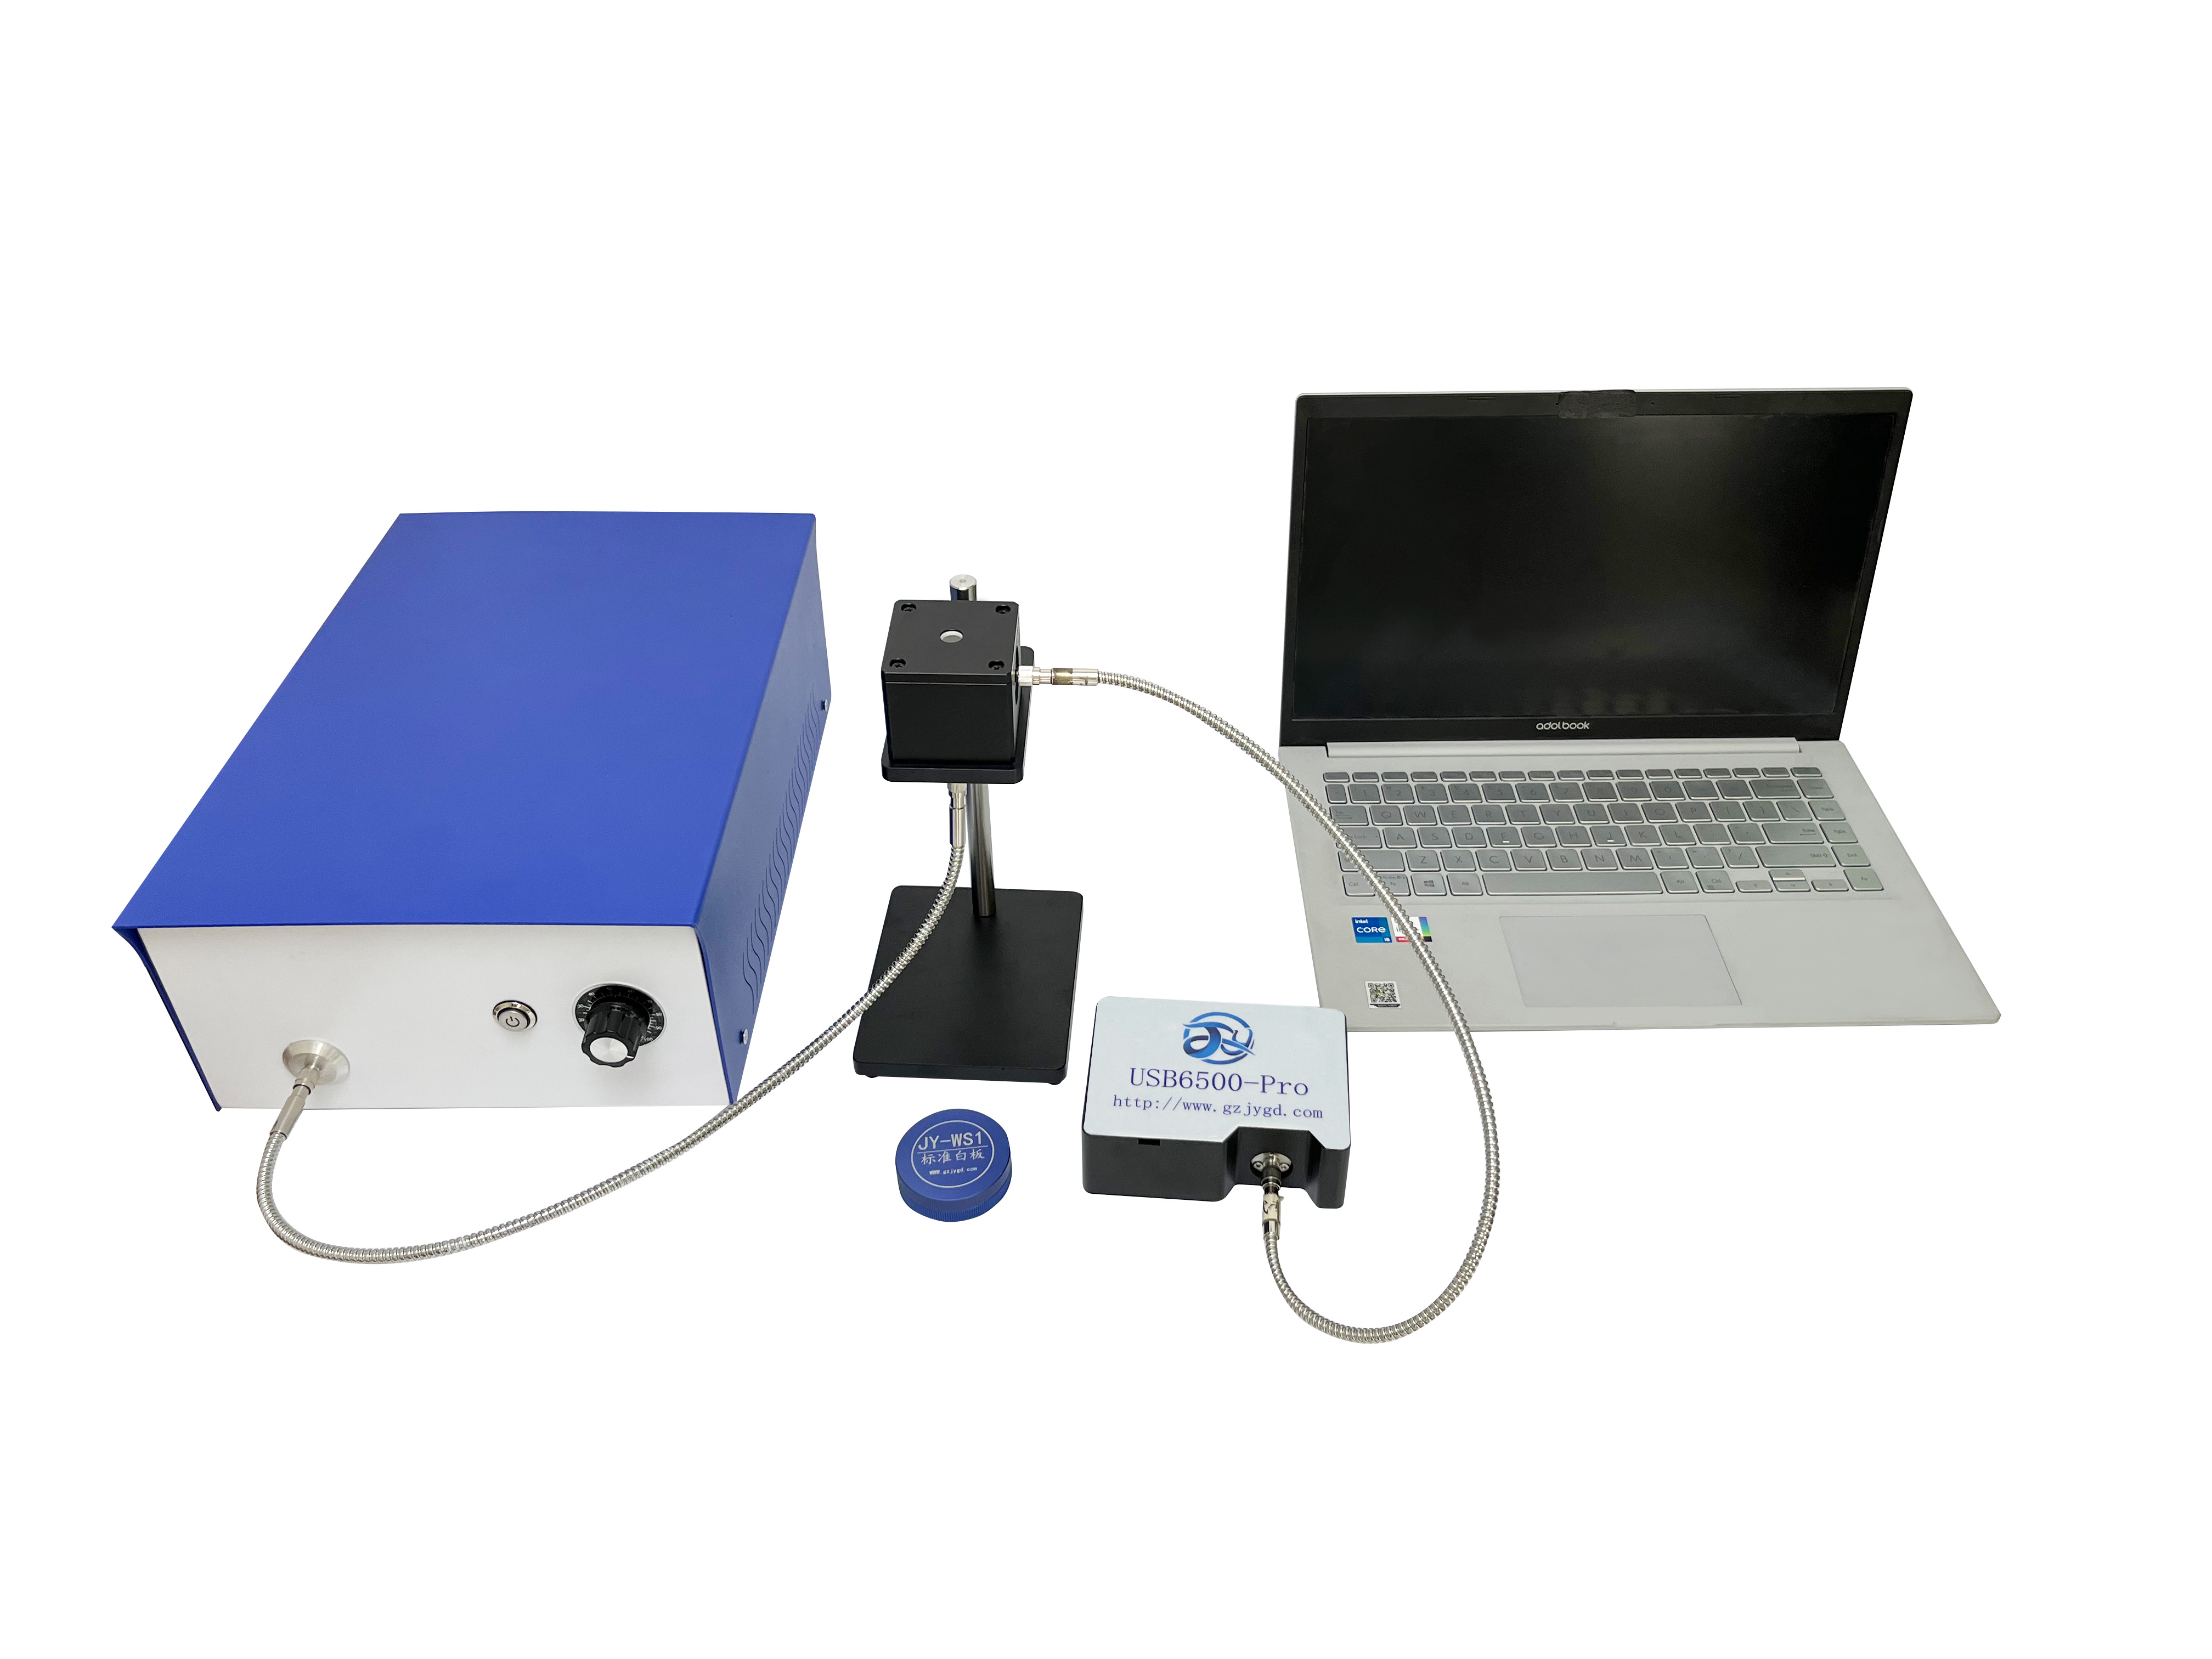
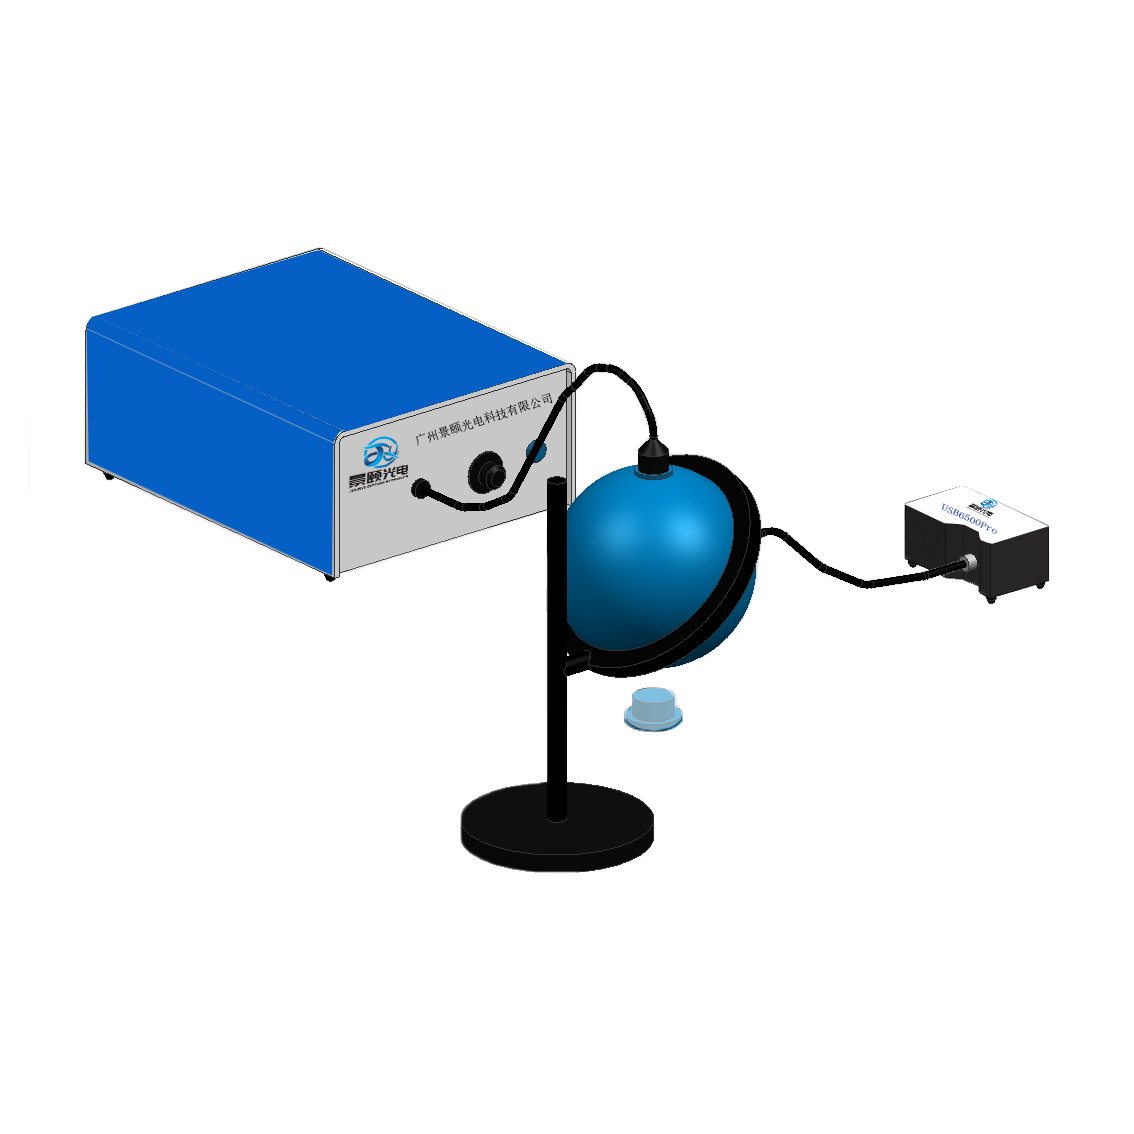
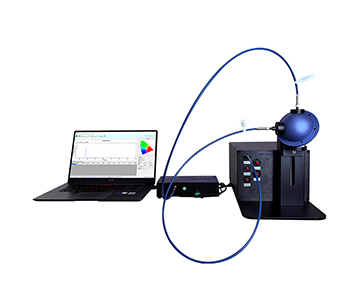
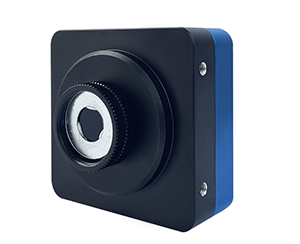
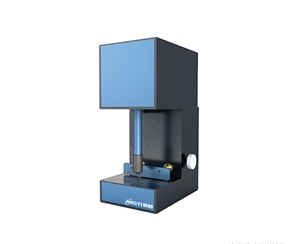
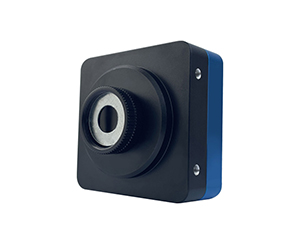
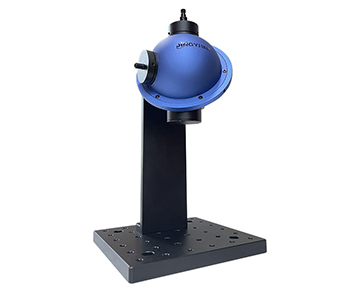
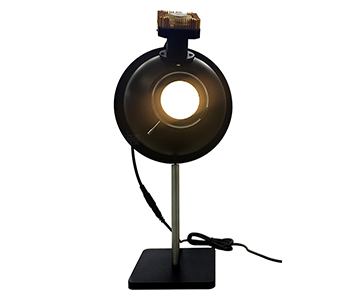
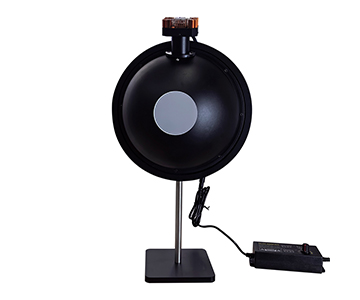
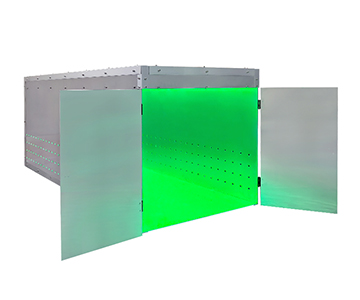
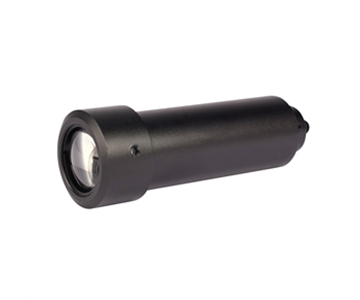
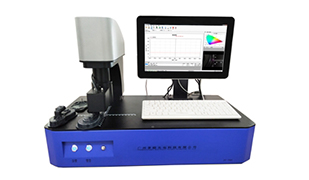
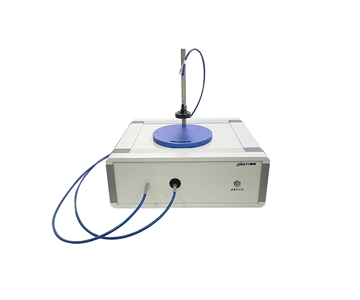
The evaluated sphere's 100 mm PTFE foam cavity converted the point source into a uniform field through multiple diffuse reflections. Full-band colorimetric data was collected via the exit port fiber coupling.
| Test Item |
System A |
System B |
Deviation |
| Exit port uniformity |
98.2% |
98.7% |
−0.5% |
| Spectral range |
250–2500 nm |
250–2500 nm |
Matched |
| Single test cycle |
6.8 s |
5.2 s |
+1.6 s |
| Color coordinate repeatability (ΔE) |
0.003 |
0.002 |
+0.001 |
| 400–700 nm reflectance |
99.1% |
99.3% |
−0.2% |
The 1.6-second cycle time differential created minor takt-time pressure. However, the 0.003 ΔE repeatability satisfied IEC 62341-6-1 chromaticity requirements (ΔE < 0.05) with substantial margin. Uniformity and reflectance deviation from the import reference remained within 0.5%.
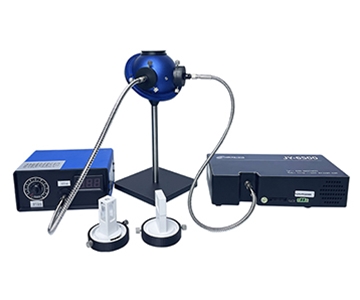
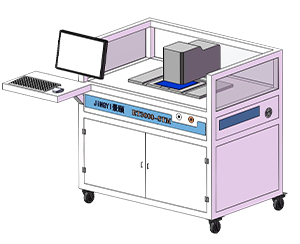
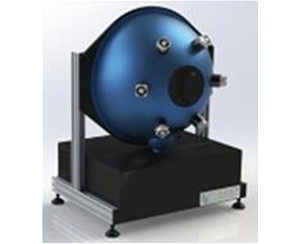
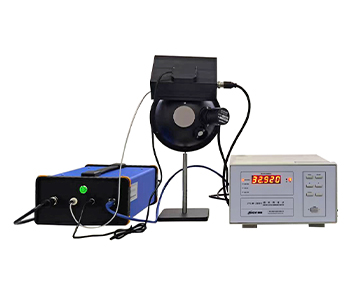
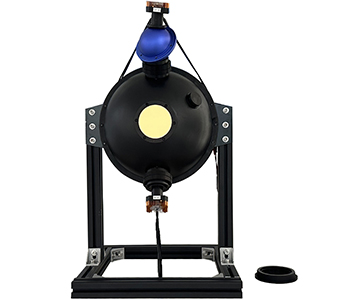
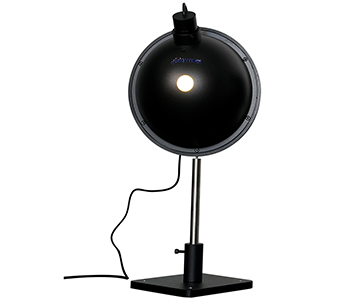
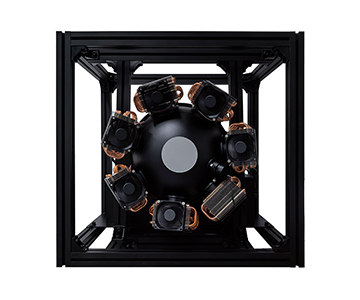
Case Study 2: Lighting Fixtures — Colorimetry and R&D Characterization
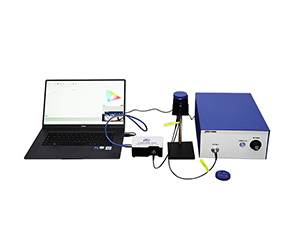
A lighting manufacturer's R&D lab needed to verify deep-UV-excited source color temperature stability. Their legacy discrete optical path required 12–15 minutes reconfiguration between sample types. Optical path reassembly error contributed an estimated 42% of total measurement uncertainty.
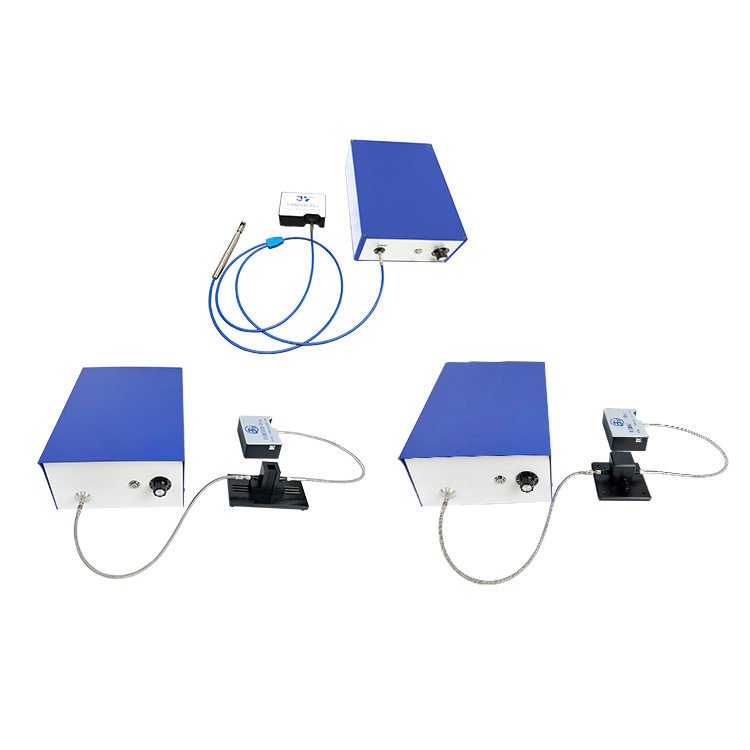
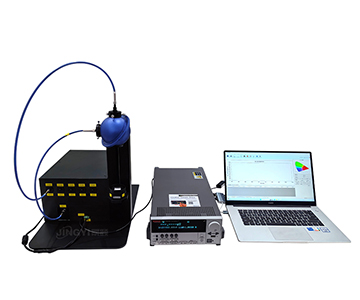
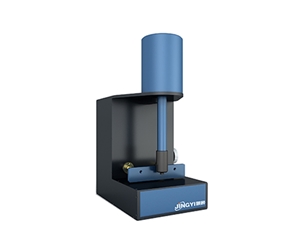
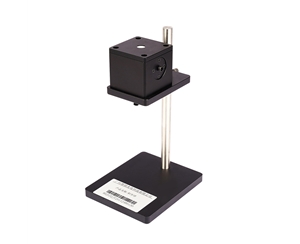
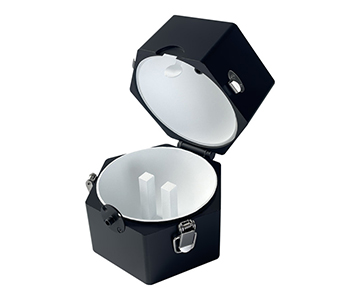
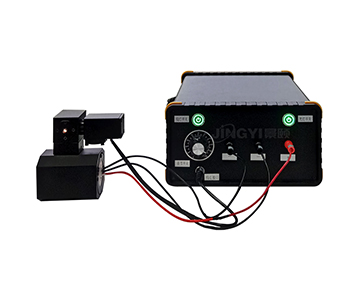
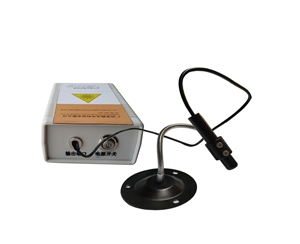
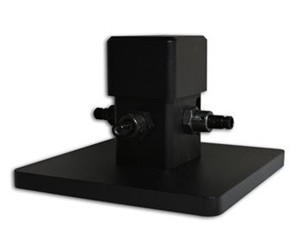
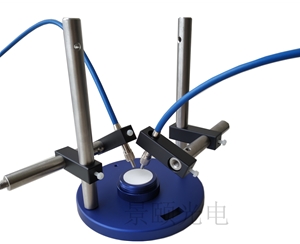
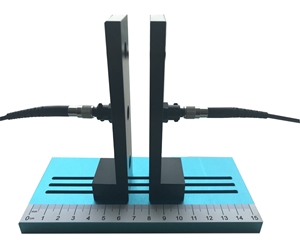
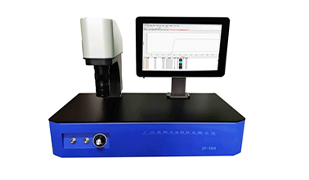
The evaluated 84 mm three-port sphere (0° entry, zenith sample, 90° detector) eliminated reconfiguration entirely. Once aligned, only sample holders needed swapping for different fixture geometries.
| Test Item |
System A |
Legacy Discrete Path |
Improvement |
| Optical reconfiguration time |
0 min |
12–15 min |
100% elimination |
| Optical reconfiguration error |
< 1.2% |
3.7% |
−68% |
| 250–400 nm reflectance |
98.8% |
98.5% (ref. plate) |
+0.3% |
| Post-warmup stability (5 min) |
Drift < 0.005 |
Drift < 0.008 |
Improved |
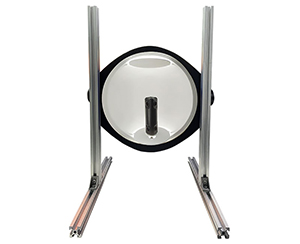
The diffuse cavity provided 2π steradian uniform illumination. R&D test cycles compressed from 40 minutes to under 8 minutes per sample. One constraint: 84 mm sphere diameter cannot accommodate whole-luminaire testing. Fixtures exceeding this physical envelope require 150 mm or larger spheres.
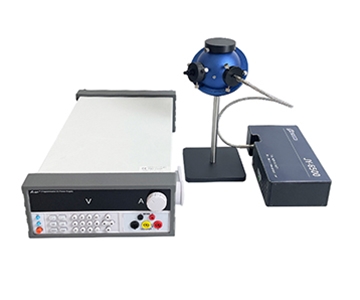
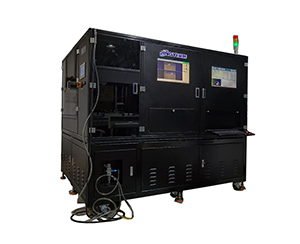
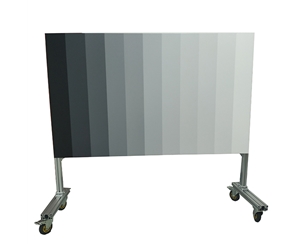
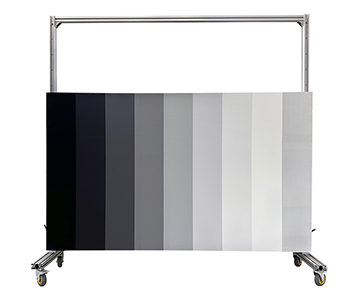
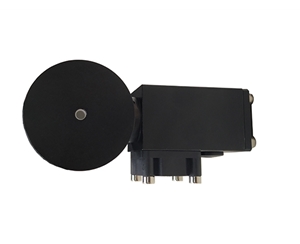
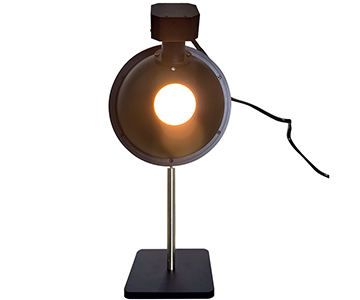
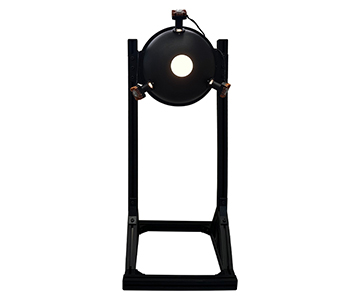
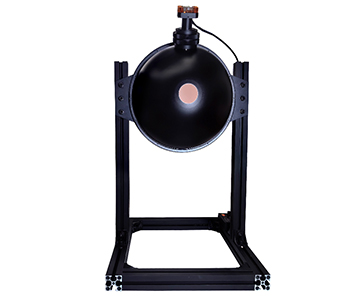
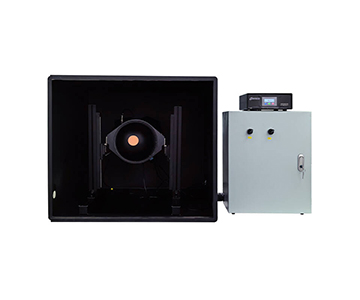
Case Study 3: Automotive Lighting — Reflectance Sphere and Metrological Traceability
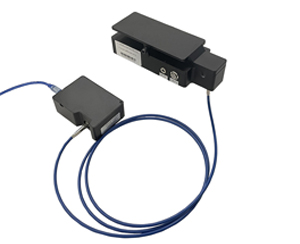
An automotive lighting supplier's metrology lab required reflectance traceability for vacuum-aluminized reflector cups. At 8° incidence, these specimens exhibited high specular reflection content. Conventional spheres lacking light-trap geometry produced false high-reflectance readings when specular components reached the detector directly.
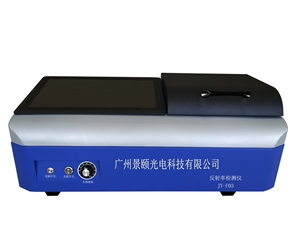
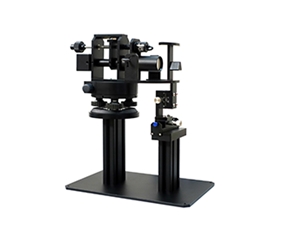
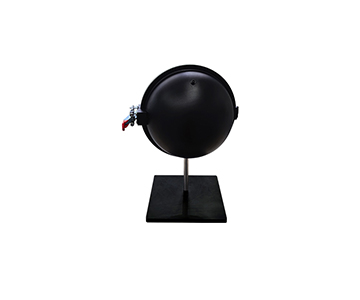
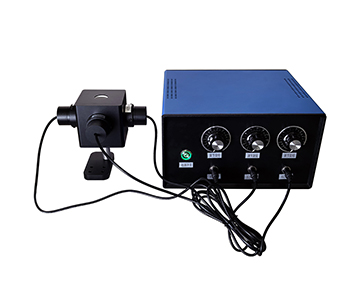
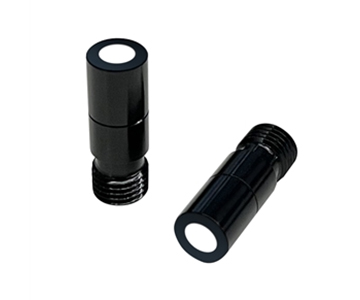
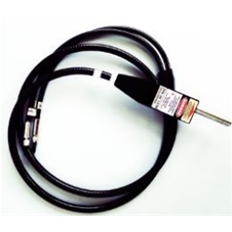
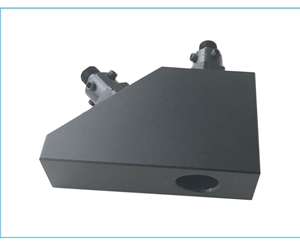
A 15 mm reflectance sphere with 5 mm sample port was configured with pre-sample collimator at 8° to surface normal and perpendicular detector output. The critical element: a custom light trap that intercepted specular reflection, permitting measurement of diffuse reflectance alone.
| Test Item |
System A (with trap) |
System A (no trap) |
System B (with trap) |
| Specular reflection rejection |
97.3% |
0% |
98.1% |
| Diffuse reflectance (600 nm) |
92.4% |
99.1% (artifact) |
92.7% |
| Repeatability (10 runs) |
0.18% |
0.15% |
0.12% |
| Trap customization lead time |
7 days |
— |
21 days |
With trap installed, diffuse reflectance deviation from the import reference was 0.3%. The 0.18% repeatability met reflectometer standards (≤ 0.5% per JJG 453-2005). A geometric constraint: 15 mm diameter limits sample size to approximately 5 mm. Larger specimens require 36 mm or greater port diameter.
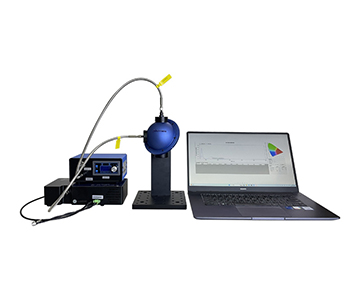
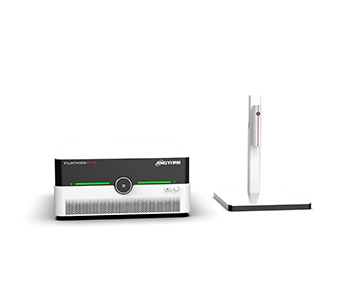
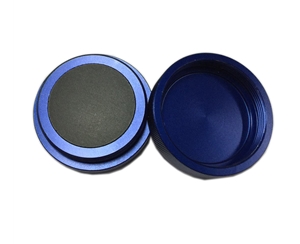
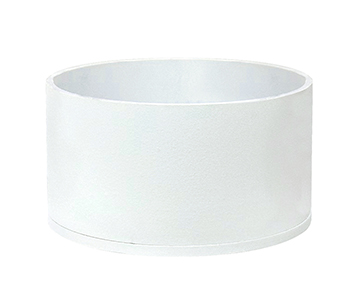
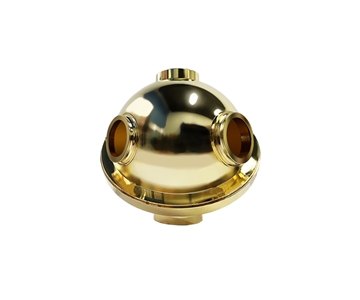
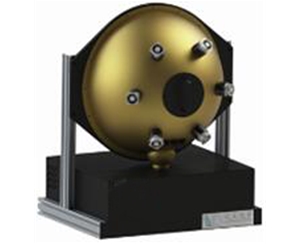
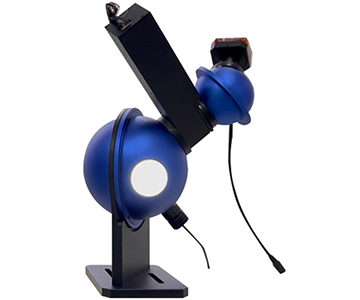
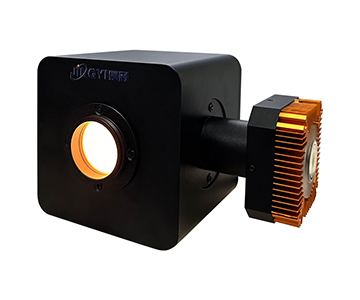
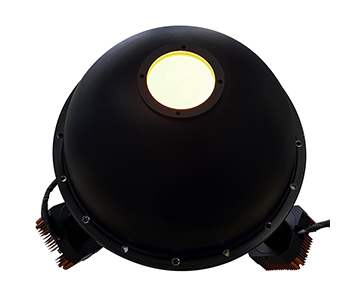
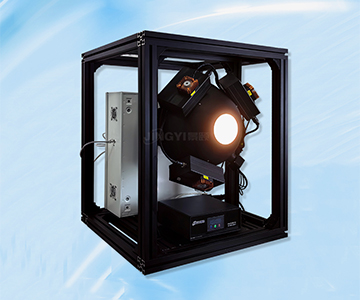
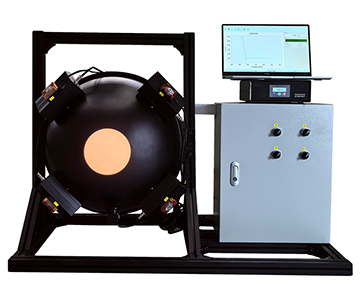
Case Study 4: Infrared Laser Power — Gold-Coated Sphere and Photodetector Calibration
A photodetector manufacturer needed batch calibration of InGaAs detector responsivity at 1064 nm. PTFE coating maintains high infrared reflectance, but watt-class continuous-wave lasers risk thermal damage. Additionally, the 19°C phase transition introduces systematic error in high-power measurements where thermal gradients already challenge stability.
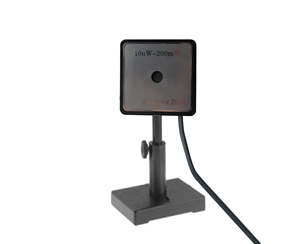
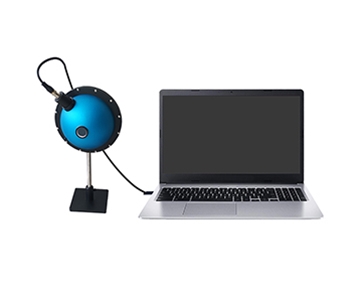
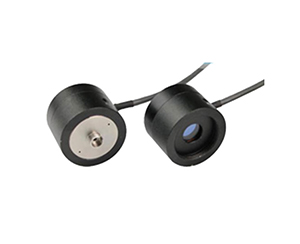
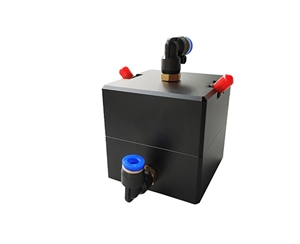
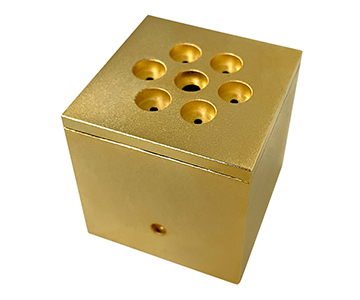
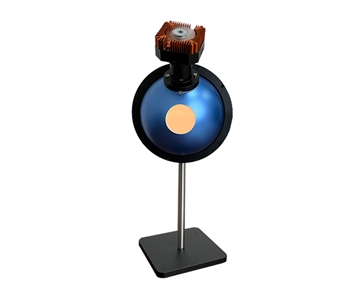
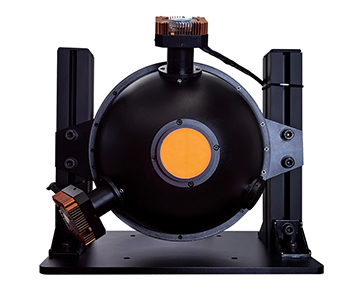
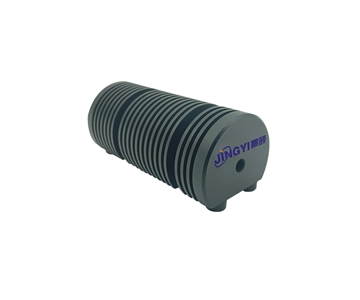
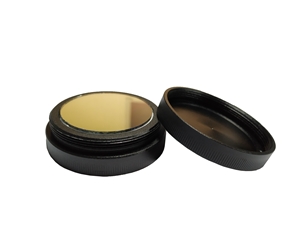
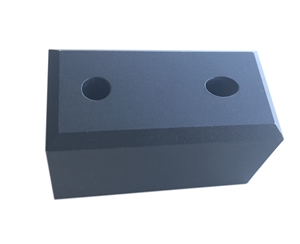
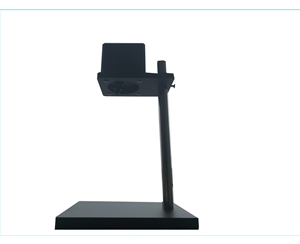
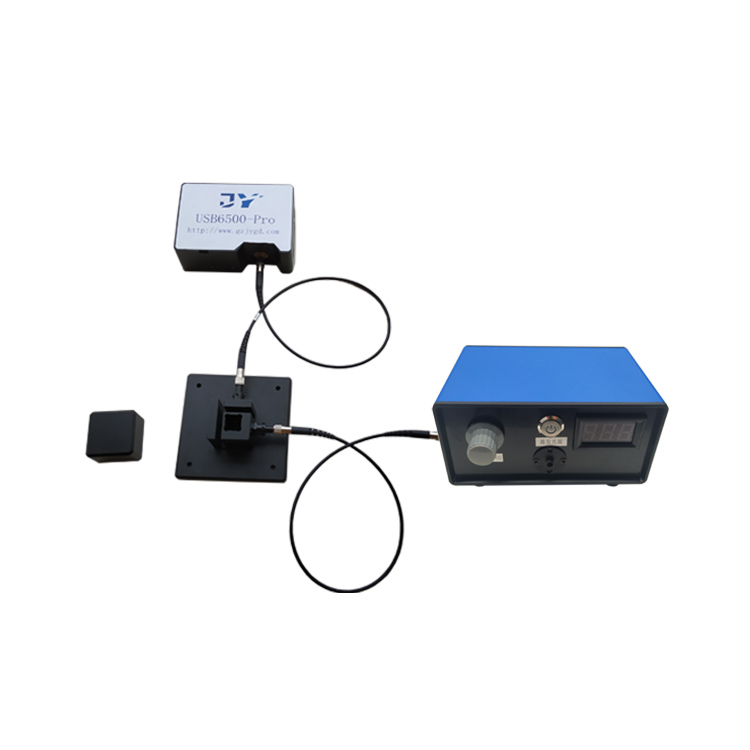
A 70 mm gold-coated aluminum sphere was evaluated. Electroplated 24K gold provided > 94% reflectance at 1064 nm with > 99% exit port uniformity. Mass was 0.42 kg, compatible with automated fixture handling.
| Test Item |
Gold-Coated IR Sphere |
PTFE General |
Import Gold-Coated |
| Reflectance (1064 nm) |
94.2% |
99.0% |
94.5% |
| Power handling |
Air-cooled, 5 W continuous |
< 1 W continuous |
Air-cooled, 5 W continuous |
| Temperature stability (20–30°C) |
Drift < 0.3% |
Drift < 1.8% |
Drift < 0.2% |
| Weight |
0.42 kg |
0.37 kg (36 mm) |
0.55 kg |
Reflectance at 1064 nm matched the import unit. Temperature stability was 0.1 percentage point less favorable. However, the 23.6% mass reduction improved robotic arm payload compatibility. The fundamental trade-off: 94% reflectance means 6% energy absorption at the wall. At watt-class power, forced air cooling is mandatory to prevent thermal expansion and cavity geometry distortion.
Cross-Tier Comparison
Aggregating repeatability, speed, cost, and service metrics from all four campaigns:
| Dimension |
Import High-End |
System A (Mainstream) |
Economy Domestic |
| Sphere diameter range |
50–300 mm |
10–200 mm |
10–84 mm |
| Coating reflectance |
99.3% (Spectralon) |
99% (PTFE foam) |
97% (BaSO₄) |
| Spectral range |
200–2500 nm |
200–2500 nm |
350–2400 nm |
| Repeatability (1σ) |
0.12% |
0.18% |
0.35% |
| Single test cycle |
5.2 s |
6.8 s |
9.5 s |
| Optical reconfiguration |
8 min |
0 min (modular) |
15 min |
| Warranty |
1 year |
1 year |
1 year |
| Customization response |
21–45 days |
7 days |
14 days |
| Price factor |
3.2× |
1.0× (baseline) |
0.6× |
| Temperature sensitivity |
Low (operates outside phase transition) |
Medium (requires 23°C ± 2°C) |
High (BaSO₄ hygroscopic) |
The 0.06 percentage point repeatability gap and 1.6-second cycle time differential represent real performance separation. Yet modular design eliminated optical reconfiguration time entirely, improving net throughput in R&D environments. The economy tier's BaSO₄ coating loses up to 2% reflectance above 60% RH—a material limitation requiring humidity control.
Field Feedback
A photovoltaic module testing center (anonymized per GDPR) provided three-month operational data on System A for perovskite cell quantum efficiency measurement:
"After three months of continuous operation, 400 nm reflectance declined from 99.1% to 98.6%—a 0.5% degradation. This rate was acceptable for our process, but quarterly standard-plate comparison calibration was required. The import unit we ran in parallel degraded approximately 0.3% over the same interval, permitting semi-annual calibration. The decisive advantage was customization response: a sample port expansion from 43 mm to 55 mm was delivered in 7 days versus six weeks through the import channel."
This feedback contains a measured negative: the 0.2 percentage point per quarter additional degradation rate reflects microstructural density differences between foam-molded PTFE and compression-molded Spectralon.
Error Budget and Operational Recommendations
Five nodes dominate integrating sphere measurement uncertainty:
Coating uniformity.Foam-molded PTFE wall thickness consistency directly affects cavity field distribution. Foam molding shows approximately 0.3% better reflectance stability than sprayed coatings.
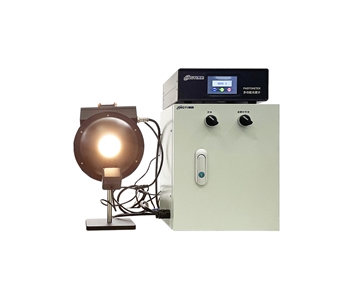
Source stability.Tungsten-halogen lamps stabilize to < 0.5% intensity drift after 30 minutes. LED array sources improve this to < 0.2%, but lack energy below 350 nm without deuterium supplementation.
Sample positioning.Transmittance measurement accuracy depends on sample-to-port seal integrity. A 10 mm sphere with 1.5 mm input aperture demands fixture-mounted positioning; hand placement is inadequate.
Thermal coupling.PTFE phase transition in the 17–24°C range produces output flux variation equivalent to 0.09% reflectance drift. For 0.1% accuracy class metrology, ambient temperature must be maintained outside this transition band (below 17°C or above 24°C).
Detector response.Spectrometer UV responsivity roll-off requires software compensation. SMA905 fiber connectors introduce approximately 3% Fresnel reflection loss in the UV; FC connectors reduce this for precision applications.
Deployment guidance:
Production inspection: select foam-molded PTFE, diameter ≥ 25 mm, balancing positioning tolerance against field uniformity
R&D characterization: prioritize three-port modular geometry to eliminate reconfiguration overhead
High-power infrared: mandate gold-coated spheres with forced air cooling
Application Boundaries
Three conditions define clear limitations for domestic PTFE integrating spheres:
Ultra-high precision metrology.When measurement uncertainty must be < 0.1%, neither System A (0.18% repeatability) nor the import high-end unit (0.12%) can independently satisfy the requirement. Periodic third-party calibration against NIST-traceable standards remains necessary. The import unit provides larger uncertainty margin.
Extreme environment operation.Water analysis spheres rated for 0–50°C (32–122°F) approach boundary conditions in uncontrolled outdoor deployment. Sustained exposure above 100°C accelerates PTFE micropore collapse and reflectance degradation. Gold-coated spheres tolerate higher temperatures, but 6% energy absorption at 94% reflectance creates thermal management requirements at high power density.
Oversized specimen compatibility.Open-structure spheres at 200 mm diameter with 60 × 60 mm sample supports cannot accommodate larger curved specimens such as complete headlamp assemblies. Custom 300 mm+ spheres are possible, but enlarged ports degrade cavity uniformity from 98% to below 95%—a fundamental geometric optics constraint.
Frequently Asked Questions
Q1: Does 99% coating reflectance mean measurement error is negligible?
No. The 99% figure is a nominal value under ideal conditions. In practice, source instability, sample positioning variation, temperature fluctuation, and detector nonlinearity compound to produce total system uncertainty typically in the 0.5%–2% range. Coating reflectance is one term in a multi-component error budget.
Q2: How is sphere diameter selected?
Diameter determines field uniformity and specimen compatibility. Ranges: 10–15 mm for fiber coupling and micro-area transmittance; 25–36 mm for portable applications with moderate positioning tolerance; 84–100 mm as the general R&D benchmark; 150 mm+ for complete luminaires or large-area samples. Smaller diameters demand tighter positioning precision.
Q3: What separates PTFE and gold-coated sphere applications?
PTFE covers 200–2500 nm at 99% reflectance, suitable for UV-visible-near-IR measurements from low to medium power. Gold coating spans 0.7–20 μm at 94% reflectance, designed for high-power laser measurement from watt to kilowatt class. Spectral overlap exists at 700–2500 nm, but power density exceeding 1 W/cm² requires gold.
Q4: What is the maintenance cost differential between domestic and import equipment?
Domestic coating degradation runs approximately 0.5% per quarter versus 0.3% for import units, corresponding to quarterly versus semi-annual calibration frequency. However, domestic customization lead time of 7 days versus 21–45 days for import channels often dominates total cost of ownership in urgent production scenarios.
Q5: How can reflectance specifications be independently verified?
After acquisition, compare sphere output against NIST-traceable standard diffuse reflectance plates (e.g., Spectralon) under identical optical conditions. Deviation exceeding ±1% from nominal indicates coating degradation requiring refurbishment or liner replacement. Routine maintenance: avoid organic solvent contact with PTFE surfaces to preserve micropore structure.
About This Guide
Data Sources:NIST SP 250-series calibration procedures, SEMI D81/D82 display measurement standards, IEC 62341-6-1 optical parameter test methods, in-fab validation reports (n = 4 industry campaigns), Royal Holloway University PTFE phase transition research (Ball et al., 2013,Applied Optics52, 4806–4812), and industry public information.
Author:Senior Application Engineer, Optical Metrology Division, 12 years in industrial precision measurement equipment development and field validation.
Disclosure:Jingyi Optoelectronics manufactures integrating sphere systems and optical measurement instruments. This assessment is based on published specifications, independent laboratory data, and customer-authorized field measurements. No compensation was received from third-party brands mentioned.
Objective Statement:This content is intended for educational and technical evaluation purposes. Equipment selection should always include independent proof-of-concept validation under your specific process conditions and environmental constraints.
Last Updated:June 2026
For detailed specifications and application notes on integrating sphere systems, search "Jingyi Optoelectronics integrating sphere" or visit our technical library.