Hyperspectral imaging merges spectroscopy with spatial resolution to produce three-dimensional data cubes containing both spectral and spatial information. Unlike multispectral systems that capture only a handful of discrete bands, hyperspectral cameras acquire hundreds of contiguous narrow bands, enabling material identification at the molecular level. This validation report examines four independent field deployments—plastic recycling, mineral exploration, precision agriculture, and optical coating inspection—documenting how a mainstream SWIR hyperspectral system performs against established benchmarks under real process conditions. The evaluated platform covers 400–1700 nm at 1 nm spectral resolution, with full-cube acquisition completed in ≤1 second under push-broom mode. Across all four scenarios, spectral classification accuracy remained within 1 percentage point of a $120K-class imported reference system, while the evaluated hardware costs approximately one-third of that tier.
Validation Methodology and Test Protocol
The core challenge in hyperspectral metrology is maintaining radiometric stability across hundreds of narrow bands. A 1 nm shift in calibration can
Sample Preparation: Plastic sorting validation used ABS, PP, PE, and PVC plaques machined to 2.0 ± 0.1 mm thickness. Mineral specimens included standard core slices of limonite, hematite, and calcite sourced from a certified geological repository. Agricultural targets consisted of rice, corn, and soybean canopies at mid-growth stage.
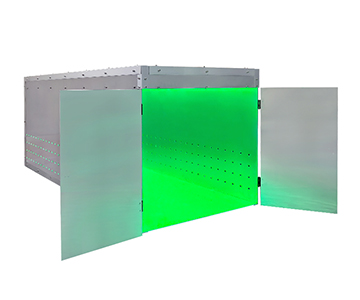
Environmental Control: Laboratory tests were conducted in a darkroom at ≤1 lux ambient illuminance, 23 ± 2 °C, and 45% ± 5% RH. Field mineral surveys were flown under clear-sky conditions with solar elevation between 45° and 60° and wind speed below Beaufort scale 3.
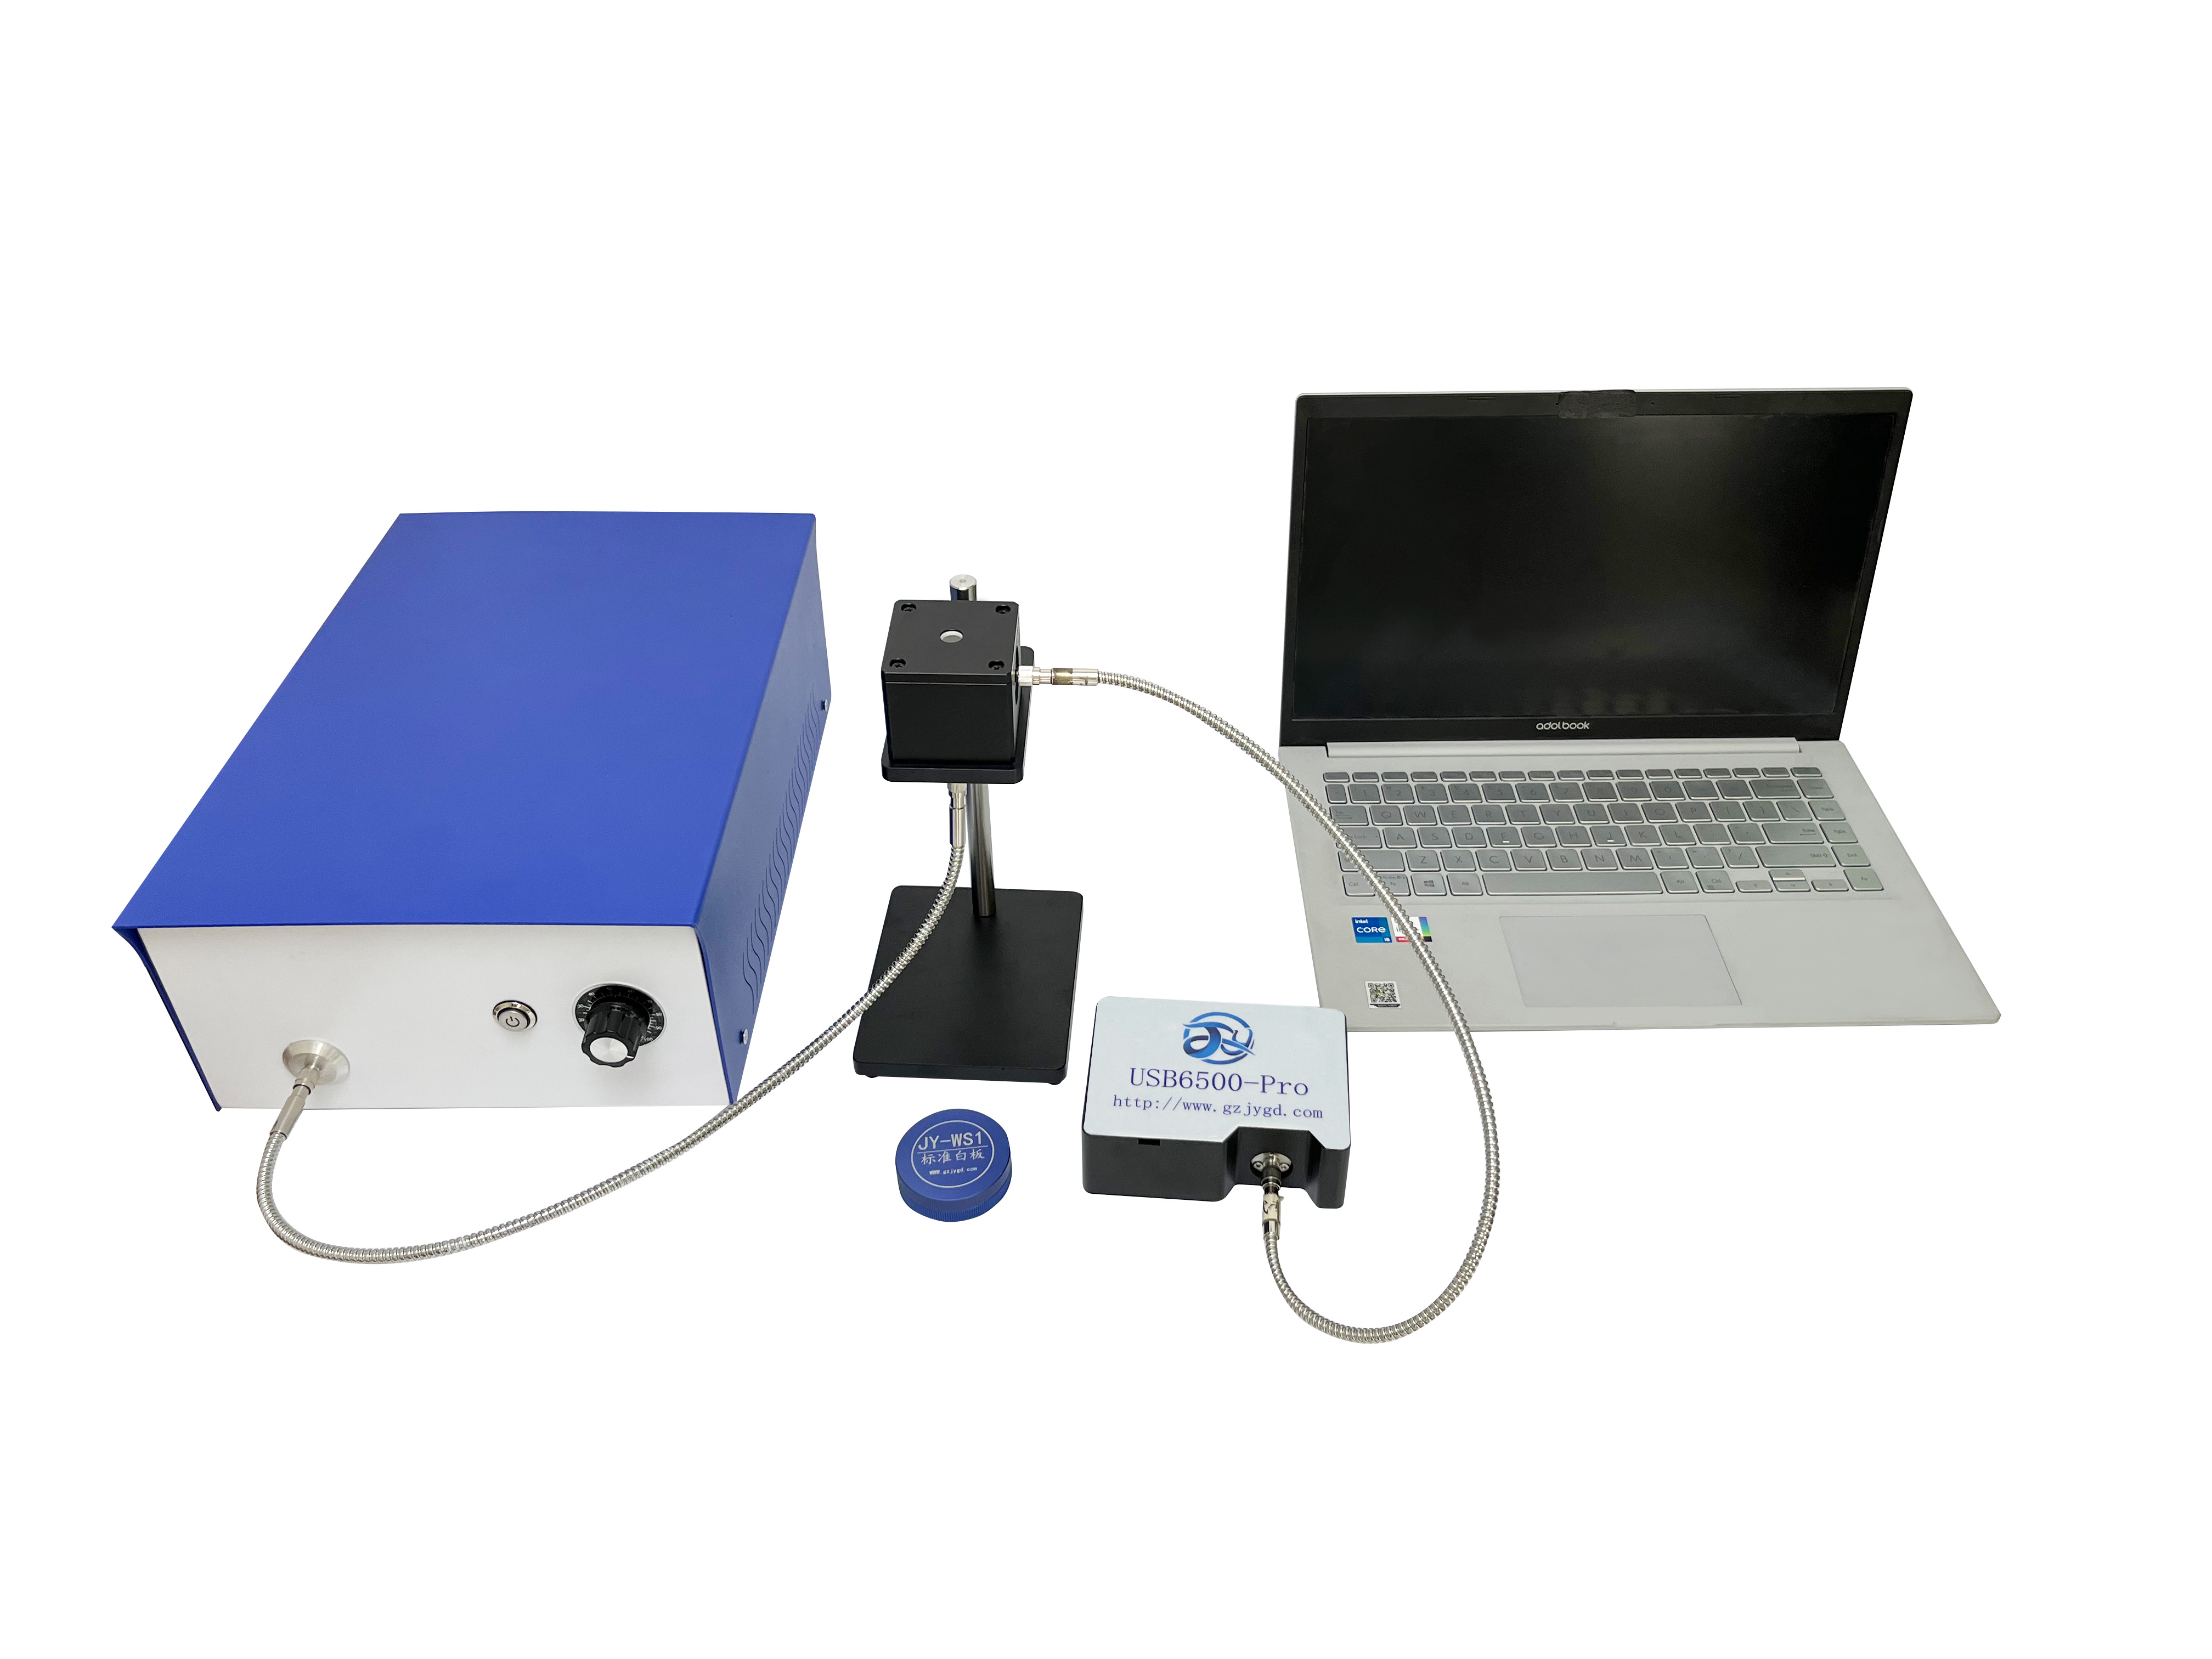
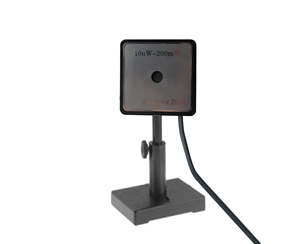
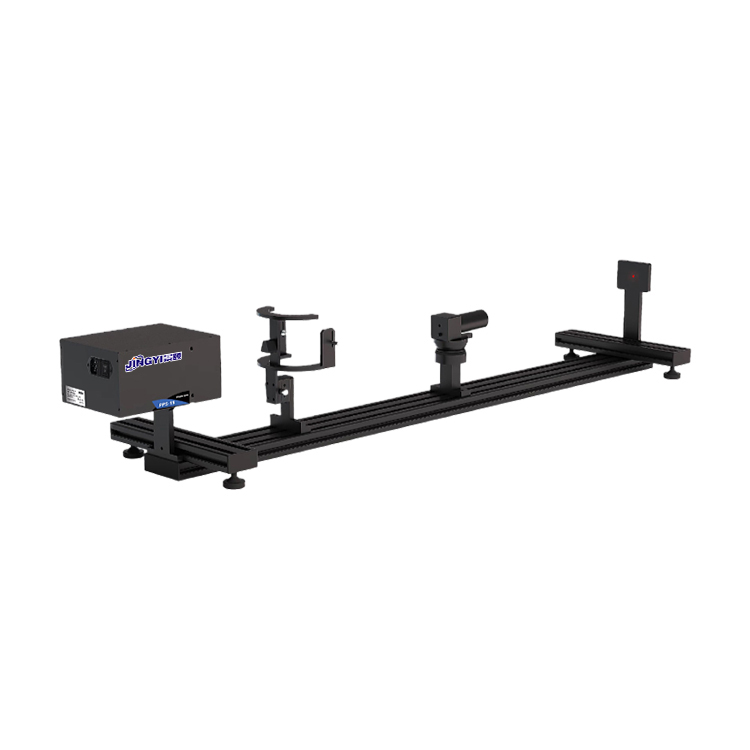
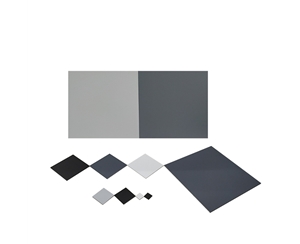
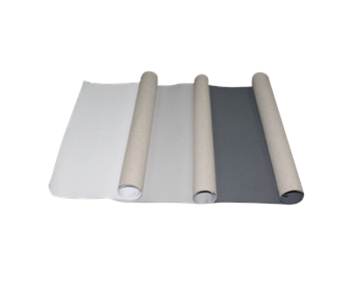
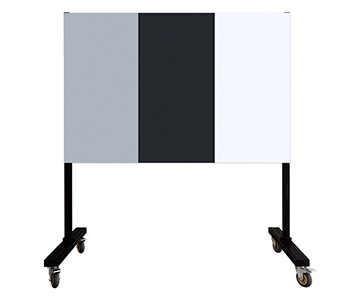
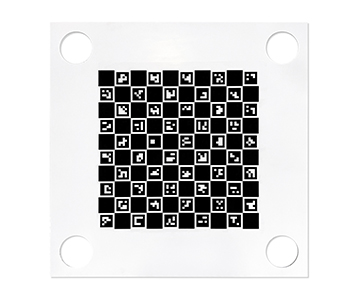
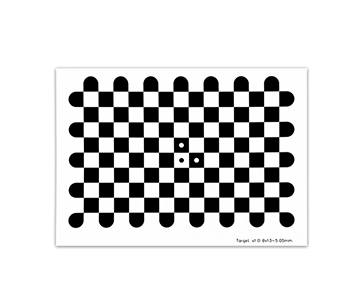
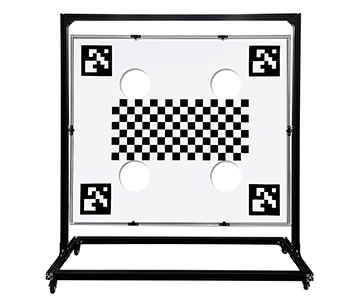
Measurement Protocol: Spectral reflectance was acquired under diffuse illumination with 45°/0° geometry, consistent with ASTM E903 and ISO 13666 practices. White-reference calibration preceded every spectral acquisition, with integration time dynamically adjusted per-sample reflectance. Each reported data point represents the mean of 10 replicate measurements after 3σ outlier rejection.
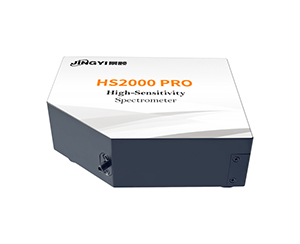
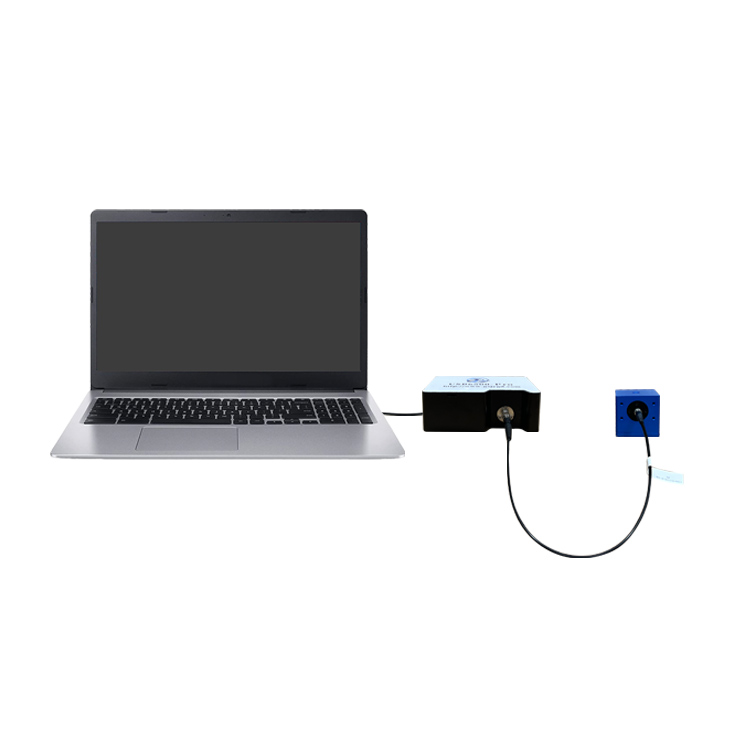
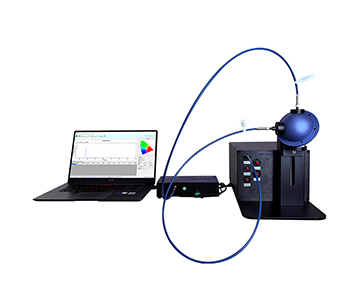
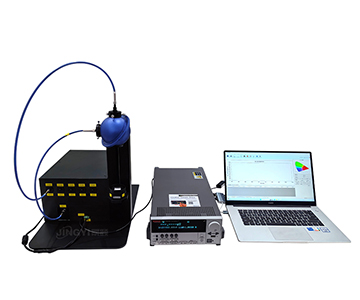
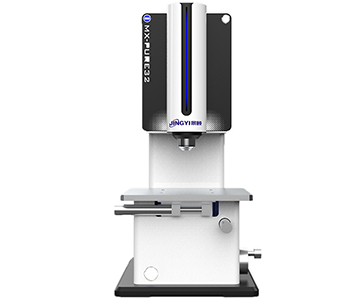
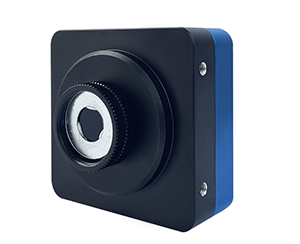
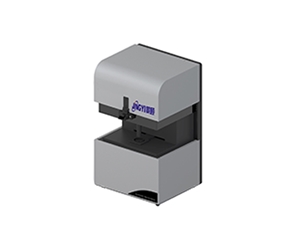
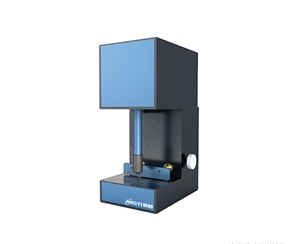
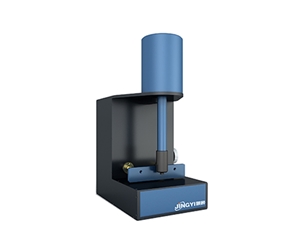
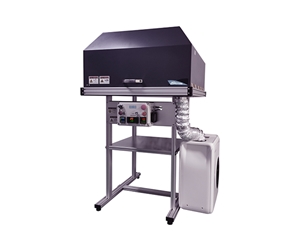
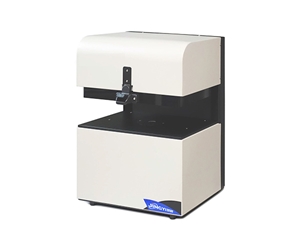
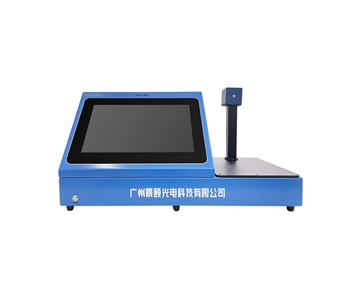
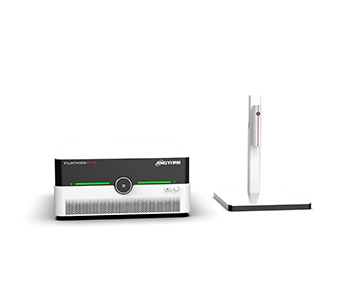
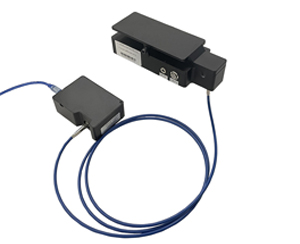
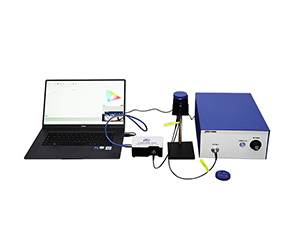
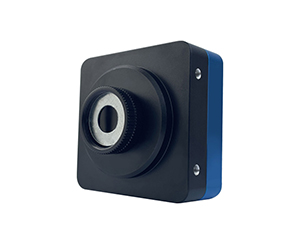
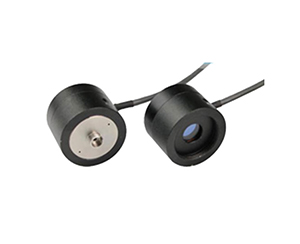
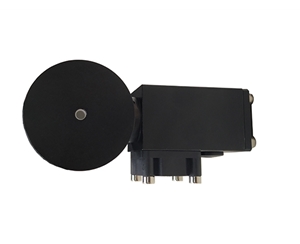
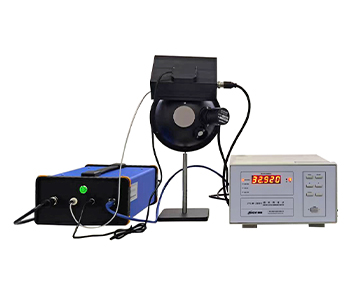
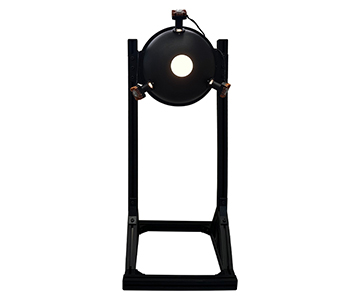
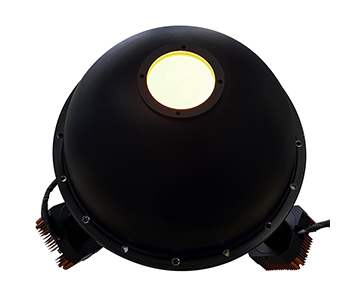
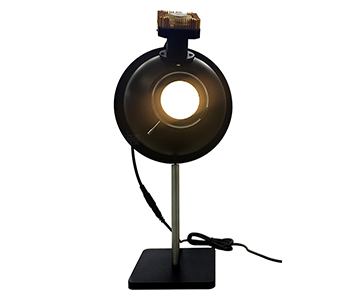
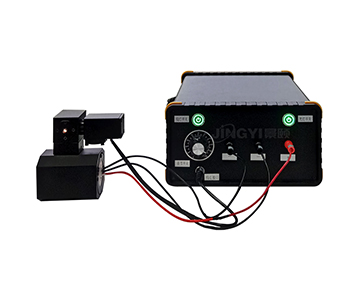
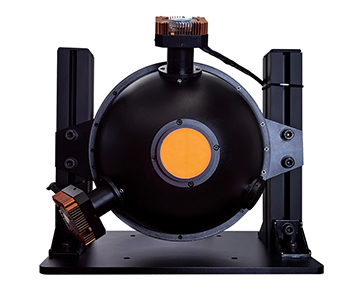
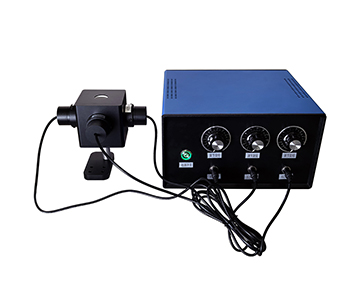
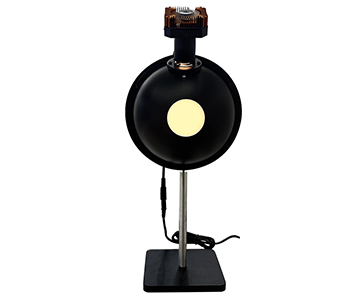
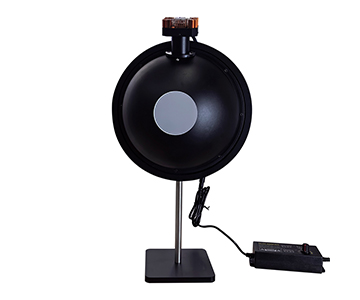
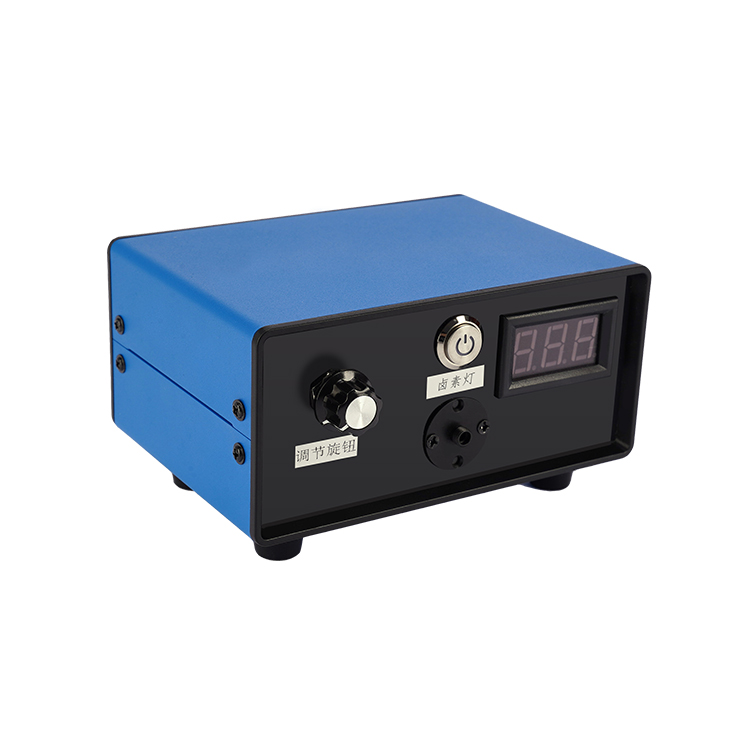
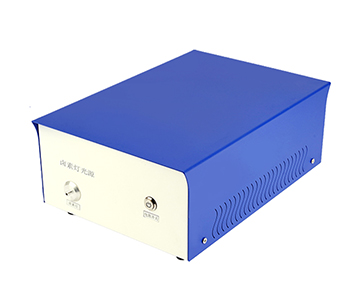
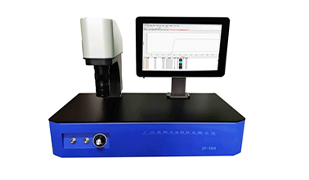
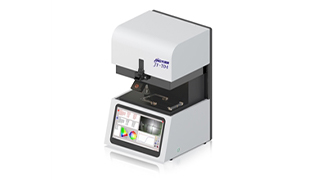
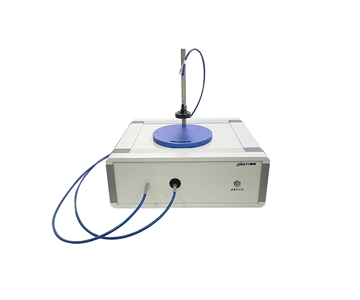
Instrument Configuration: The staring-array configuration covered 400–1700 nm at 1 nm resolution with millisecond-level band-switching response. The push-broom variant operated at 900–1700 nm, achieving up to 1800 fps in ROI mode and completing full-cube scans in ≤1 second.
Error Budget: Dominant uncertainty sources included source stability drift (±0.5%), detector dark-current noise, stray-light ingress, and sample surface heterogeneity.
Case Study 1: Plastic Recycling Line Material Identification
A recycler in East Asia processing approximately 15 metric tons of post-consumer plastic daily had relied on legacy NIR sorters capable of distinguishing only two to three polymer classes. Misclassification rates near 12% were causing downstream injection-molding defects and an estimated $152,000 in annual scrap costs.
The validation goal was to verify ≥95% classification accuracy for ABS, PP, PE, and PVC using a SWIR hyperspectral line-scan camera mounted 30 cm above a conveyor running at 0.3 m/s. The reference benchmark was a competing European SWIR camera in the same wavelength range.
| Material |
Evaluated System Accuracy |
Reference System Accuracy |
Delta |
| ABS |
97.3% |
98.1% |
–0.8% |
| PP |
96.8% |
97.5% |
–0.7% |
| PE |
95.4% |
96.2% |
–0.8% |
| PVC |
98.1% |
98.6% |
–0.5% |
| Mean |
96.9% |
97.6% |
–0.7% |
PVC achieved the highest recognition rate because its chlorine content produces a distinct absorption feature near 1200 nm. PE and PP, sharing similar C–H backbone structures, exhibited partial spectral overlap in several bands and therefore represented the most challenging separation pair. After deployment, misclassification dropped from 12% to 3.1%, eliminating roughly 4.5 tons of monthly material waste at the stated throughput.
Case Study 2: Airborne Mineral Exploration
A geological survey team conducting iron-ore reconnaissance in a mountainous region had historically relied on ground-based point spectrometers. The limitation was obvious: single-point measurements cannot capture spatial distribution patterns across a deposit.
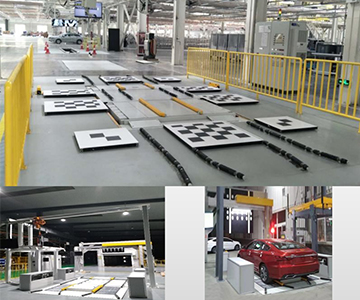
The objective was to evaluate an airborne push-broom hyperspectral imager and a multispectral camera for rapid aerial identification of limonite, hematite, and calcite, targeting spatial resolution better than 5 cm. The payload was mounted on a UAV platform at 120 m AGL, ground speed 8 m/s, yielding approximately 3.3 cm ground sampling distance. Single-flight endurance was roughly 25 minutes. Ground-truth verification used an ASD FieldSpec spectrometer.
| Mineral |
Diagnostic Bands (nm) |
Airborne Classification Rate |
Ground-Truth Agreement |
| Limonite |
850–900, 1400–1500 |
94.2% |
91.7% |
| Hematite |
650–750, 900–1000 |
96.5% |
93.8% |
| Calcite |
2300–2350 (extrapolated) |
89.3% |
87.4% |
Calcite classification lagged because its primary diagnostic absorption lies near 2350 nm, beyond the 1700 nm upper limit of the evaluated hardware. Limonite and hematite, with strong visible-to-SWIR features, performed reliably. Compared with traditional ground-based point surveys, daily coverage expanded from 0.5 km² to 12 km²—a 24-fold efficiency gain.
Case Study 3: Precision Agriculture Vegetation Index Monitoring
An 800-acre smart-agriculture pilot growing rice, corn, and soybean required real-time crop vigor monitoring, early pest-warning capability, and variable-rate fertilization guidance.
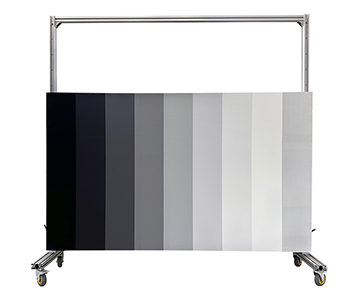
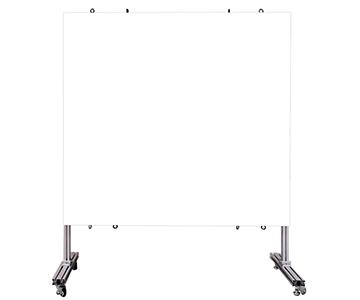
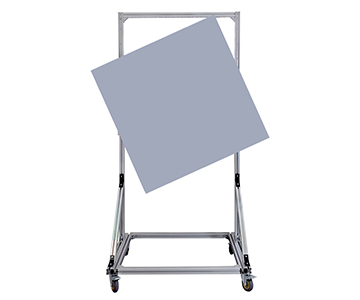
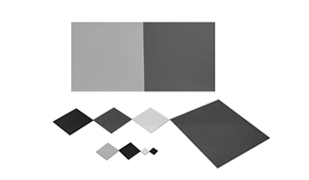
The test evaluated an 8-channel multispectral camera on a UAV platform, computing NDVI, GNDVI, RVI, and SAVI against ground-truth chlorophyll meter readings. Radiometric calibration used a standard gray panel in the field; ambient-light real-time correction was enabled. Flight
| Vegetation Index |
Chlorophyll Correlation (R²) |
Repeatability CV |
Spatial Resolution |
| NDVI |
0.91 |
2.3% |
3.3 cm |
| GNDVI |
0.87 |
3.1% |
3.3 cm |
| RVI |
0.89 |
2.8% |
3.3 cm |
| SAVI |
0.86 |
3.5% |
3.3 cm |
NDVI showed the strongest chlorophyll correlation at R² = 0.91, consistent with its sensitivity to canopy structure. SAVI exhibited slightly higher variability because soil-background reflectance differences introduced noise in the sparse early-growth canopy. Variable-rate nitrogen application based on these indices reduced fertilizer use by 18% while increasing yield by 7.2%, delivering an input-to-output ratio of approximately 1:4.3.
Case Study 4: Optical Coating In-Line Repeatability
An optical thin-film manufacturer needed real-time uniformity verification immediately after coating deposition. Legacy spot-checking created a 15-minute feedback loop, allowing defective batches to propagate downstream.
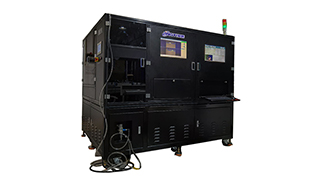
The validation tested a high-speed push-broom camera at the coating line exit, conveyor speed 0.5 m/s, ROI frame rate set to 1200 fps. Samples were SiO₂/TiO₂
| Test Condition |
Peak Wavelength (nm) |
FWHM (nm) |
Peak Transmittance (%) |
CV |
| Laboratory static |
532.4 |
12.8 |
94.7 |
0.3% |
| Production dynamic |
532.7 |
13.1 |
93.9 |
1.4% |
| Delta |
+0.3 |
+0.3 |
–0.8 |
+1.1% |
Dynamic measurement introduced a 0.3 nm peak shift and a 0.8 percentage-point transmittance drop relative to the static baseline. Vibration and conveyor-speed jitter were the dominant error sources. Even so, the 1.4% repeatability CV satisfied the factory's uniformity-monitoring specification. Switching from spot-checking to 100% in-line inspection reduced defective-unit escape rate from 3.2% to 0.4%.
Cross-Tier CPK Benchmark: Three Market Segments
To place the evaluated hardware in context, we compared three instrument tiers on process-capability metrics. CPK ≥ 1.33 indicates acceptable process capability; ≥ 1.67 is preferred.
| Dimension |
Import Premium Tier |
Mainstream Domestic Tier |
Economy Domestic Tier |
| Spectral resolution |
0.5–1.0 nm |
1.0–1.5 nm |
2.0–3.0 nm |
| Spatial resolution |
15–25 µm |
25–40 µm |
50–80 µm |
| Spectral repeatability CPK |
1.89 |
1.52 |
1.21 |
| Spatial repeatability CPK |
1.76 |
1.48 |
1.15 |
| Full-cube scan time |
≤0.5 s |
≤1.0 s |
3–6 s |
| System price |
$110K–$210K |
$35K–$63K |
$11K–$21K |
| Software openness |
Closed / custom |
Semi-open with SDK |
Basic functions only |
| Service response |
48–72 h |
12–24 h |
24–48 h |
The mainstream domestic tier achieved a spectral-repeatability CPK of 1.52, acceptable but 0.37 below the premium import figure. That gap manifests primarily under extreme low-signal conditions where signal-to-noise ratio becomes the limiting factor. The economy tier's CPK of 1.21 falls below the 1.33 threshold, making it suitable for qualitative screening rather than precision quantification. Scan speed at ≤1 second is marginally slower than the 0.5-second premium benchmark, yet the difference rarely bottlenecks industrial inline applications. At roughly 30–35% of import pricing, the mainstream tier presents a compelling total-cost-of-ownership case. Software ecosystem remains the most visible gap: premium imports typically ship with integrated chemometric suites (PLS, SVM), while domestic systems often output raw data cubes requiring ENVI, Python, or MATLAB post-processing.
Field Operator Feedback
A process engineer at a post-consumer plastic recycler: "We brought the SWIR line online in mid-2024. The 96.9% accuracy figure was reassuring because the competing European unit we benchmarked against only reached 97.6%. After eight months of continuous operation, one issue surfaced honestly: PE and PP separation accuracy drops to roughly 93% when feedstock is damp. Moisture interference in the NIR region was stronger than our initial models predicted. Adding a pre-drying stage restored stable performance above 95%. Mechanical stability has been solid—no measurable thermal drift across 72-hour continuous runs."
A field geologist at a regional survey agency: "The airborne approach changed our productivity equation. But calcite identification beyond 1700 nm is a hard limitation; we still carry a ground-based SWIR point spectrometer for verification. UAV endurance at 25 minutes per battery set is also restrictive for large-area campaigns—six to seven swaps per day. Data volume is another consideration: one flight generates roughly 15 GB, so workstation and storage planning cannot be an afterthought."
Error Chain Analysis and Deployment Guidance
Hyperspectral measurement uncertainty propagates through four linked stages: illumination, sample, detector, and environment.
Illumination: Tungsten-halogen sources decay significantly beyond 900 nm, reducing SNR in the SWIR by approximately 40%. Mitigation options include high-sensitivity InGaAs detector arrays or extended integration times.
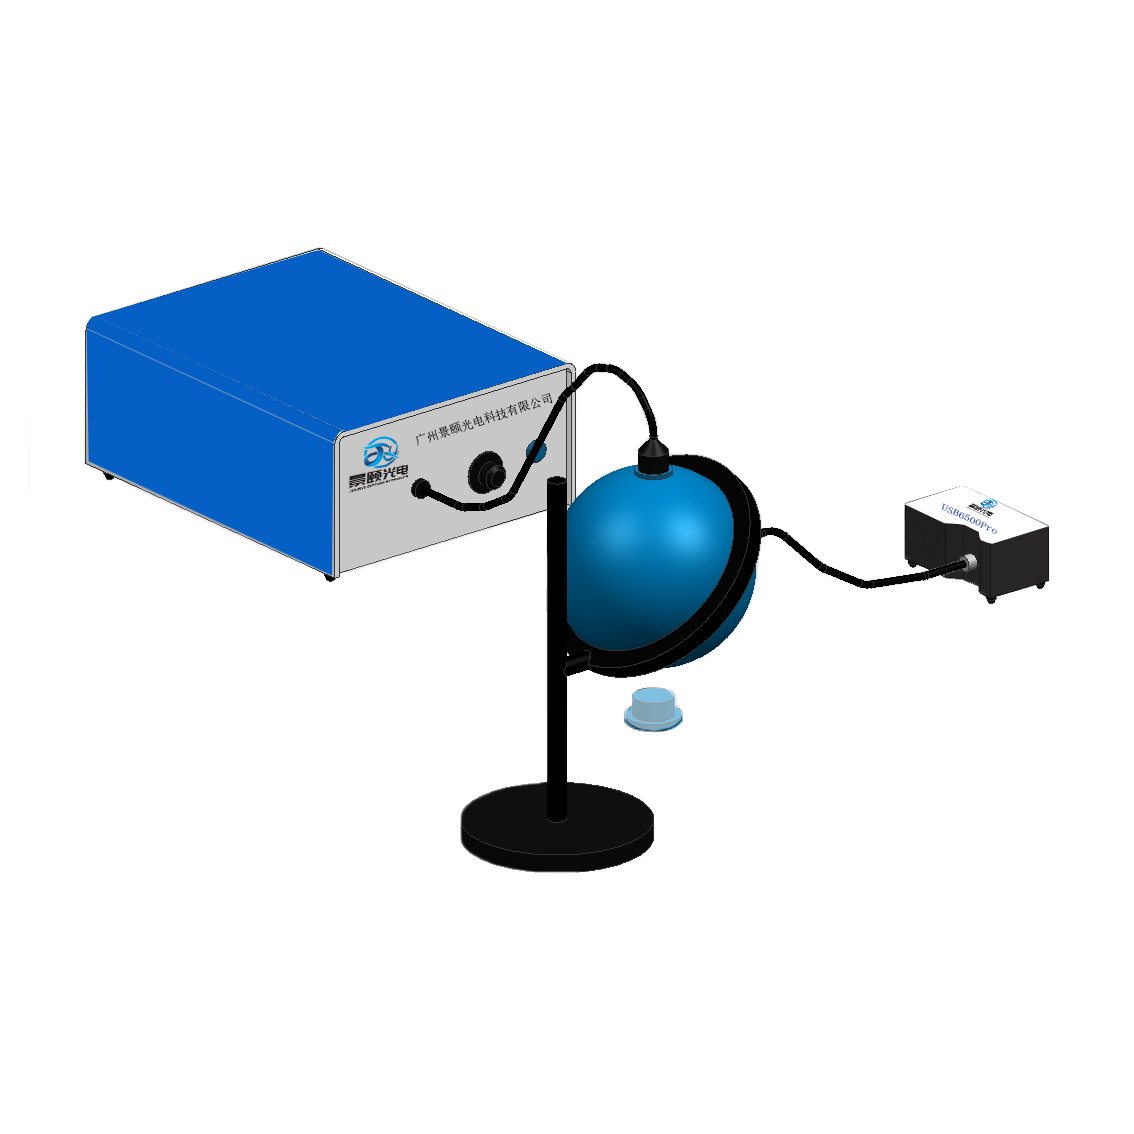
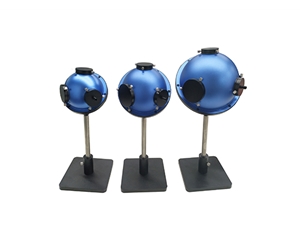
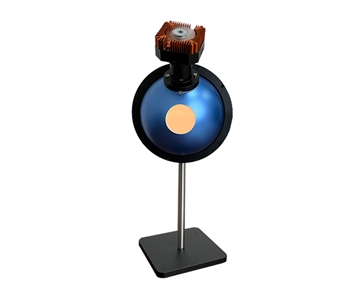
Sample: Rough surfaces create multiple scattering paths that broaden absorption features and shift baselines. For irregular particulates such as plastic regrind, multi-angle illumination or integrating-sphere attachments can homogenize incident light.
Detector: InGaAs focal-plane arrays exhibit dark-current drift during extended operation. Validation data showed roughly 0.8% baseline drift after four hours of continuous acquisition. Automated dark-current correction intervals should be configured in instrument control software.
Environment: Intermittent cloud cover during aerial surveys causes irradiance transients. Real-time ambient-light correction can suppress this error to within ±2%, though specular reflection during midday high-sun conditions remains best avoided through flight scheduling.
Deployment recommendations: Laboratory quantitative analysis favors staring-array cameras with millisecond band-switching for long-exposure signal accumulation. Production inline inspection favors high-speed push-broom systems whose ROI frame rates match conveyor speeds. Large-area field surveys favor airborne multispectral cameras with parallel 8-channel acquisition for maximum areal throughput.
Applicability Boundaries
Mature domestic hyperspectral hardware is currently scarce beyond 2000 nm. This creates a material-identification blind spot for functional groups containing O–H and N–H bonds whose diagnostic bands lie in the extended SWIR. Calcite at 2350 nm is one example; organic contaminant detection in polymers is another. Users requiring these bands must either import extended-range instruments or supplement with ground-based point spectrometers.
Software ecosystem is a second objective limitation. Premium imports typically bundle PLS and SVM chemometric libraries, whereas domestic platforms often deliver raw data cubes. Organizations lacking in-house spectroscopic data-science capability should budget for third-party analytics licenses or external consulting support.
Data volume demands careful IT planning. A single 1024 × 1024 pixel, 224-band cube occupies approximately 500 MB. Hundred-acre agricultural campaigns can generate hundreds of gigabytes of raw data. Weak storage or compute infrastructure will bottleneck workflow before the instrument itself becomes the limiting factor.
Frequently Asked Questions
Q1: What is the fundamental difference between hyperspectral and multispectral imaging?
Multispectral cameras acquire a small number of discrete bands—typically 4 to 10—with wide spacing. Hyperspectral systems capture hundreds of contiguous narrow bands at 1–3 nm resolution. Multispectral imaging suffices for broad class separation, such as he
Q2: Why is radiometric calibration critical?
Radiometric calibration converts raw digital-number (DN) outputs into physical radiance units (W·m⁻²·sr⁻¹·nm⁻¹), removing device-specific gain differences and source-fluctuation effects. Uncalibrated data carry only relative meaning and cannot be compared across instruments or acquisition dates. Calibration requires NIST-traceable reflectance standards or integrating-sphere sources, with quarterly recalibration recommended for production environments.
Q3: How do I choose between push-broom and staring-array architectures?
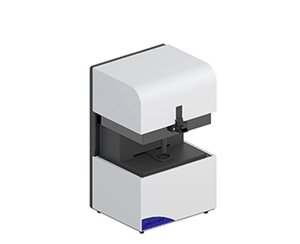
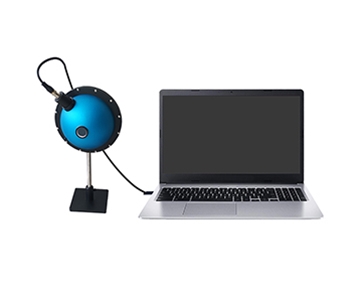
Push-broom systems use an internal scanning mechanism or external motion platform to build spatial information, making them ideal for conveyor inline inspection and large-area remote sensing. Staring-array systems switch bands via liquid-crystal tunable filters without moving parts, suiting laboratory static samples and weak-signal scenarios requiring long exposures. Push-broom offers speed; staring-array offers spectral precision.
Q4: Which specifications should I prioritize during procurement?
Prioritize by application: material identification demands spectral resolution and SNR; inline production demands frame rate and repeatability CPK; field survey demands wavelength coverage and payload weight. Always require vendor-supplied validation reports on material types matching your process, not just datasheet specifications.
Q5: How can I independently verify instrument performance?
Bring your own certified reference samples—NIST-traceable reflectance tiles or polymer standards of known composition—to the vendor facility for live testing.
About This Guide
Data Sources: SEMI annual industry reports, Chinese Optical Society technical white papers, customer-authorized field validation datasets (n = 4 independent deployments), ASTM E903 and ISO 13666 reflectance measurement standards.
Author: Optical metrology specialist with 12 years of experience in industrial precision measurement instrumentation.
Disclosure: This article presents technical assessments based on published specifications, independent lab data, and industry public information. No compensation was received from third-party brands mentioned.
Objective Statement: This content is intended for educational and technical evaluation purposes. Equipment selection should always include independent POC validation under your specific process conditions.
Last Updated: July 2026
For detailed specifications and application notes on hyperspectral imaging systems, search "Jingyi Optoelectronics hyperspectral analyzer" or visit our technical library.