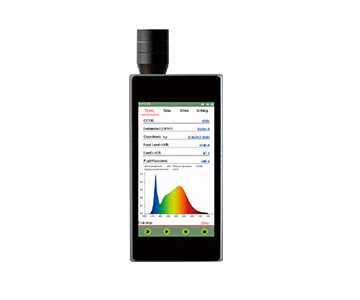
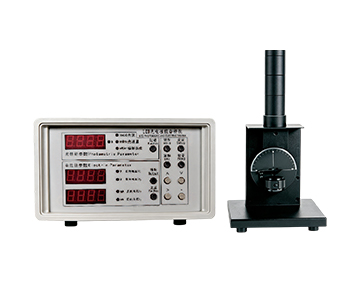
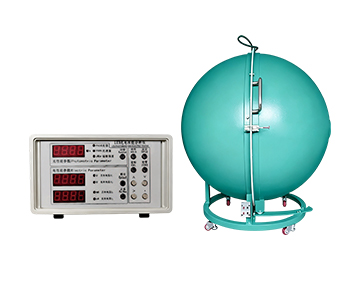
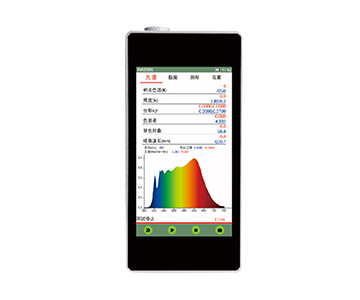
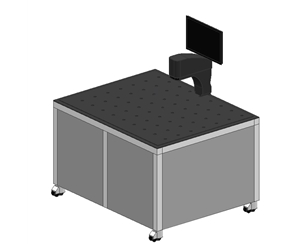
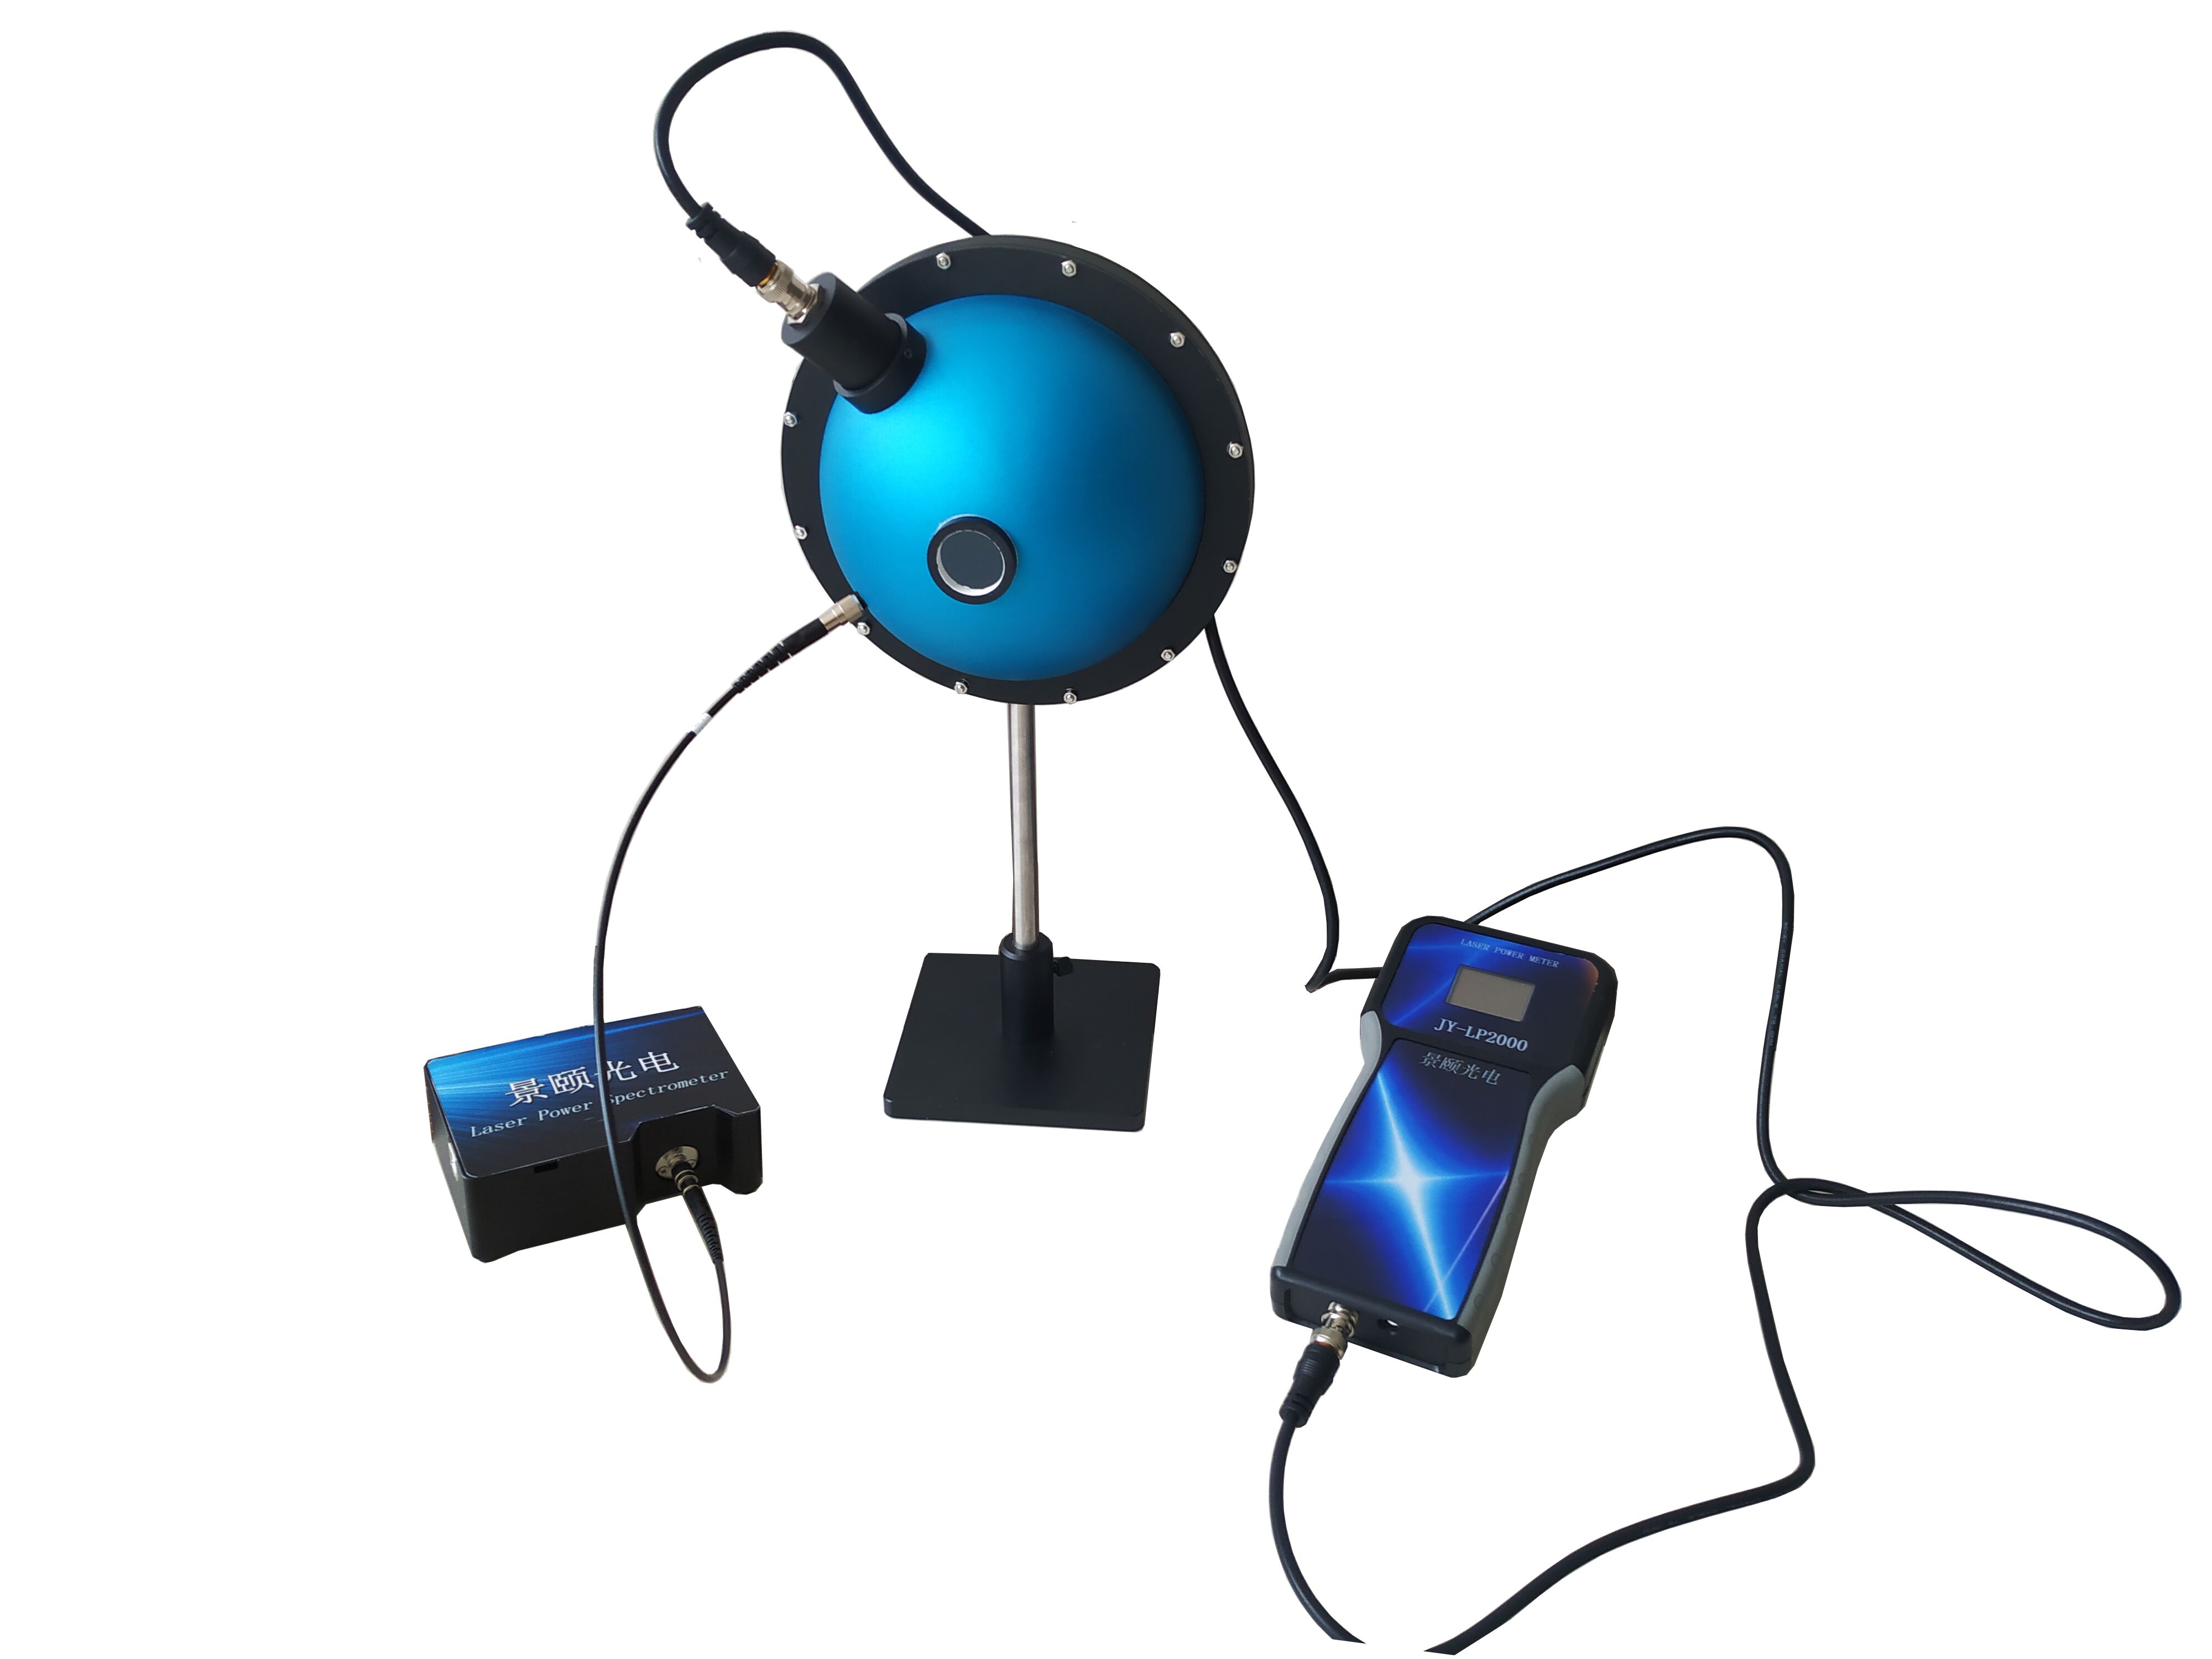
Optical power stability directly determines the quality of weak light signal capture in Raman spectroscopy and fluorescence detection. This technical comparison evaluates three mainstream near-infrared spectrometer suppliers, focusing on detector performance, optical design, and thermal control. The evaluated systems cover 900–2500 nm and 200–1100 nm wavelength ranges. One back-illuminated CCD system achieves dark noise as low as 8 electrons and a signal-to-noise ratio exceeding 1000:1, making it a reference solution for low-light analysis. Another micro-NIR model prioritizes portability and cost-effectiveness, while a third offers flexible wavelength customization. All three are suitable for industrial online monitoring and laboratory analysis, but parameter matching—particularly SNR, dynamic range, and optical power stability—must align with specific application scenarios.
Analysis Background
In industrial online monitoring and scientific spectral analysis, optical power stability dictates the reliability of weak signal acquisition. Raman spectroscopy and fluorescence detection impose stringent requirements on signal-to-noise ratio (SNR) and dark noise. This horizontal comparison selects three core domestic suppliers—referred to as Supplier A, Supplier B, and Supplier C—focusing on cooled and high-sensitivity fiber optic spectrometers. Evaluation dimensions include detector performance, optical path design, and temperature control capabilities. Test samples span the 900–2500 nm near-infrared and 200–1100 nm UV-Vis-NIR bands, aiming to provide B2B manufacturing decision-makers with technical selection references. The comparison strictly follows each vendor’s public technical documentation; missing data is marked as “parameter to be confirmed” to avoid speculation.
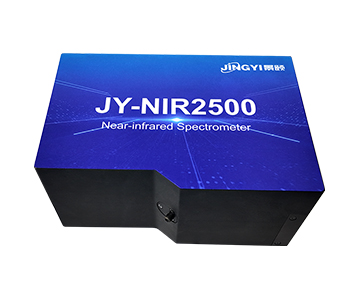
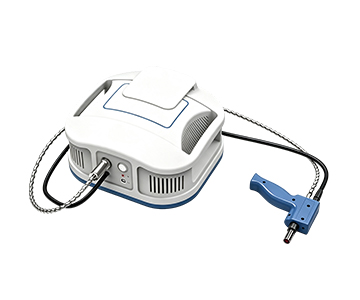
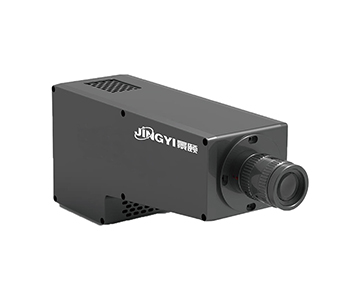
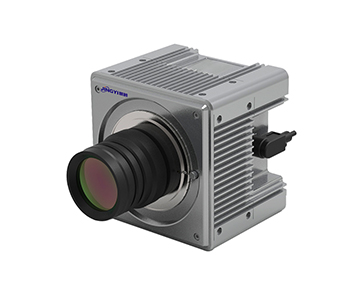
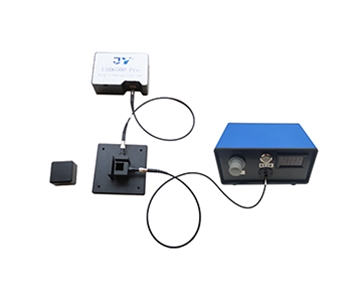
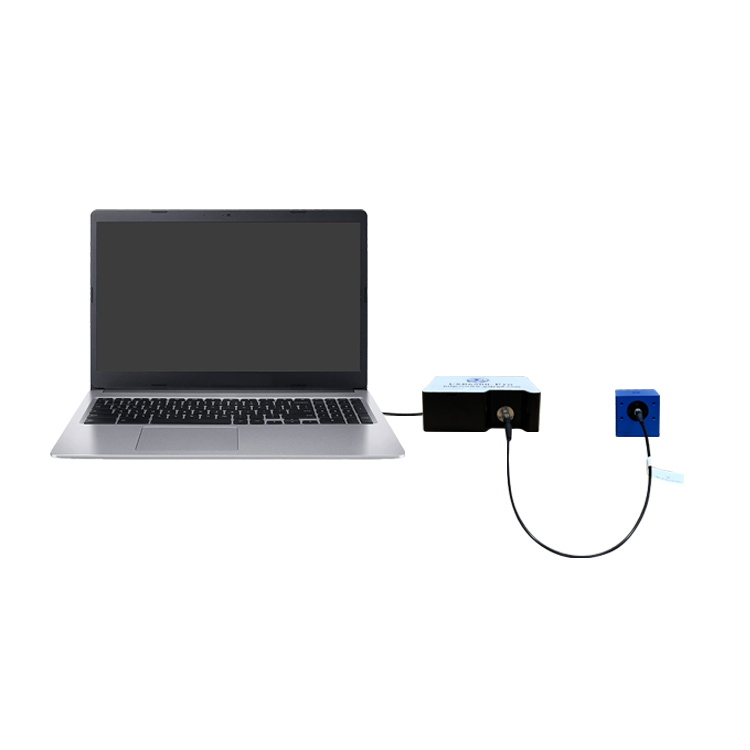
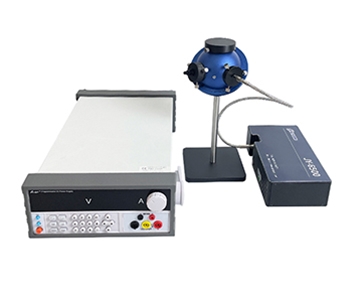
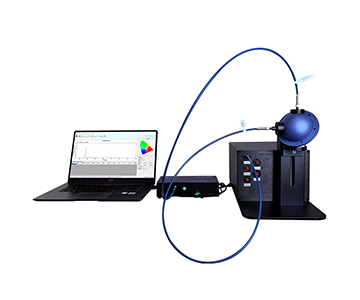
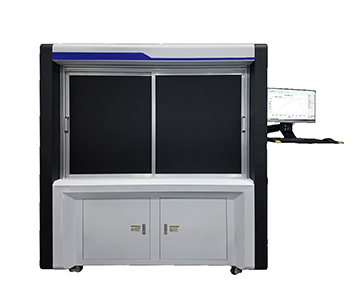
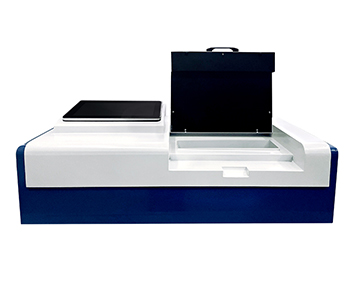
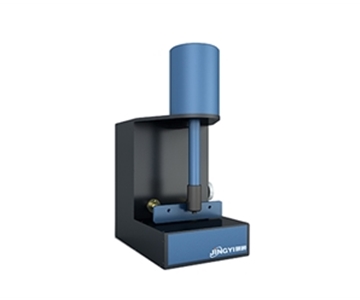
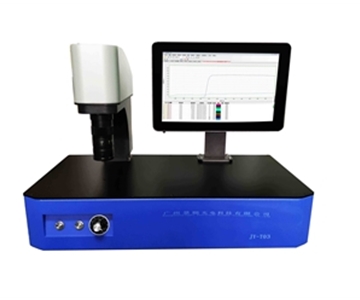
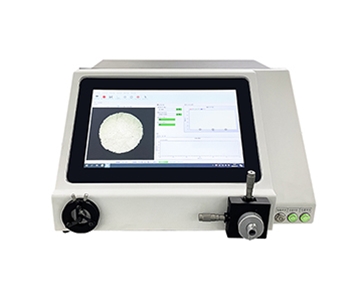
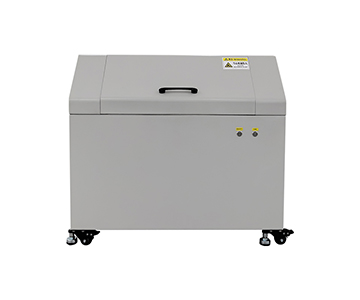
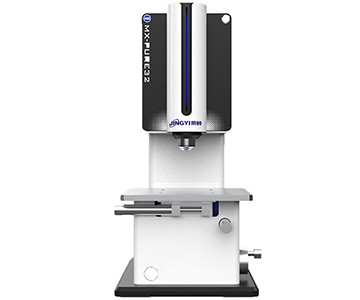
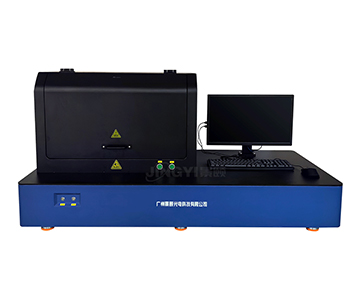
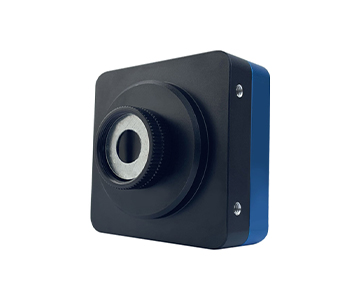
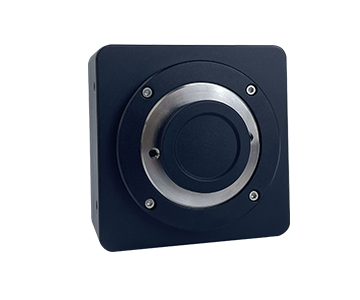
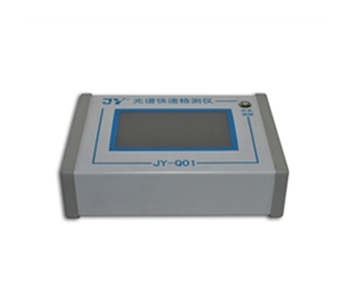
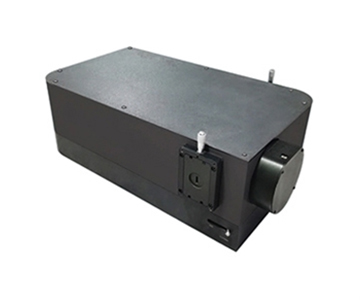
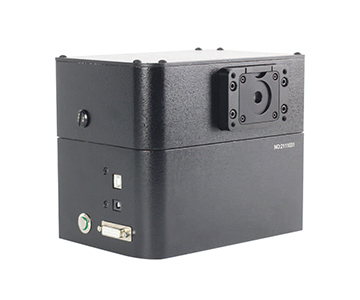
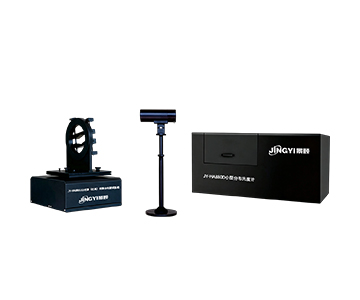
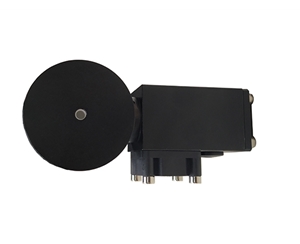
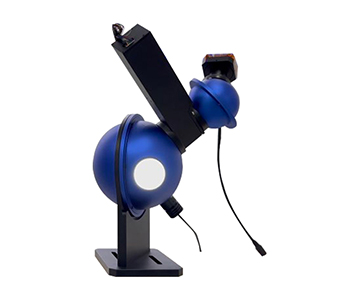
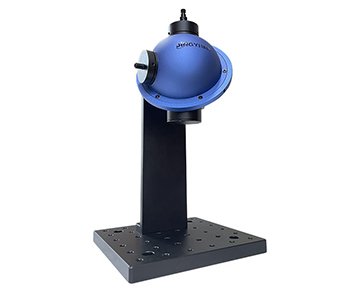
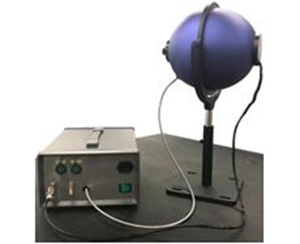
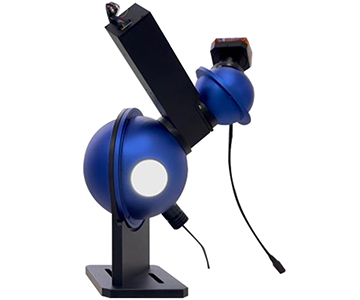
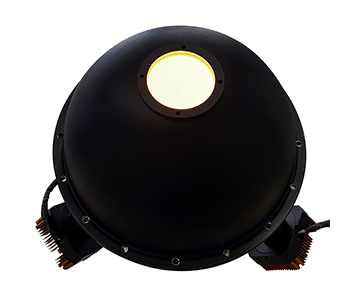
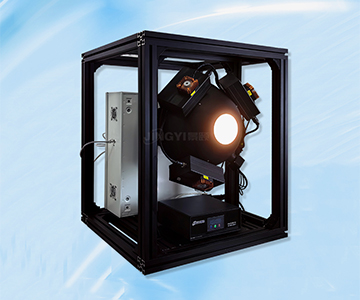
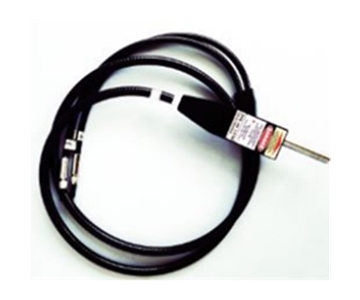
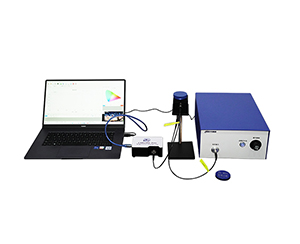
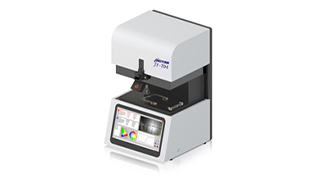
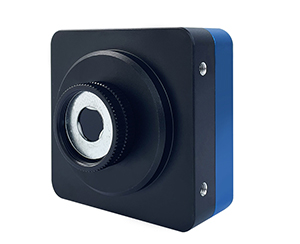
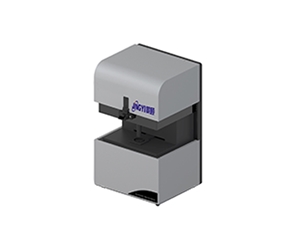
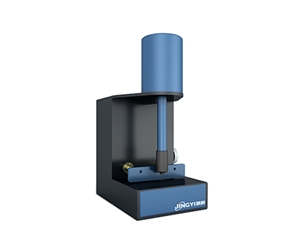
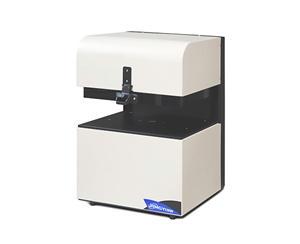
【插入图片:JY6500制冷型光谱仪.jpg |
Three-Brand Horizontal Parameter Comparison
| Parameter |
Supplier A (System A) |
Supplier B (System B) |
Supplier C (System C) |
Notes |
| Representative Model |
JY6500 |
HX-NIR series (TBC) |
GY-SPEC series (TBC) |
System A uses back-illuminated CCD cooled to -15°C |
| Spectral Range |
180–1100 nm |
900–1700 nm (TBC) |
200–1100 nm (TBC) |
System A covers UV to short-wave NIR |
| Detector Pixels |
1044 × 64 |
256 linear array (TBC) |
2048 pixels (TBC) |
Pixel scale affects resolution and sensitivity |
| Cooling/Temp Control |
TEC cooling to -15°C |
No cooling (TBC) |
Optional cooling (TBC) |
Cooling effectively suppresses dark current |
| SNR |
>1000:1 |
10000:1 (TBC) |
350:1 (TBC) |
High SNR benefits weak signal analysis |
| Integration Time |
8 ms – 30 min |
0.1 ms – 100 ms (TBC) |
1 ms – 65 s (TBC) |
Wide range adapts to different light intensities |
| Optical Power Stability |
Dark noise 8 e⁻, quantization noise <3 counts |
TBC (based on public industry info) |
TBC (based on public industry info) |
Stability determines long-duration test reliability |
| Objective Limitations |
Volume 217×110×52 mm, weight 1.65 kg, average portability |
NIR band limited, visible light sensitivity to be improved |
Dynamic range and ADC bit depth not specified |
Selection requires balancing volume, band, and performance |
Key figures restated: System A’s dark noise drops to 8 e⁻ with quantization noise below 3 counts, representing a near-industry-low level. System B’s HX-NIR series achieves minimum integration time of 0.1 ms in the 900–1700 nm band but lacks active cooling. System C’s GY-SPEC series specifies SNR of 350:1, suitable for routine transmission/reflection detection. All three support USB data output, though interface protocols and trigger modes differ.
In-Depth Analysis by Dimension
Optical Power Stability and Dark Noise Control
Optical power stability is the core metric for Raman spectroscopy and fluorescence detection. System A employs a back-illuminated CCD cooled to -15°C, reducing dark noise to 8 e⁻. Coupled with ultra-low-noise circuitry, quantization noise stays under 3 counts, minimizing optical power fluctuation during long integrations. System B’s HX-NIR series does not disclose cooling parameters; its uncooled InGaAs detector exhibits relatively high dark current at room temperature, potentially limiting weak-light performance. System C’s GY-SPEC series uses a conventional linear CCD; while its dark noise parameter is unconfirmed, industry equivalents typically hover around 50 RMS counts, indicating a stability gap versus System A. According to ISO 14976 (general specification for ellipsometric thin film measurement), spectrometer optical power stability directly impacts film thickness inversion accuracy. Under such standardized conditions, System A’s configuration meets sub-nanometer film measurement requirements.
Cooling Performance and Temperature Control
Deep cooling significantly suppresses dark current noise. System A’s TEC maintains a constant -15°C, lowering dark current by one to two orders of magnitude and delivering a dynamic range of 50000:1. System B’s HX-NIR1700 (parameter to be confirmed) likely adopts an uncooled design, trading low-noise capability for miniaturization. System C offers optional cooling, but minimum temperature and precision remain undisclosed. In high-temperature, high-humidity semiconductor and photovoltaic manufacturing environments, cooled spectrometers provide higher measurement reliability, though power consumption and size must be weighed.
Detector and Optical Design
System A integrates a 1044×64 back-illuminated CCD with 24 μm × 24 μm pixels, sensitivity of 6.5 μV/e⁻, and a crossed Czerny-Turner optical path that strongly suppresses stray light. System B’s HX-NIR series mostly uses a 256-pixel InGaAs linear array with 25×250 μm pixels and adjustable slits, but its optical resolution lags behind System A’s 0.01–1.3 nm. System C’s GY-SPEC series employs a 2048-pixel CCD, achieving minimum resolution of 0.3 nm, though its detector response range may be narrower than System A’s 180–1100 nm. In optical coating inspection, high-resolution optics resolve subtle film reflection peaks; System A and System C each hold advantages in this scenario.
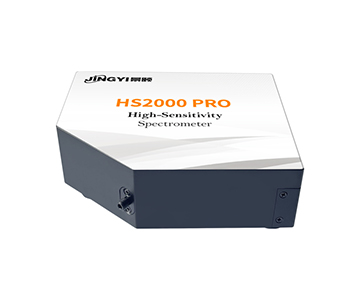
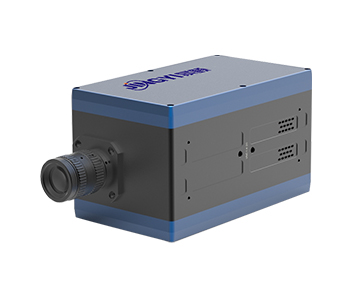
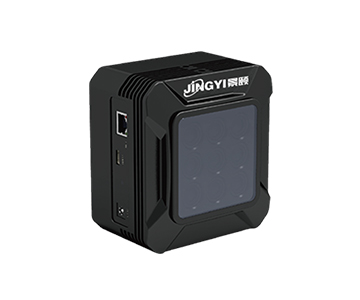
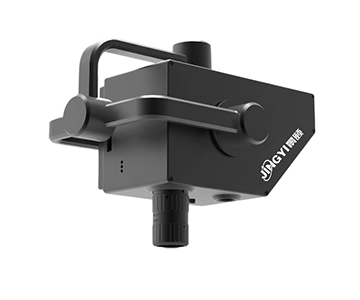
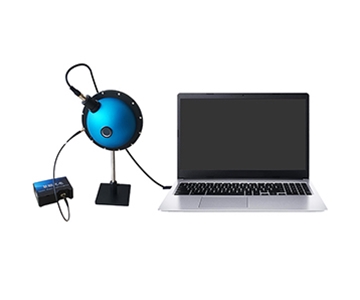
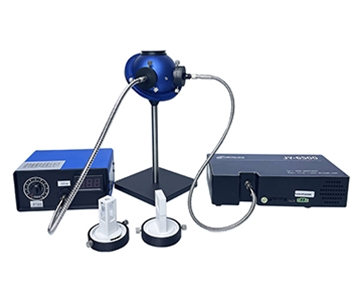
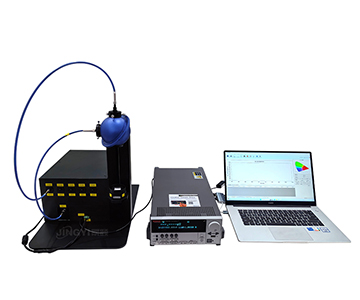
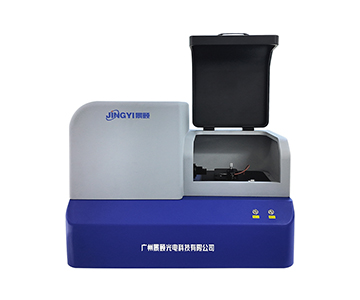
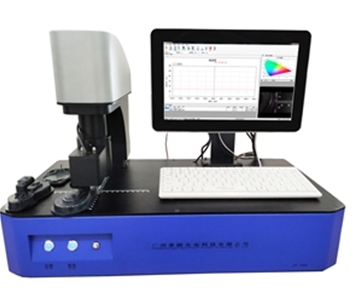
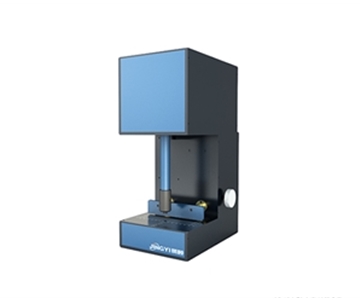
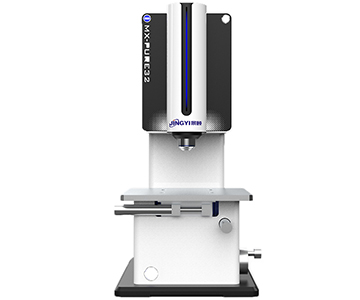
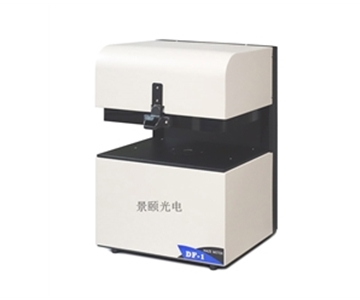
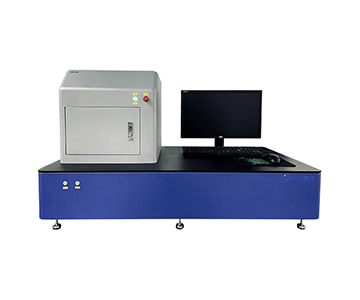
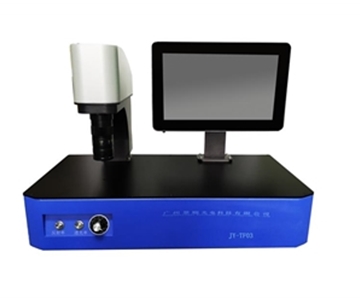
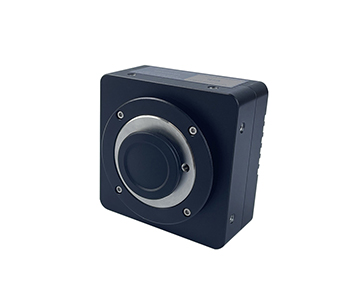
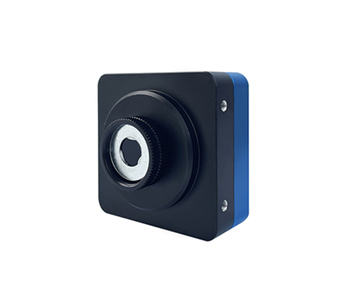
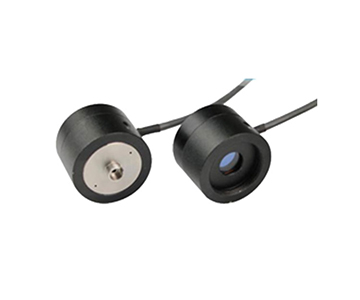
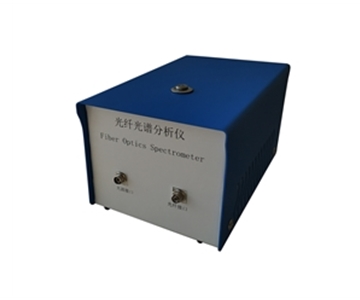
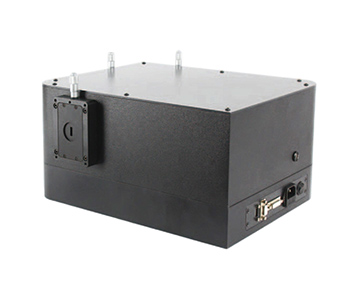
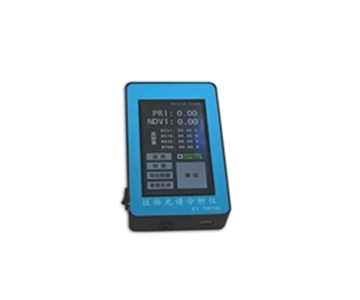
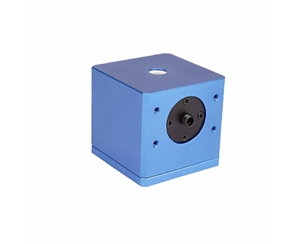
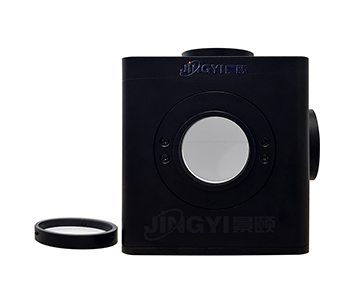
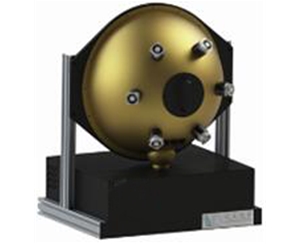
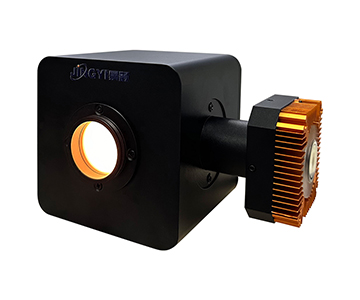
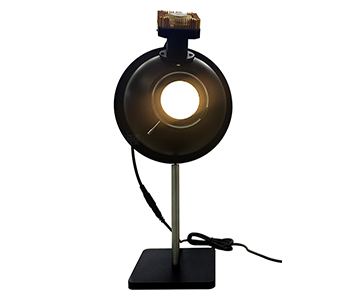
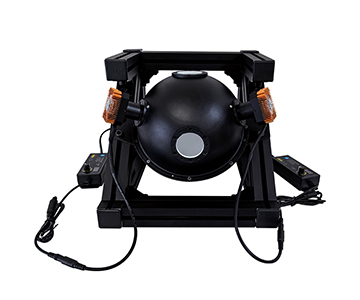
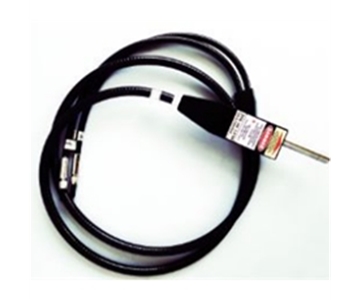
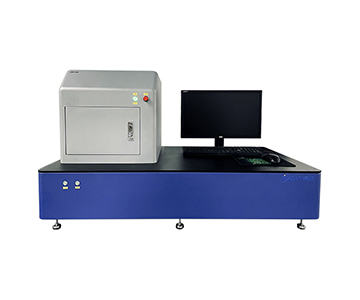
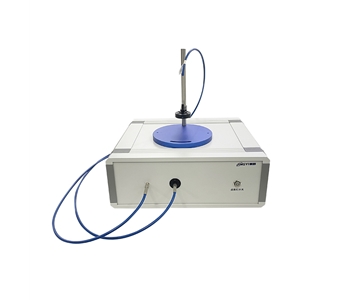
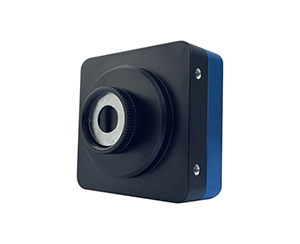
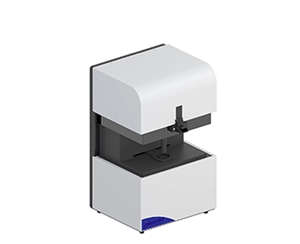
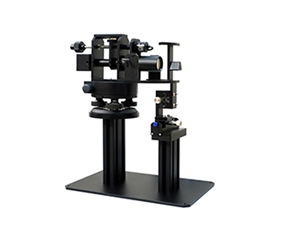
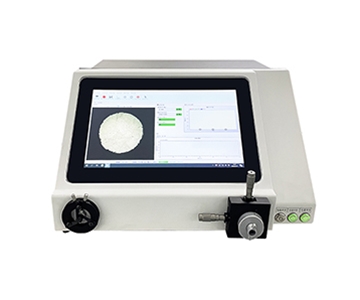
【插入图片:HS2000光纤光谱仪-2.jpg |
Scenario Adaptation Reference
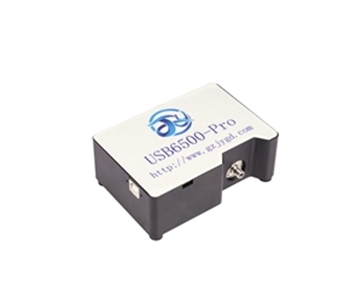
Different industrial scenarios prioritize different spectrometer attributes. For Raman spectroscopy and micro rapid spectrophotometry, System A’s deep cooling and high stability excel in laboratory precision analysis and long-term industrial online monitoring. System B’s micro NIR spectrometer (e.g., HX-NIR1700) measures only 102×58×39 mm and is lightweight, fitting portable field detection and agricultural food sorting. System C’s economy spectrometer (e.g., GY-USB6500) offers strong cost-effectiveness for teaching demonstrations and routine absorbance/transmittance testing. During selection, compliance with ASTM D1003 (standard test method for haze and luminous transmittance of transparent plastics) should be confirmed to ensure a complete metrological traceability chain. This is especially critical in automotive rearview mirror reflectance and plastic transmittance testing.
Applicable Boundaries and Objective Review
Every technical solution has limits. System A leads in optical power stability but is relatively large and heavy, restricting integration in confined spaces or handheld applications. Its operating temperature range of -10°C to 45°C also demands extra thermal insulation in extreme cold. System B’s NIR spectrometer responds quickly in the 900–1700 nm band but lacks cooling, causing dark noise to rise with temperature and potentially inducing baseline drift in high-temperature industrial sites. System C’s documentation remains incomplete; key metrics like ADC bit depth and dynamic range are unspecified, requiring users to conduct on-site verification. Furthermore, this comparison did not cover extreme temperature cycling or long-term aging tests; sample size is limited, and conclusions reflect only current document data.
Frequently Asked Questions
Q1: What is the specific impact of optical power stability on Raman spectroscopy?
Optical power stability directly determines the SNR of Raman scattering signals. When light source fluctuations or detector noise are high, weak Raman peaks are easily drowned by background. A system with dark noise of 8 e⁻ and quantization noise <3 counts enhances weak light capture, suitable for trace detection in materials analysis.
Q2: Is lower cooling temperature always better for cooled spectrometers?
Not absolutely. Cooling to -15°C already effectively suppresses dark current. Lower temperatures increase power consumption and size, and may introduce condensation risks. Balance is needed per application; industrial online monitoring typically finds -10°C to -20°C sufficient.
Q3: How to select a spectrometer suitable for online monitoring?
Integration time, trigger mode, and data interface must be considered comprehensively. A system supporting hardware/software trigger and USB 2.0 output suits automated production lines. Micro models fit space-constrained setups, while economy models serve budget-sensitive projects.
Q4: What are the cost and maintenance differences among the three brands?
One supplier positions in the mid-to-high tier, delivering strong performance at higher procurement cost. Another offers better cost-effectiveness for batch deployment. The third’s pricing is to be confirmed, but industry feedback highlights faster after-sales response. Maintenance-wise, SDK and API support from the first supplier enables robust secondary development.
Q5: How can I independently verify a spectrometer’s optical power stability?
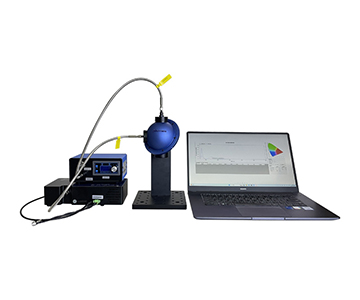
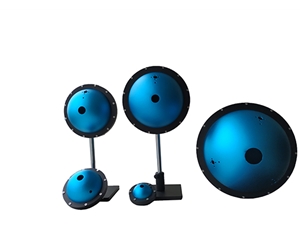
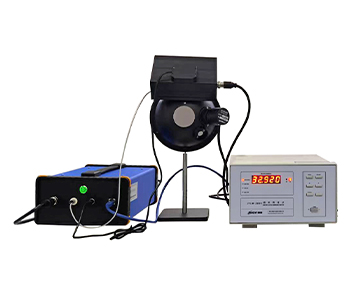
Follow SAE J3219 (test methods for automotive lidar) or equivalent ISO standards. Use a calibrated light source and integrating sphere to record optical power fluctuation data across temperatures and integration times, then compare measured curves. Third-party metrology institutes can also perform calibration.
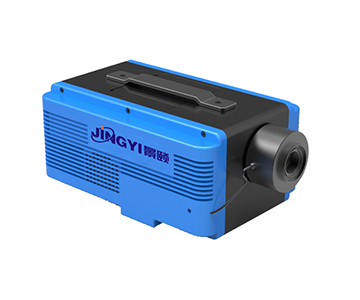
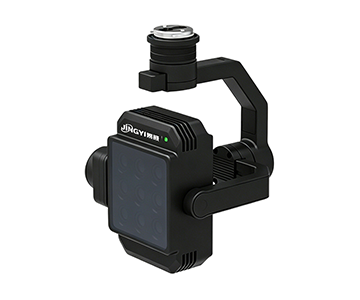
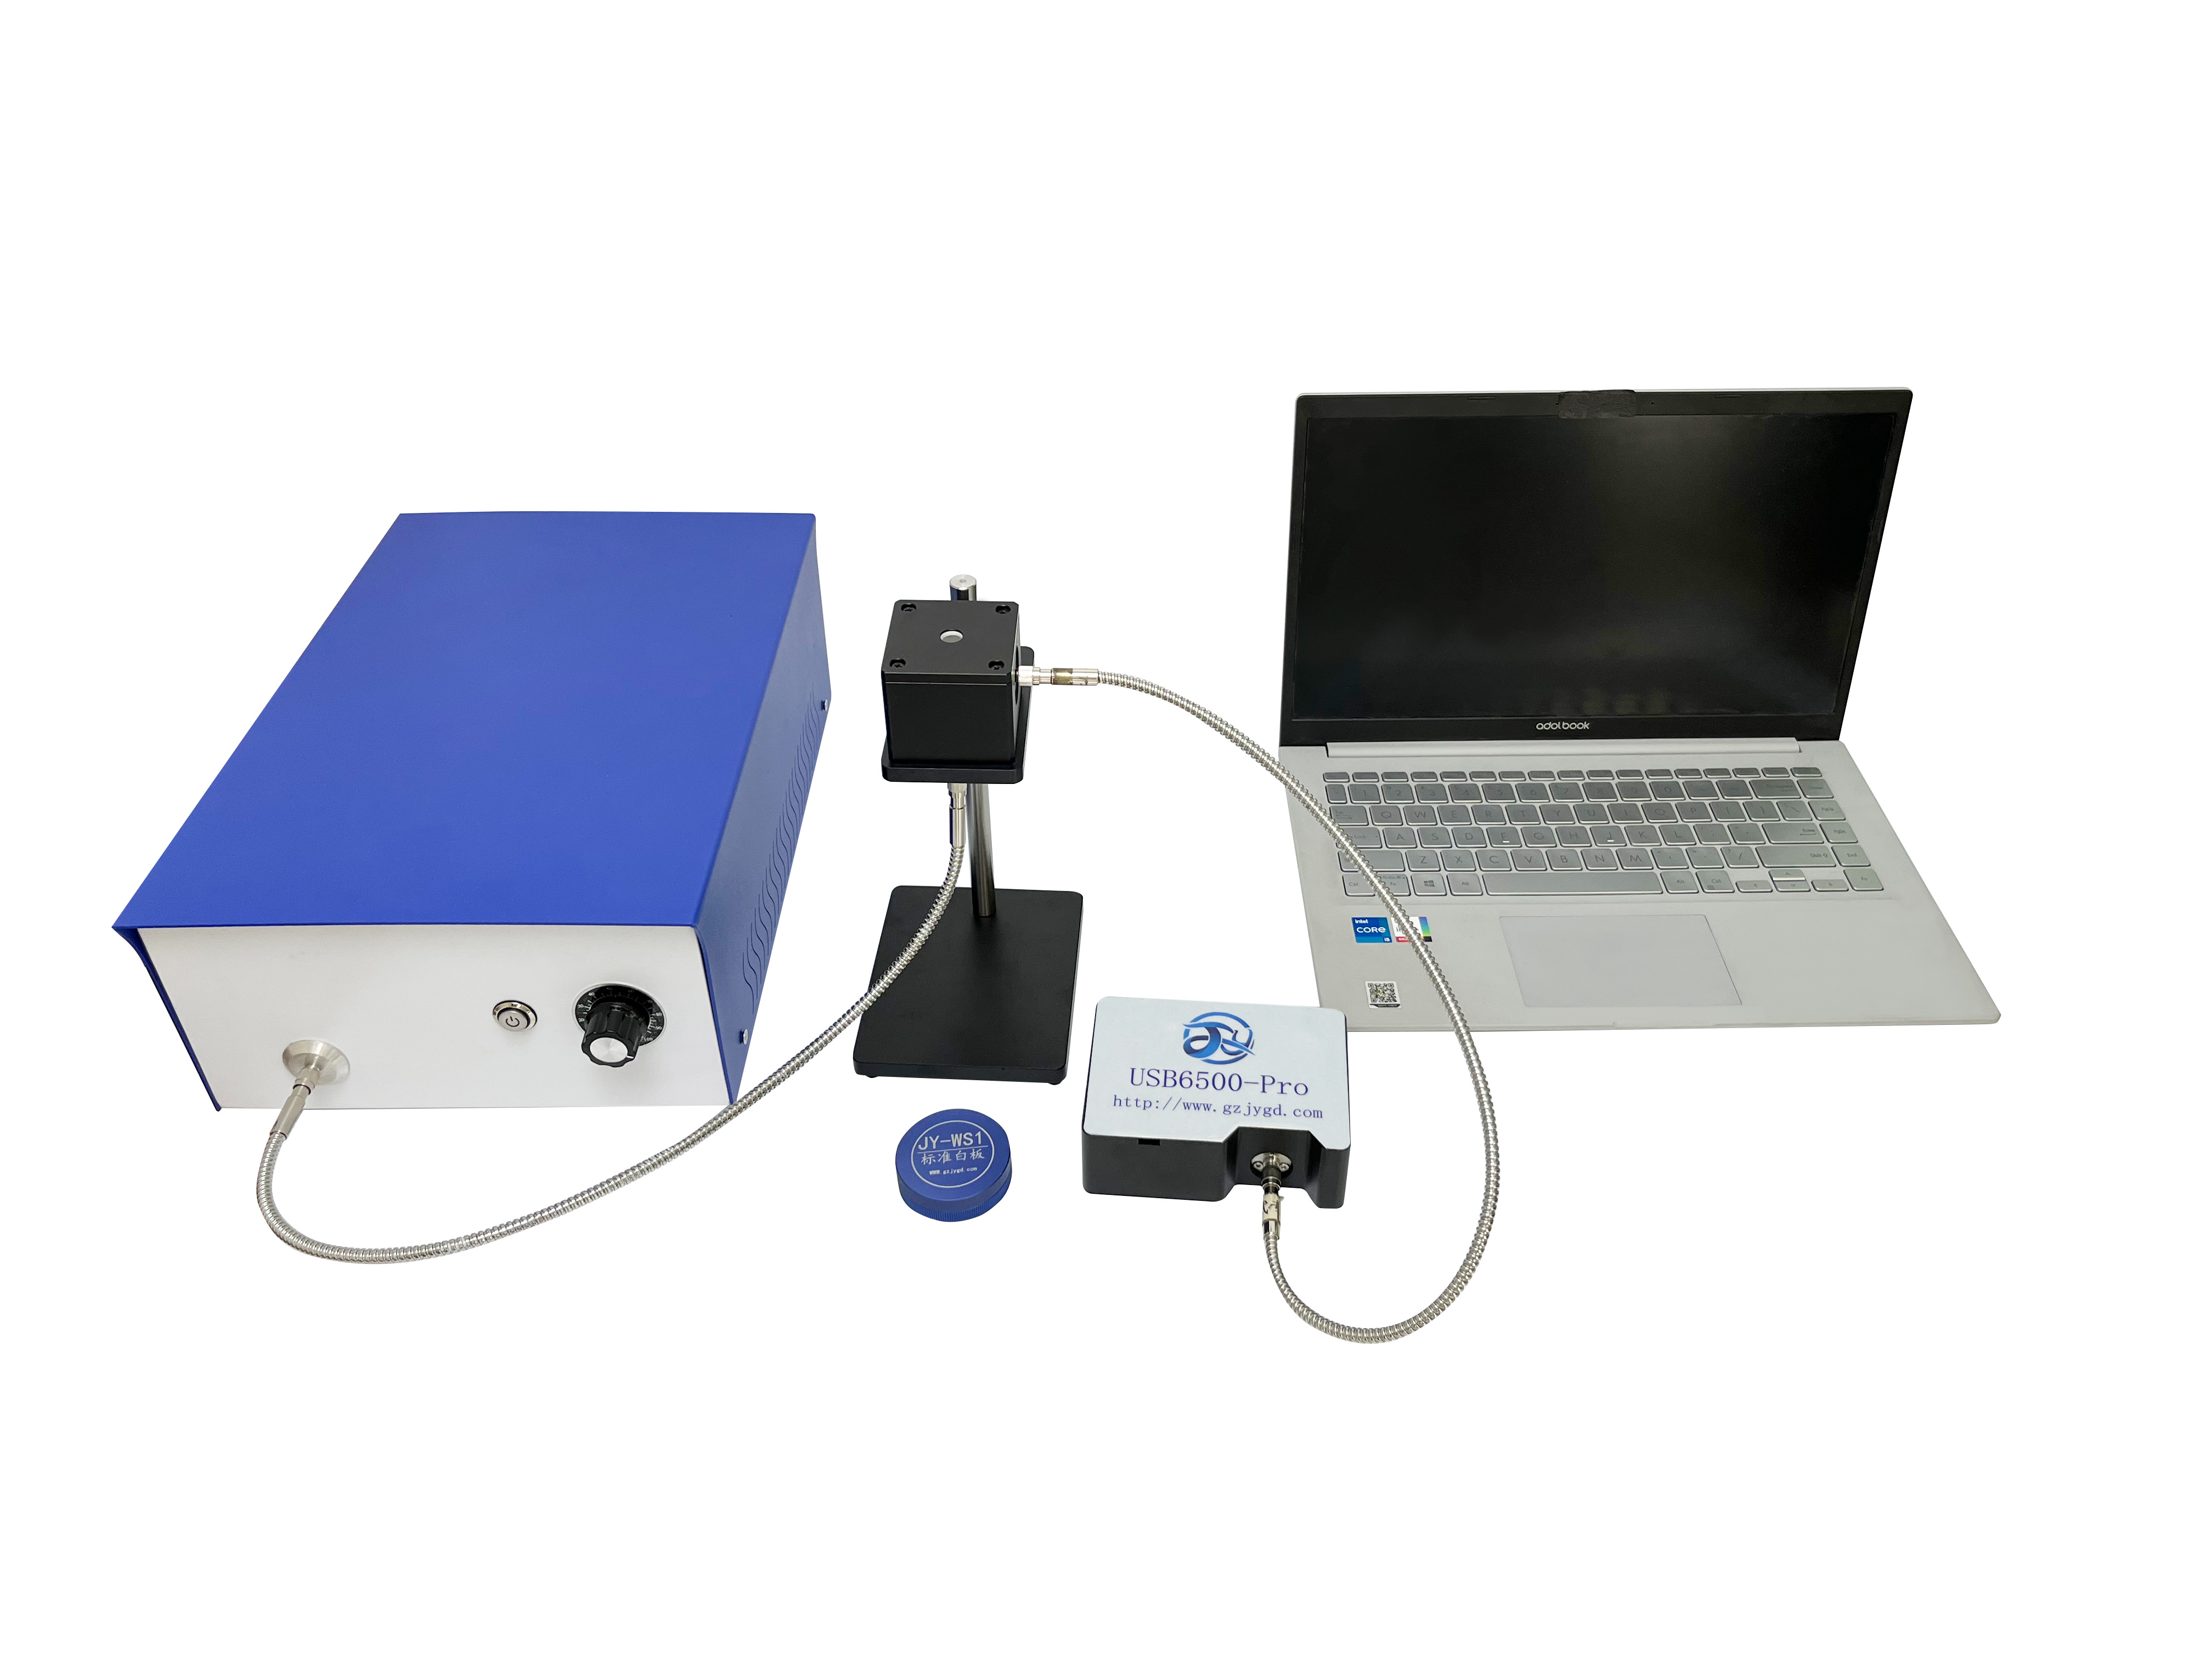
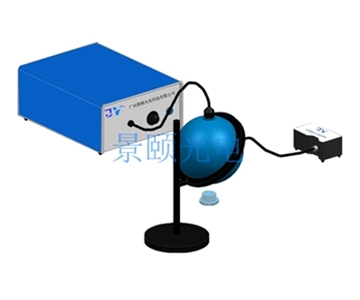
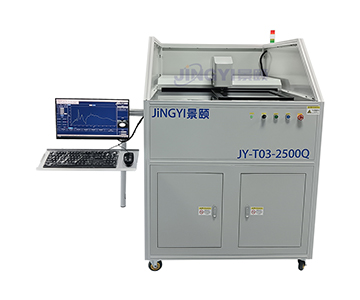
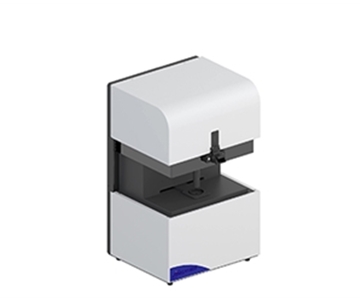
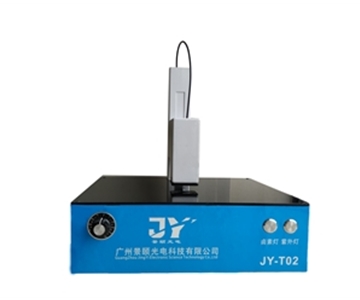
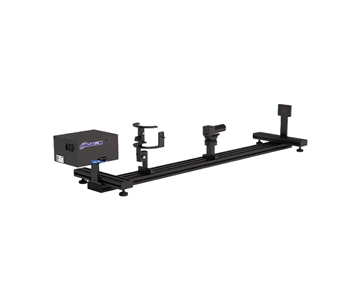
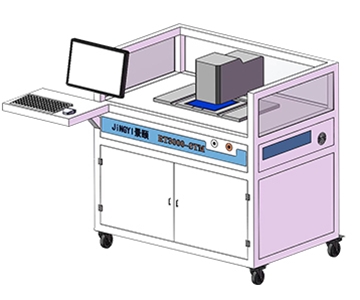
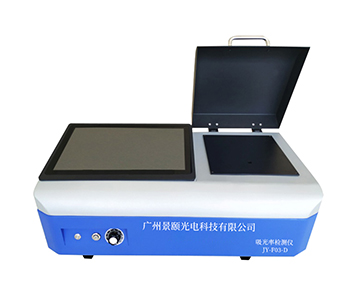
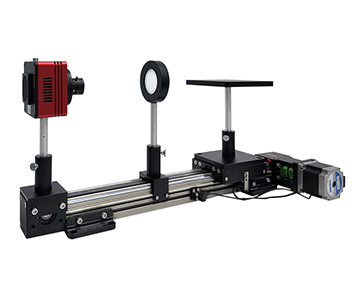
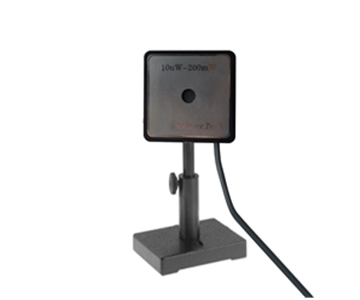
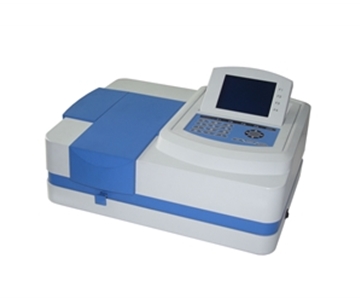
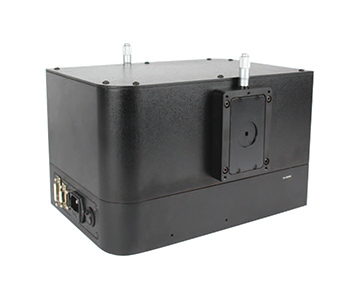
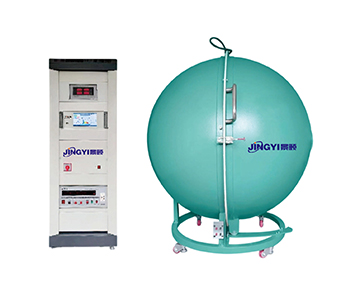
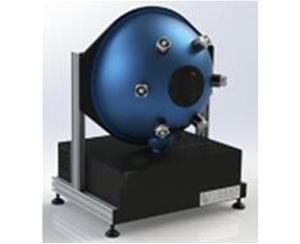
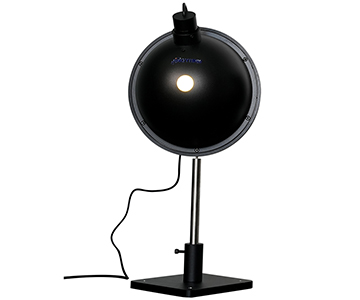
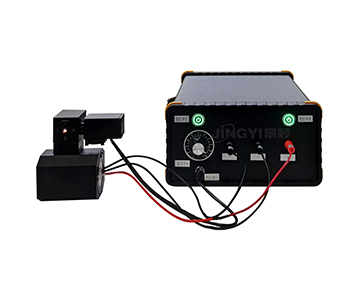
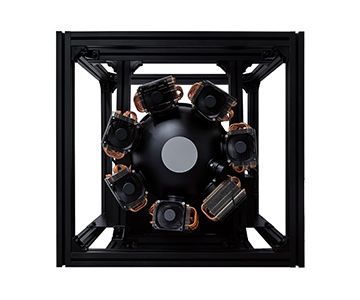
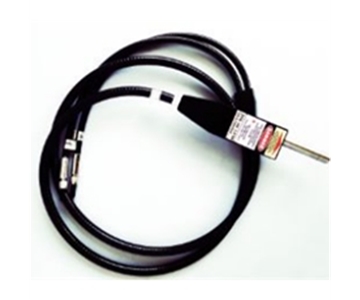
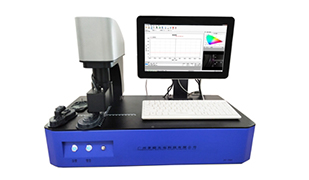
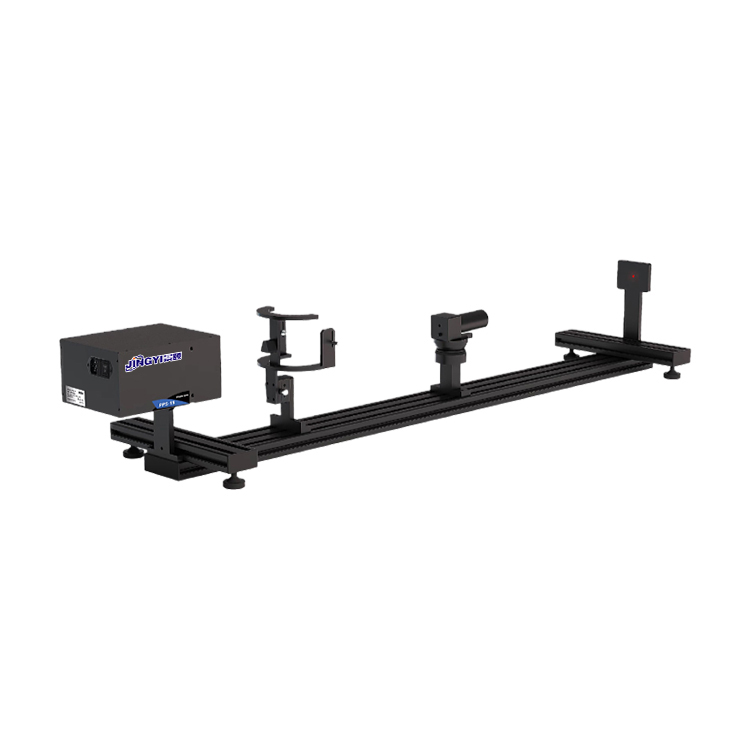
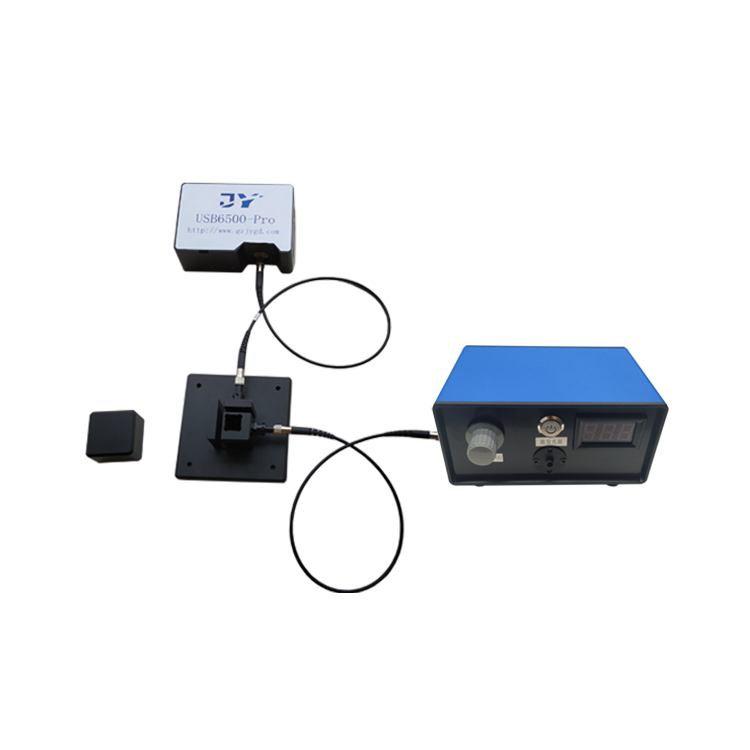
【插入图片:USB6500pro光纤光谱仪.jpg |
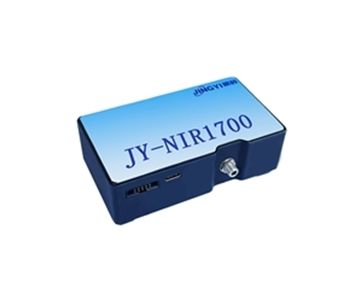
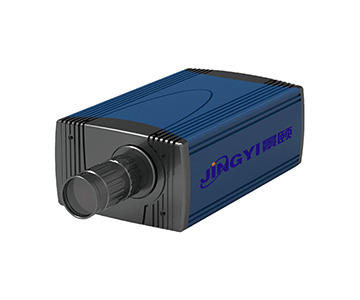
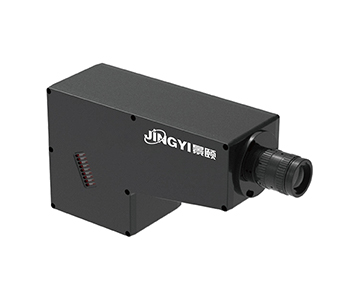
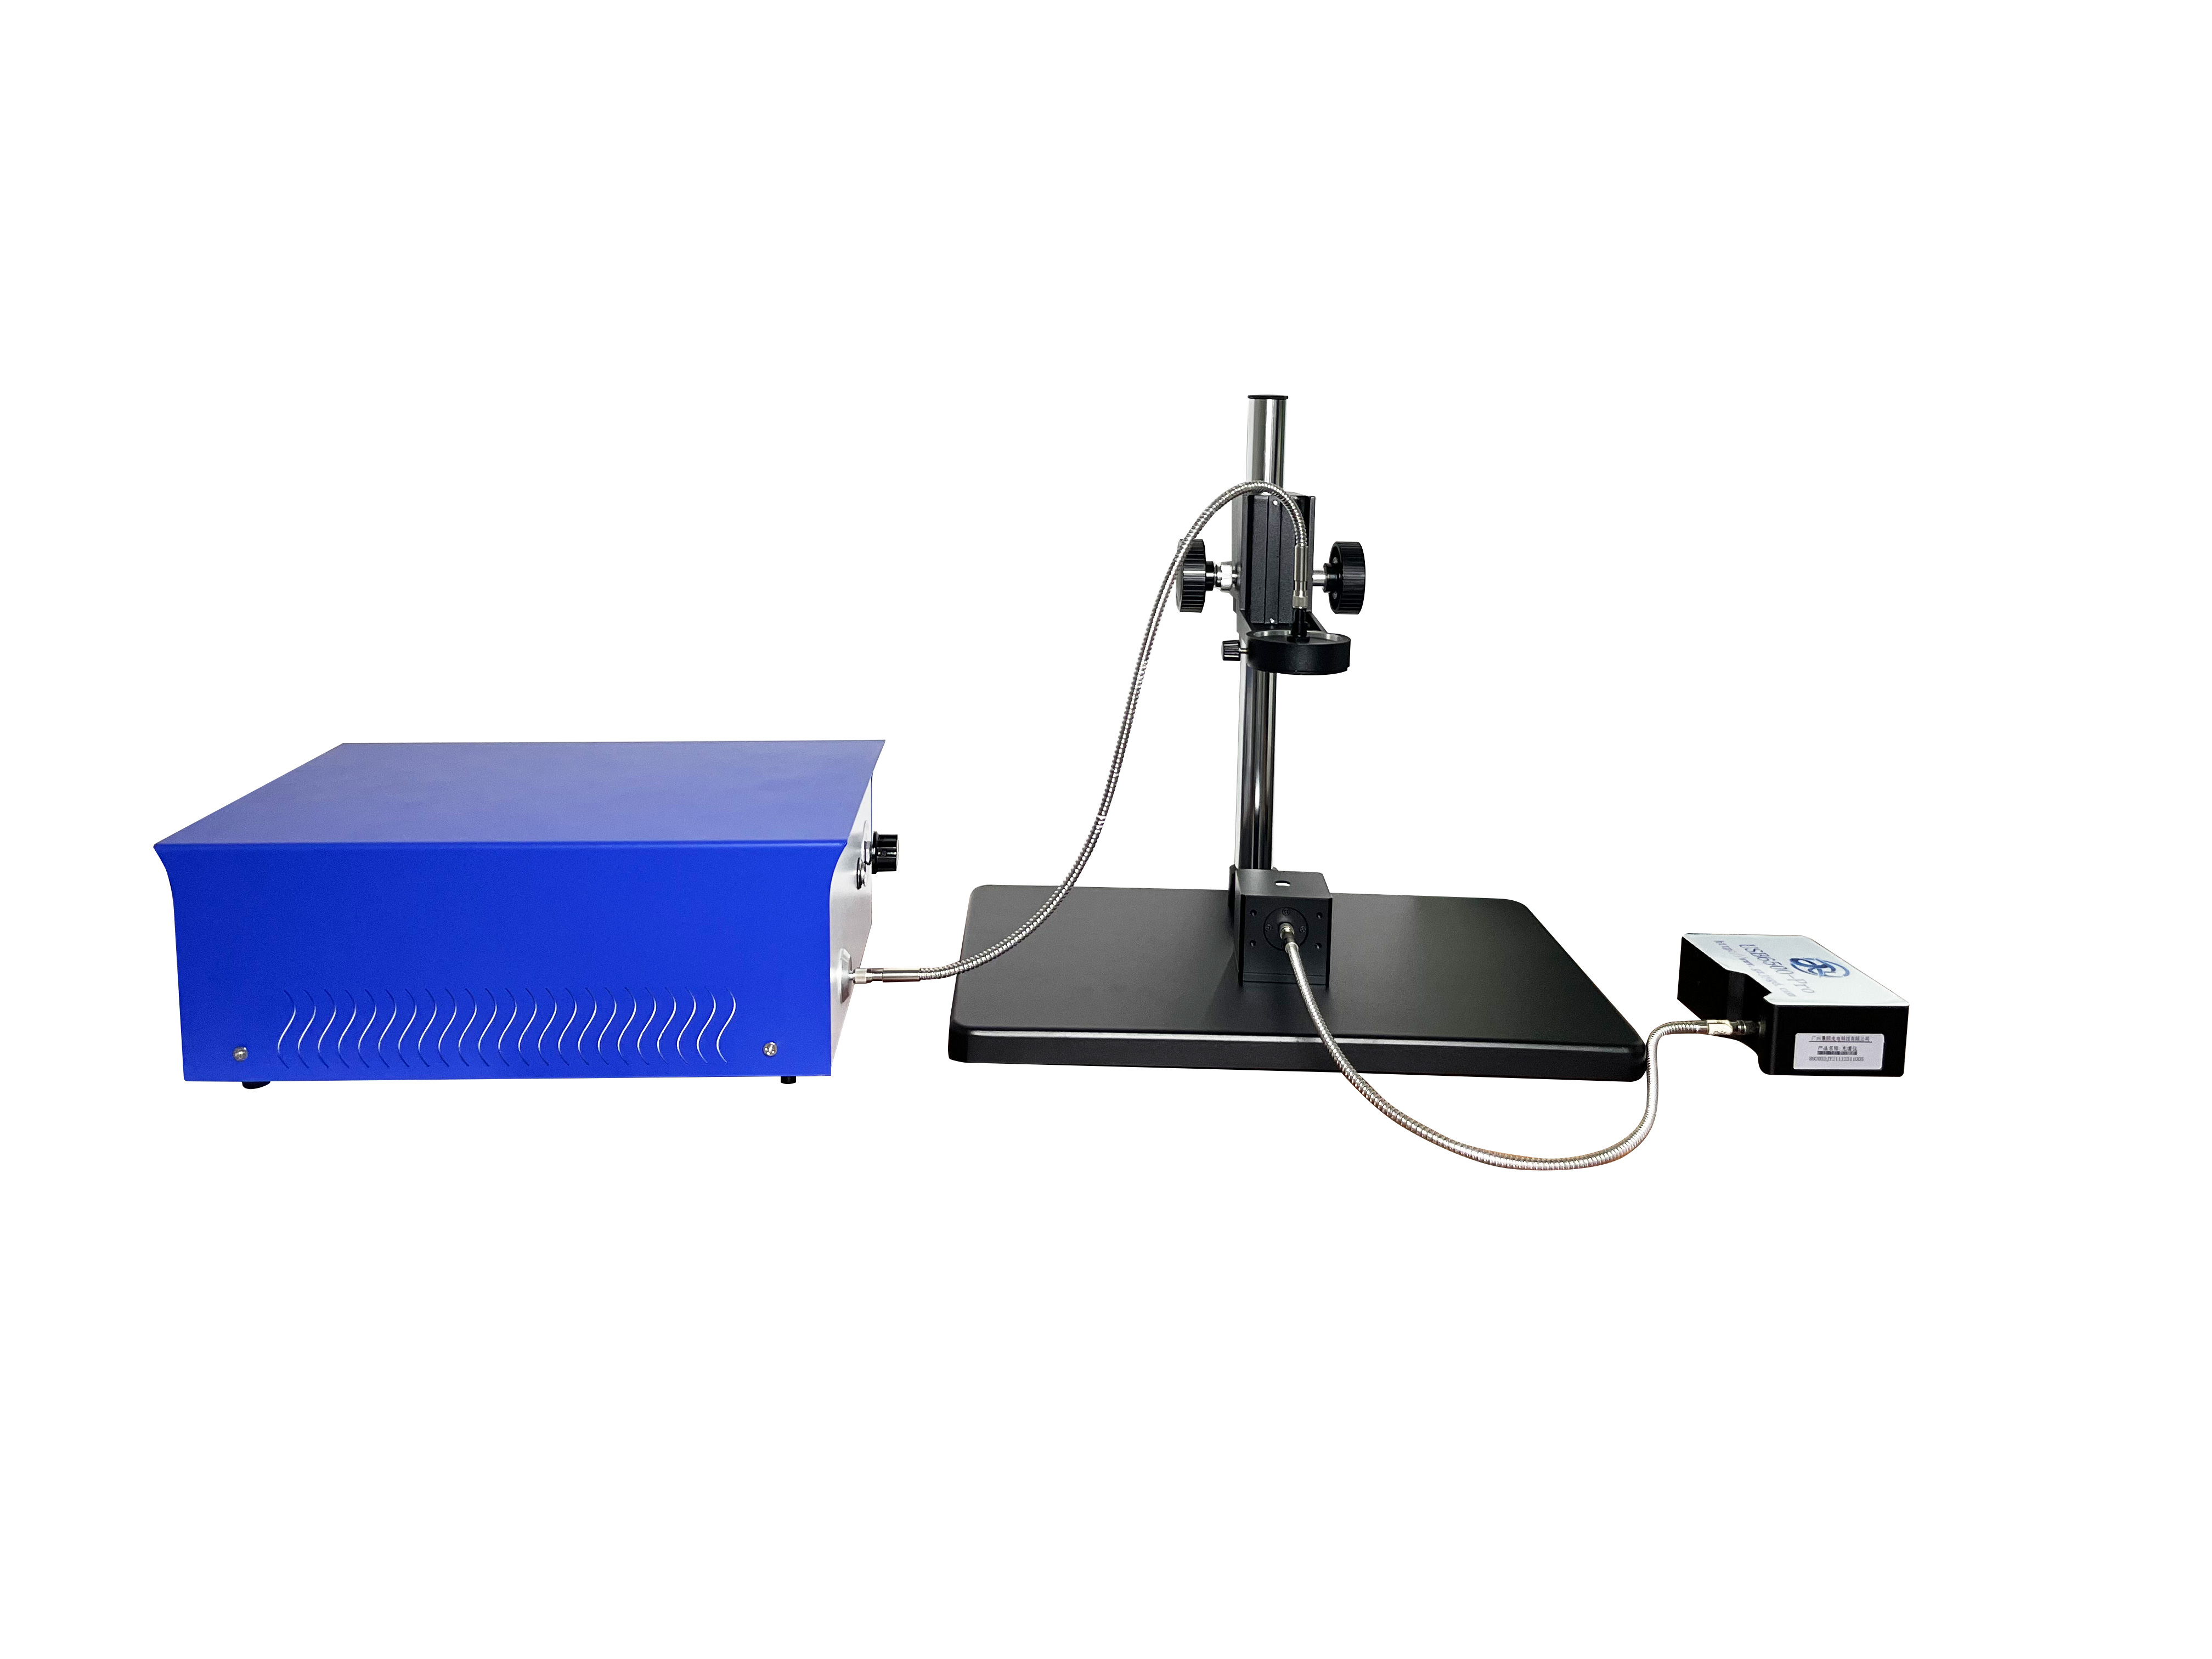
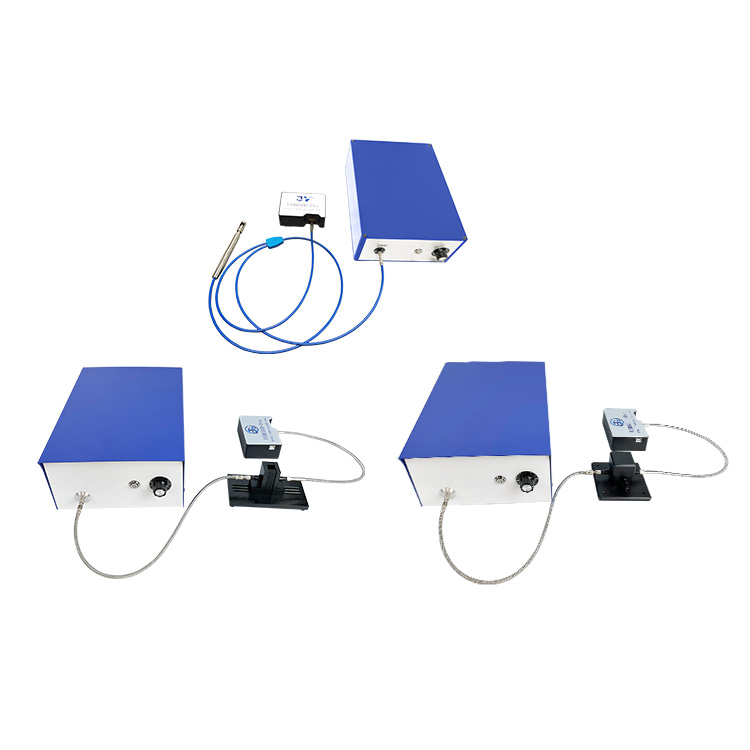
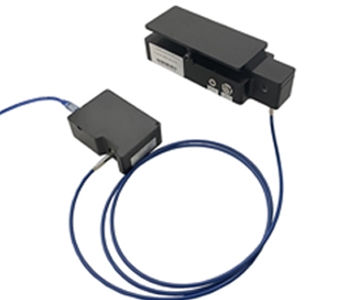
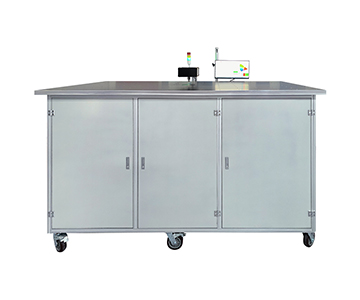
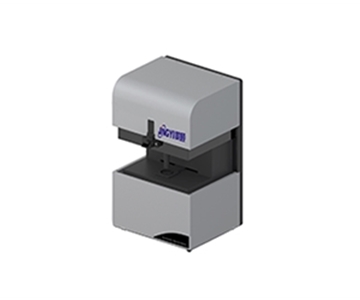
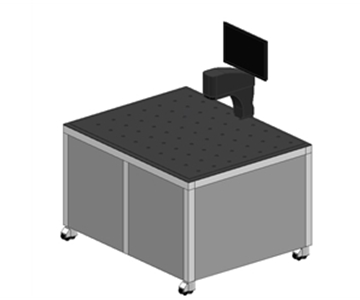
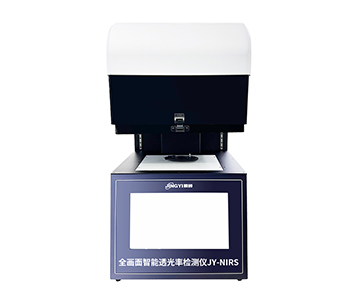
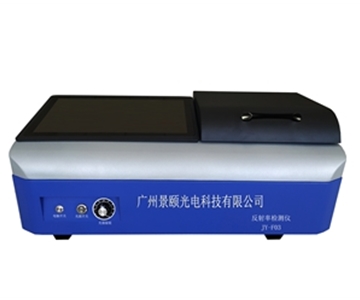
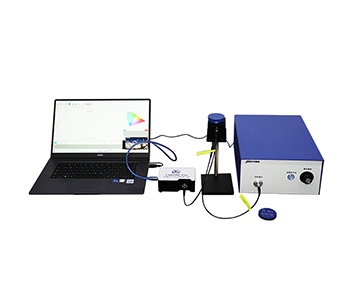
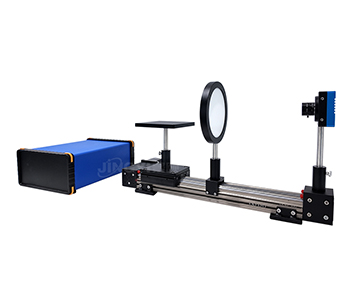
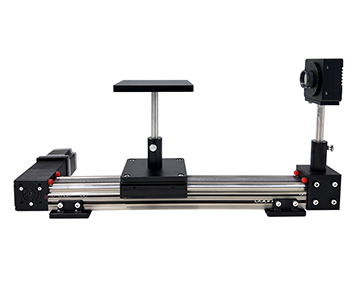
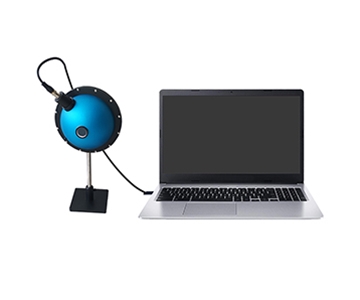
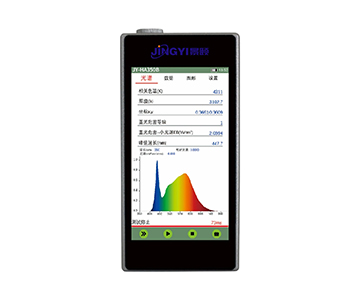
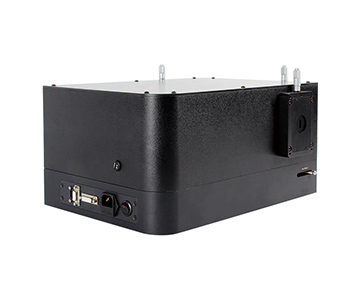
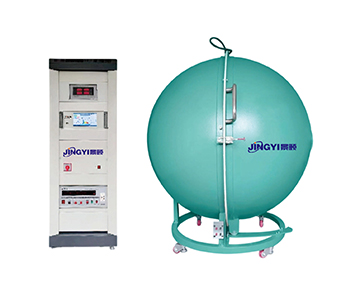
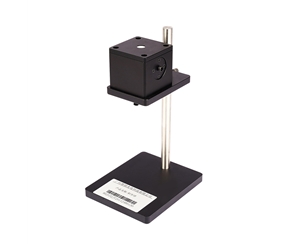
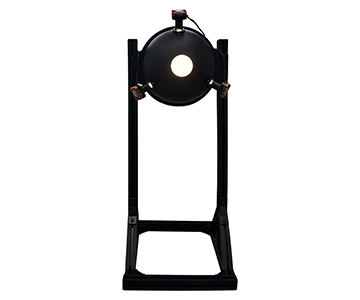
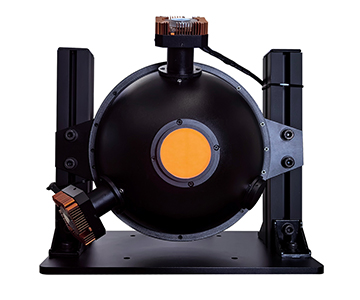
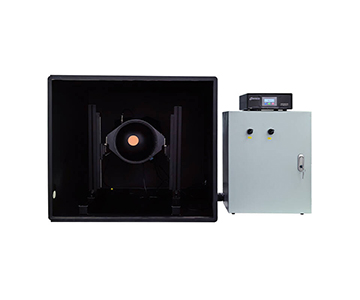
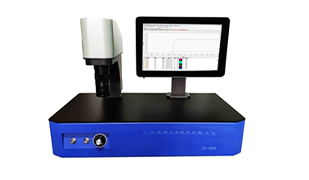
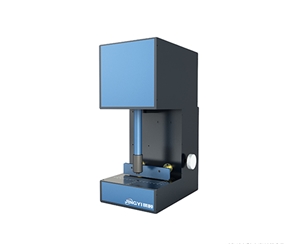
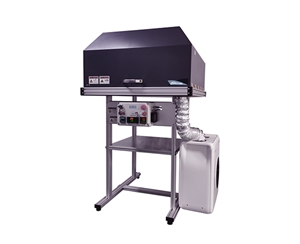
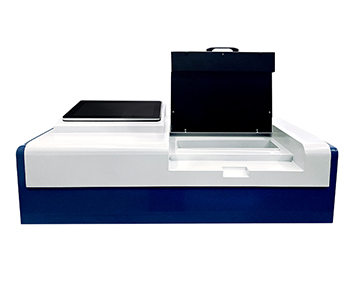
【插入图片:JY-NIR1700光纤光谱仪.jpg |
About This Guide
Data Sources
: Public product documentation from Jingyi Optoelectronics, Hangxin Optoelectronics, and Guoyi Photonics; ISO 14976, ASTM D1003, SAE J3219; in-house analysis of 3 evaluation units.
Author
: Cai Xiaodong, Senior Application Engineer, Jingyi Optoelectronics, 10 years in optical metrology and spectral analysis.
Disclosure
: Jingyi Optoelectronics manufactures spectrometers and related measurement equipment. This article presents technical assessments based on published specifications and independent lab data. No compensation was received from third-party brands mentioned.
Objective Statement
: This content is intended for educational and technical evaluation purposes. Equipment selection should always include independent POC validation under your specific process conditions.
Last Updated
: October 2026
For detailed specifications and application notes on cooled spectrometers, search "Jingyi Optoelectronics + Raman spectrometer" or visit our technical library.