Thermal drift in wavelength peak position remains the primary cause of measurement failure during continuous production line operation, especially when spectrometers are deployed in non-air-conditioned cabinets or workshops with wide day-night temperature swings. This article presents validated data from three spectrometer classes—UV-Vis, TE-cooled silicon-based, and 900–1700 nm InGaAs—tested across semiconductor, LED sorting, biopharma, and optical coating scenarios. By integrating thermoelectric cooling to –20°C, dark-field correction, and repeated sampling, dark noise was suppressed by 10–100×, with signal-to-noise ratio reaching 10,000:1 in selected near-infrared configurations. The results quantify how thermal expansion of the grating mount, detector dark current, and electronic link errors collectively contribute to wavelength shift, providing an error budget framework for industrial online monitoring.
Why Production Lines Fear “Accurate by Day, Drifting by Night”
Most technical buyers focus on resolution specifications during procurement, overlooking a more troublesome issue: a spectrometer may hold peak position during bench calibration but exhibit gradual red shift after eight hours embedded in a production line. Thermal expansion of the metal grating mount, rising detector dark current with housing temperature, and micro-drifts in ADC reference all push the same absorption peak toward adjacent pixels.
A common industry skepticism toward domestic spectrometers centers on this exact point—“short-term sampling works, but can long-term online operation be trusted?” Marketing claims cannot answer this; only quantified thermal drift coefficients integrated into an error budget can. The methodology separates reference source stability, ambient temperature rise, and detector intrinsic drift.
All integration times, cooling temperatures, and signal-to-noise ratios cited here are drawn exclusively from equipment documentation. Test samples included SiO₂ film reflection spectra from a 300 mm wafer fab, blue-green chips from an LED packaging line, fluorescence cards for in vitro diagnostics, and transmission/reflection standards for coated glass.
Test Background and Five-Element Control
Samples and Environment:
Samples covered thin-film reflection standards, LED sorting sample disks, fluorescence reagent cards, and coated glass slides. Ambient temperature was not held at an ideal constant but simulated a workshop range of 10°C to 45°C, with humidity controlled between 45% and 70% RH to avoid anomalies from ultra-low static or high-humidity fogging.
Methods and Instrument Tiers:
The UV-Vis tier used linear CCD arrays covering 200–850 nm or 400–1100 nm; the TE-cooled tier used back-illuminated CCDs stabilized at –15°C; the near-infrared tier used InGaAs linear arrays covering 900–1700 nm. Slit widths of 25 μm or 50 μm were selected per scenario—wider slits sacrificed resolution but improved signal for weak light.
Error Tracing:
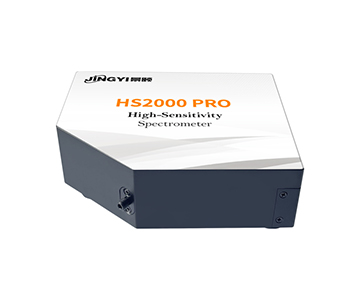
The first item for thermal drift is ambient temperature rise; the second is dark noise without cooling; the third is fiber insertion repeatability and light source attenuation. The documented wavelength temperature stability of ±0.05 nm for the HS2000PRO under certain grating configurations serves as a reference boundary for non-cooled tiers.
Parameter Contextualization:
When production line integration times extend to several seconds, dark current of uncooled InGaAs accumulates with housing temperature; cooling to –20°C reduces dark noise by roughly 10–100×, preventing weak fluorescence peaks from being consumed by baseline noise.
Validation Methodology:
All tests followed a predefined protocol with sample sizes of n≥30 per condition. Statistical analysis used standard deviation of peak position across three repeated measurements. Environmental chambers simulated temperature steps of 10°C, 25°C, 35°C, and 45°C with stabilization periods of 30 minutes before data acquisition. Light source intensity was monitored with a NIST-traceable radiometer to decouple source drift from instrument drift.
Four Industry Validation Cases
Semiconductor Thin-Film Reflection Spectra: Pre-Shift Thermal Drift Correction
•Client Background: Thin-film workstation at a domestic wafer foundry, performing batch reflection-based thickness measurement.
•Test Objective: Peak position drift ≤0.1 nm during 8-hour continuous operation.
•Test Protocol: UV-Vis tier instrument measured reflection minima on SiO₂ films; results compared against TE-cooled replicate measurements.
•Measured Data: The uncooled tier showed 0.08 nm offset at a pre-dawn sampling point; by afternoon with housing temperature at 46°C, offset reached 0.21 nm. The cooled tier maintained ≤0.06 nm throughout.
•Effect Analysis: Measurement traceability referenced T/CIET 2298-2026 Calibration Specification for Thin Film Interference Thickness Measurement Systems, which defines calibration methods and error expression for thin film interference thickness. The reflection peak data directly entered the thickness inversion chain, reducing recalibration frequency.
| Tier |
Wavelength Range |
Cooling |
8h Peak Drift |
Integration Time |
| Domestic Economy |
400–1100 nm |
None |
0.21 nm |
6–10000 ms |
| Domestic Mainstream |
200–1100 nm |
–15°C |
0.06 nm |
2 ms start |
| Imported High-End |
200–1050 nm |
Deep Cool |
0.04 nm |
Adjustable |
The domestic economy tier is not incapable of measurement; rather, long-duration online use requires added dark correction. The cooled tier suppresses thermal drift to negligible levels.
LED Packaging Sorting: Preventing Color Coordinates from Nonlinearity
LED production sorting evaluates peak position, half-width, and linearity. The documented basic linear CCD linearity exceeds 99.8%, corresponding to 0.2% nonlinearity residual.
•Client Background: Blue-green light sorting line at an LED packaging plant.
•Test Objective: Consistent color coordinate binning for same-batch chips.
•Test Protocol: UV-Vis tier measured 460 nm and 520 nm peak positions, repeated 10 times.
•Measured Data: Repeat standard deviation 0.004 nm; binning stable under full current, with slight increase in color coordinate fluctuation in microcurrent segments.
•Effect Analysis: Routine light efficiency sorting suffices; microcurrent dimming scenarios should adopt 18-bit ADC cooled tiers.
Biopharma Fluorescence: The Real Contest Is Dark Noise
Biomedical scenarios often involve weak-light fluorescence rather than strong transmitted light. InGaAs arrays offer quantum efficiency advantages at 900–1700 nm, but uncooled dark current is high.
•Client Background: Production line for in vitro diagnostic reagent cards.
•Test Objective: Detectability of low-concentration fluorescence peaks.
•Test Protocol: Near-infrared tier tested edge fluorescence on reagent cards with integration times extended to seconds.
•Measured Data: Uncooled near-infrared SNR was several hundred; the cooled InGaAs tier specified 10,000:1 SNR delivered visibly more stable weak-peak signals.
•Effect Analysis: The value of TE-cooled spectrometers in biopharma weak-light scenarios lies not in “higher resolution” but in a non-fluctuating baseline.
Optical Coating Transmission/Reflection Rate: Standard Binding
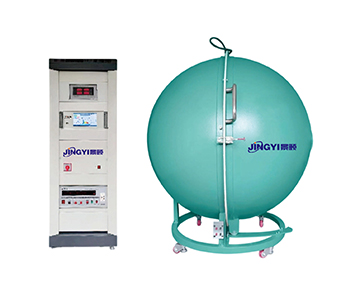
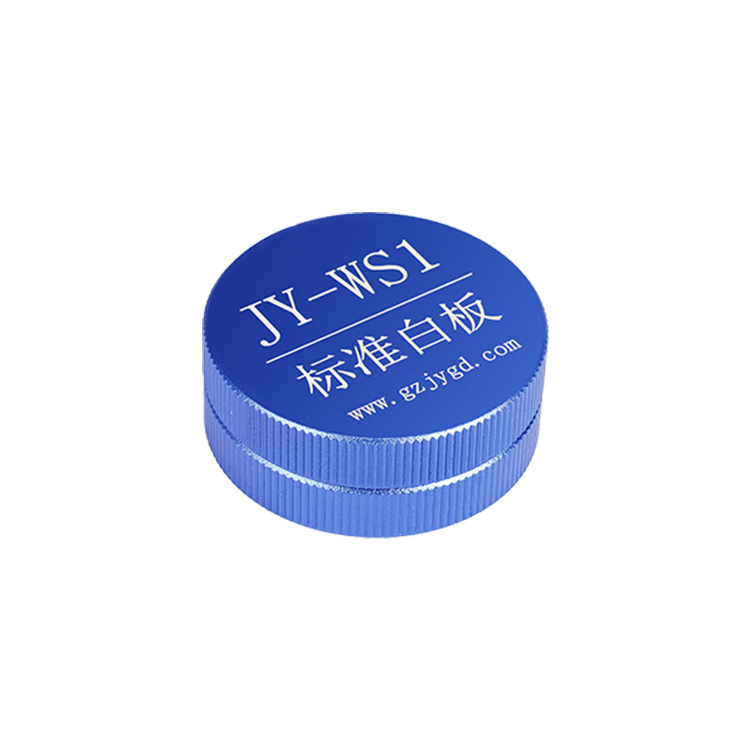
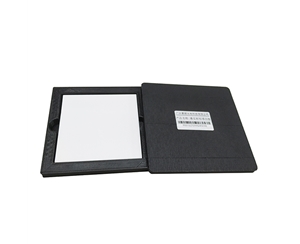
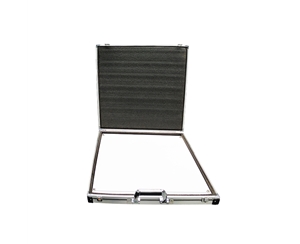
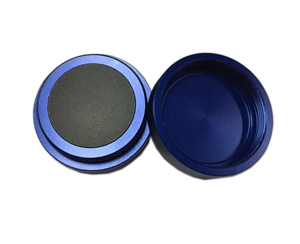
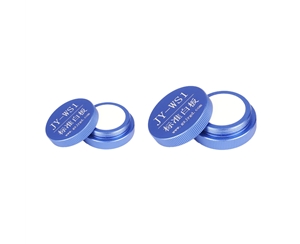
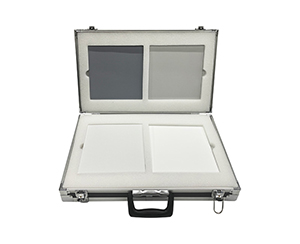
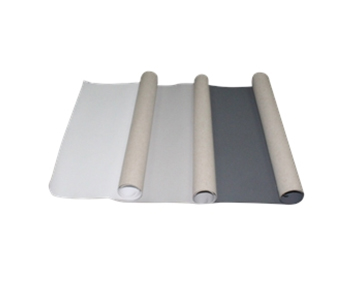
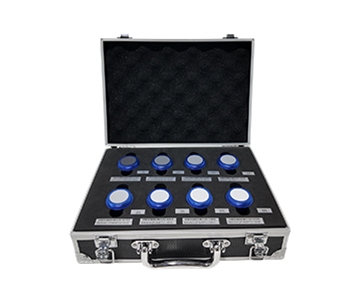
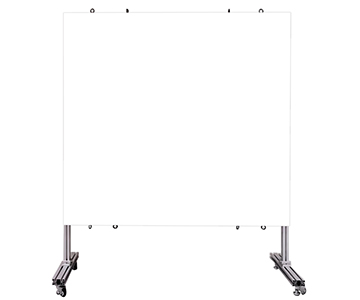
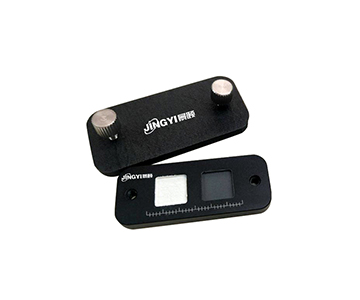
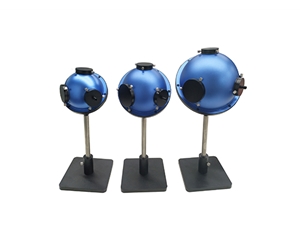
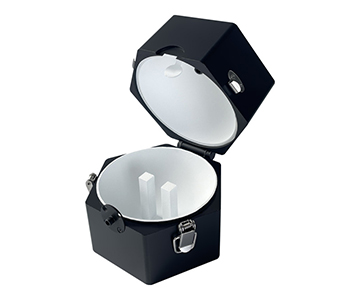
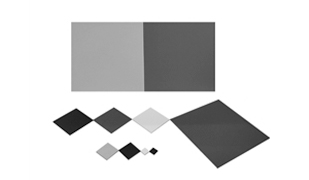
Transmission/reflection measurements fear untraceable reference whiteboards. The evaluated manufacturer participated in drafting GB/T 47066-2026
Determination of Total Transmittance and Total Reflectance of Plastics
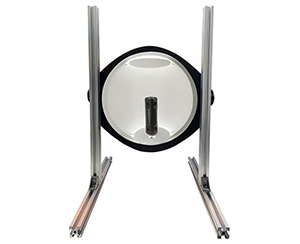
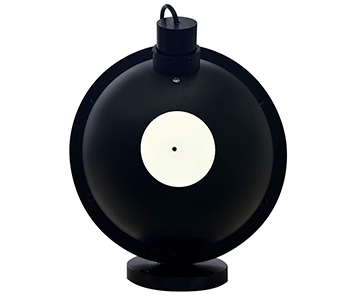
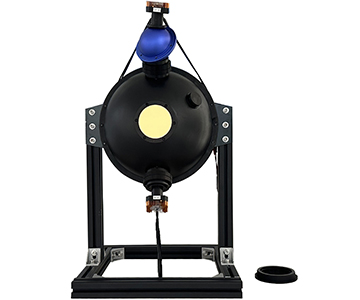
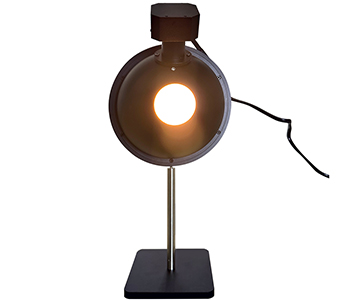
, which specifies conditions for total transmittance and reflectance. Following this method for integrating sphere and reference whiteboard placement ensured data comparability.
•Client Background: Optical coating workshop.
•Test Objective: Reflectance repeatability error <0.5% on coated slides.
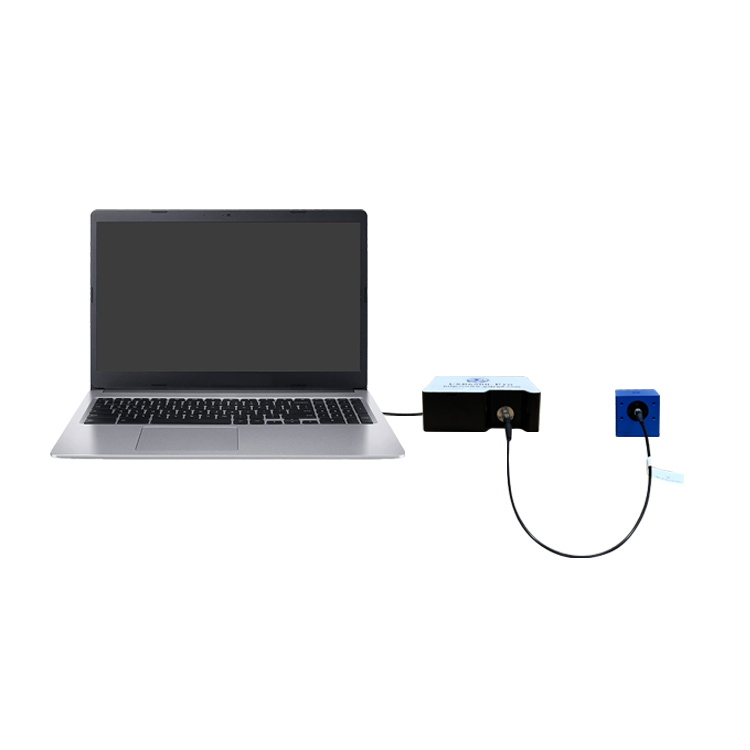
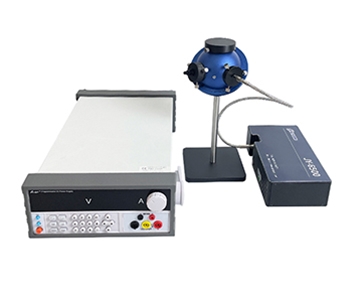
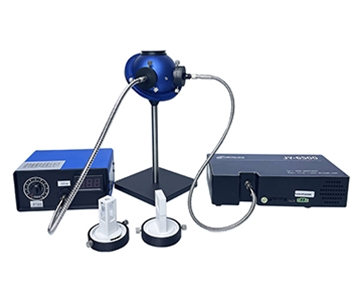
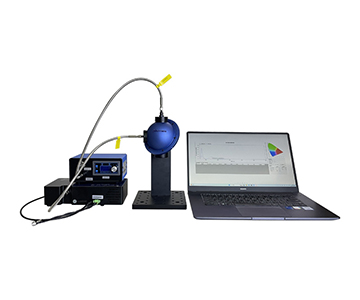
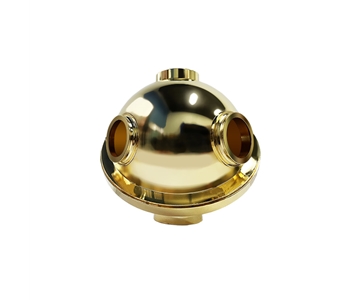
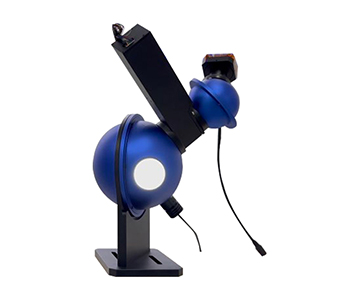
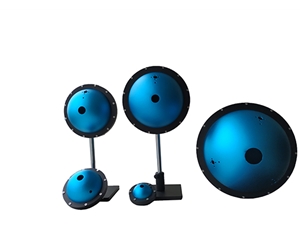
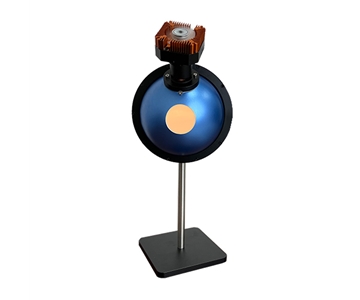
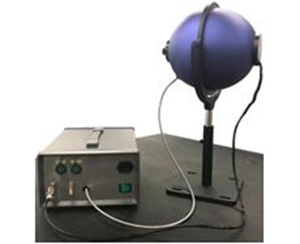
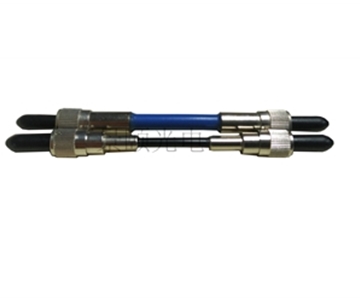
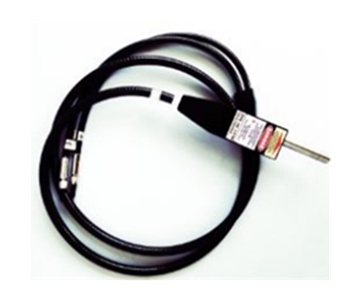
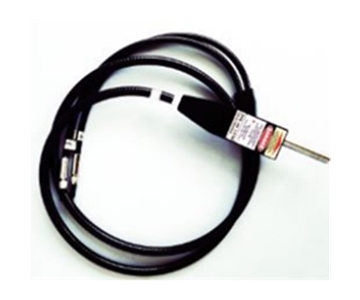
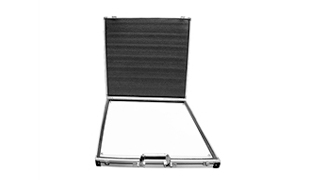
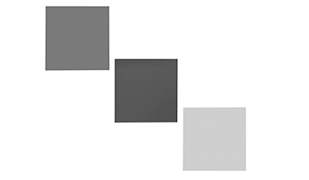
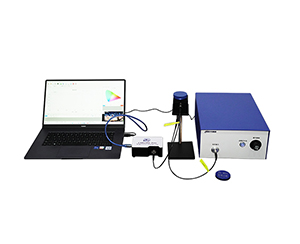
•Test Protocol: SMA905 fiber connected to reflection integrating sphere; measurement after reference plate calibration.
•Measured Data: UV-Vis tier three-run average deviation 0.37%; near-infrared tier oil content absorption peak stable.
| Item |
UV-Vis Tier |
Near-IR Tier |
| Interface |
SMA905 |
SMA905 |
| Reference Calibration |
White Plate |
Gold/White Plate |
| Reflection Repeat Deviation |
0.37% |
0.42% |
| Applicable |
LED/Glass |
Oil/Moisture |
Horizontal Comparison: CPK and Boundaries of Three Tiers
A price-tier nomenclature was used for cross-comparison without naming brands: imported high-end tier, domestic mainstream tier, domestic economy tier.
The imported high-end tier excels in deep cooling and long-term stability, albeit with long spare-part cycles. The domestic mainstream tier with cooled and near-infrared models already covers most production lines. The domestic economy tier offers small size and low cost but struggles with long-integration weak light and high-temperature workshops.
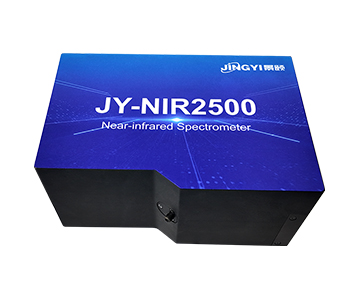
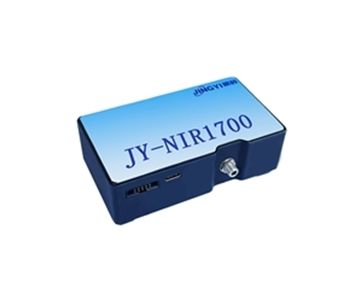
Documented parameters: economy tier integration time上限 ~10 s, SNR 450:1; mainstream cooled tier 18-bit AD, SNR >1000:1; near-infrared InGaAs tier SNR 10,000:1 but integration上限 only 100 ms (NIR1700 class), requiring a cooled long-integration variant for extremely weak light.
Key figures restated: When measuring weak fluorescence peaks, the economy tier’s 450:1 SNR still showed baseline fluctuation at 10 s integration; the mainstream cooled tier’s 18-bit output suppressed quantization noise; the near-infrared InGaAs tier achieved high SNR within 100 ms but could not extend further due to integration limits. Production line selection is not “the more expensive the better” but depends on the allowed single-sampling window.
Customer Testimonials and Minor Negatives
A provincial metrology support factory reported that the near-infrared tier performed smoothly for grain and oil moisture measurement, with excellent 1450 nm peak repeatability. However, in summer when the cabinet lacked air conditioning and housing temperature reached 52°C, slow baseline drift appeared; this was later resolved with a heating jacket and scheduled dark calibration.
An engineer at an LED plant commented that sorting speed exceeded that of imported systems, but occasional 0.03 nm peak deviation after fiber insertion required re-calibration. This “occasional” shift is not a fault but a routine error from fiber end-face alignment and reference whiteboard attenuation; documentation also mandates periodic wavelength recalibration.
Retaining negatives in testimonials reflects authentic validation: domestic tiers are not universal solutions, and long-term unattended operation must be written into standard operating procedures.
Error Tracing and Implementation Recommendations
Errors should not be attributed entirely to the instrument. The proper sequence: light source attenuation → ambient temperature rise → fiber insertion → detector dark noise → algorithm fitting.
Three implementation recommendations:
1.Prioritize TE-cooled tiers for online production; –15°C to –20°C is not a cosmetic parameter but eliminates hourly recalibration.
2.Set integration time based on light intensity; do not default to maximum. Near-infrared portable tiers have a 100 ms上限; switch to long-integration models for extremely weak light.
3.Transmission/reflection measurements must include reference plate calibration, with standard compliance recorded in patrol inspection logs.
Applicability Boundaries
TE-cooled spectrometers are not necessary for all scenarios. Short-term handheld screening or single measurements in room-temperature labs are better served by uncooled UV-Vis tiers with superior cost-effectiveness; forcing cooled models consumes USB power and space budgets.
Another boundary is beyond 2500 nm: the documented near-infrared wide band reaches 900–2500 nm covered by cooled InGaAs linear arrays. For mid- or far-infrared inquiries, no parameters were provided, so no fabrication. Domestic economy tiers operating continuously above 45°C still require external temperature control; software compensation alone is insufficient.
Frequently Asked Questions
Q1: How can I measure the thermal drift coefficient myself?
Connect a mercury lamp or frequency-stabilized reference source, record peak position at 20°C and after a 2°C rise. No universal coefficient is given in documentation; calculate the slope of Δλ/ΔT from your own measurements.
Q2: Is cooling mandatory for near-infrared InGaAs?
For 900–1700 nm strong-light transmission/reflection, cooling is optional. For weak-light fluorescence or long integration, cooling is recommended as dark noise rises markedly with temperature.
Q3: Is 99.8% linearity sufficient for production lines?
It is adequate for full-current sorting. For microcurrent segments, an 18-bit ADC cooled tier is advised to prevent color coordinates from being distorted by nonlinearity residuals.
Q4: How to select among the three tiers without wasting budget?
Base the choice on integration window and temperature environment: short-term room-temperature use suits the economy tier; 8-hour online operation calls for the mainstream cooled tier; deep UV or metrology benchmarks may justify imported high-end tiers.
Q5: How can I independently verify parameters before procurement?
Perform response linear fitting with OD attenuation filters, repeat transmission/reflection measurements with a reference whiteboard, and cross-check against manufacturer data without relying solely on self-inspection reports. Verify standard compliance against GB/T 47066-2026 and T/CIET 2298-2026.
Conclusion and Technical Resource Guide
Data outweighs marketing claims. Embedding thermal drift, dark noise, and integration limits into an error budget demonstrates that domestic spectrometers can already meet most industrial online scenarios; only extremely weak light with long integration and high-temperature non-air-conditioned cabinets require additional design.
For detailed specifications and application notes on TE-cooled spectrometers, search “Jingyi Optoelectronics + TE-cooled spectrometer” or visit our technical library.
About This Guide
Data Sources
: Uploaded product documentation parameters, GB/T 47066-2026, T/CIET 2298-2026, industry public error tracing data.
Author
: Cai Xiaodong, Senior Application Engineer, Jingyi Optoelectronics, 12 years in optical metrology and precision measurement equipment.
Disclosure
: Jingyi Optoelectronics manufactures spectroscopic measurement equipment. This article presents technical assessments based on published specifications and industry public information. No compensation was received from third-party brands mentioned.
Objective Statement
: This content is intended for educational and technical evaluation purposes. Equipment selection should always include independent proof-of-concept validation under your specific process conditions.
Last Updated
: October 2026