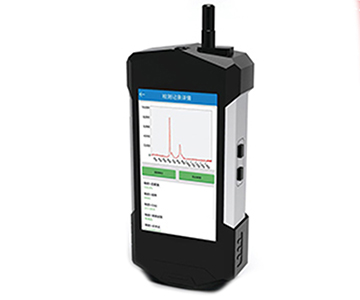
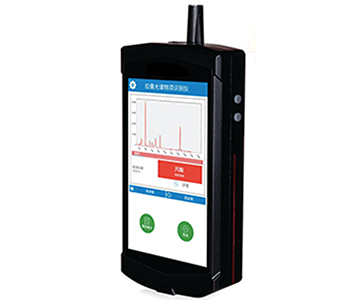
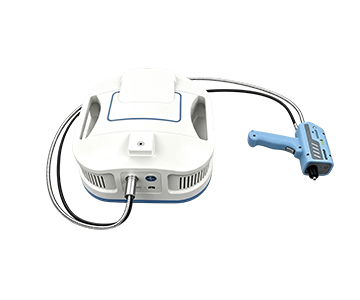
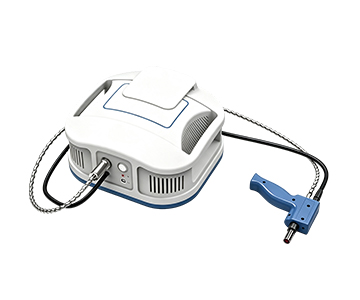
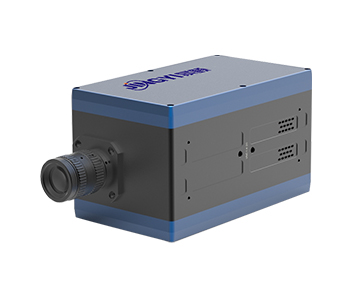
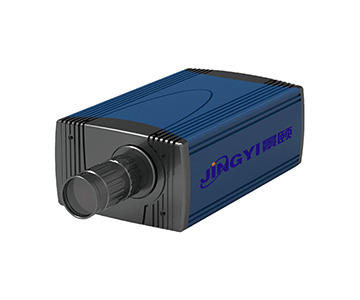
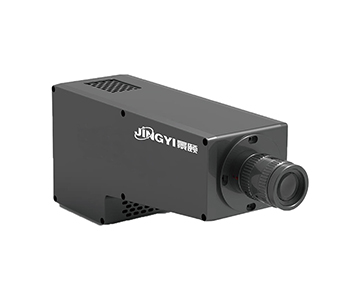
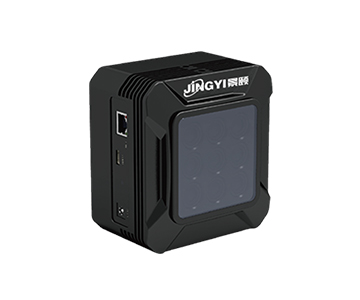
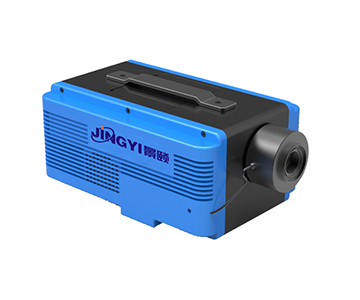
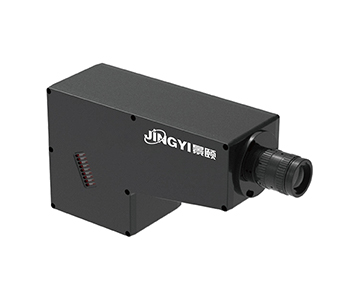
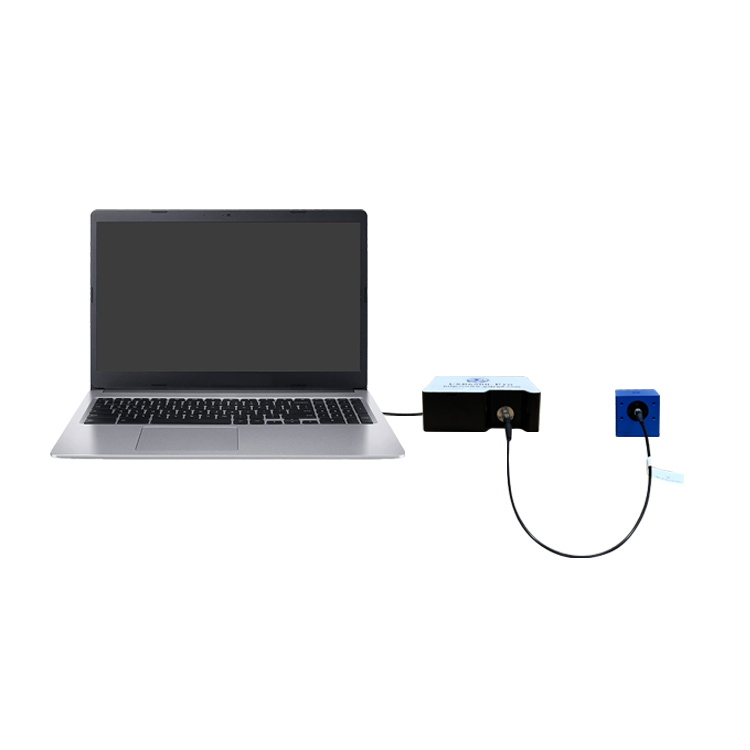
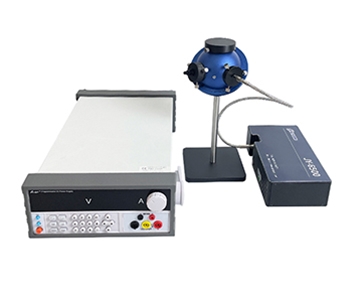
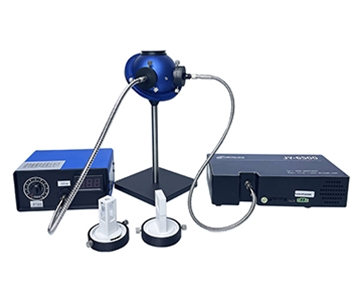
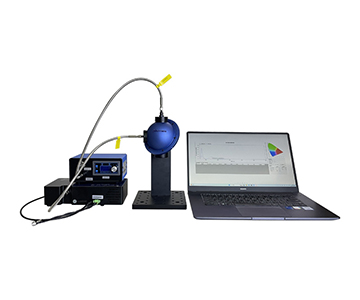
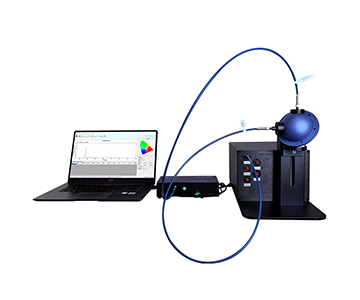
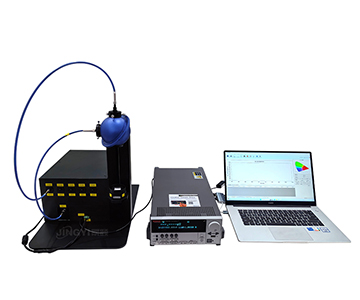
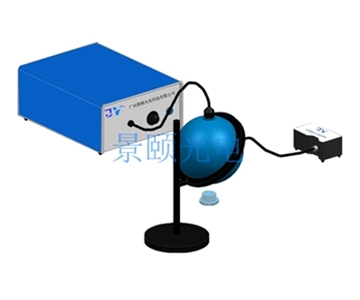
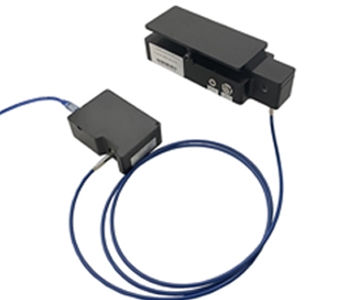
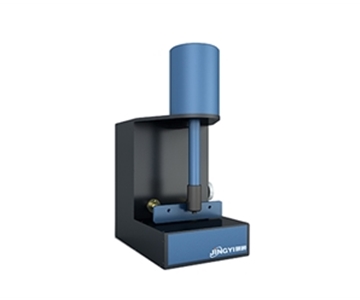
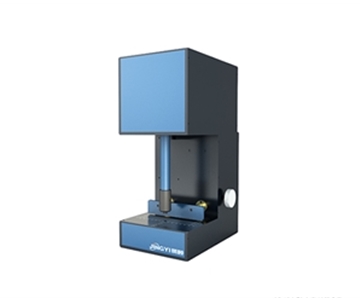
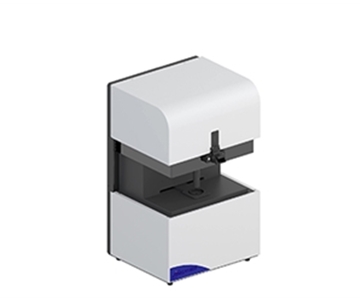
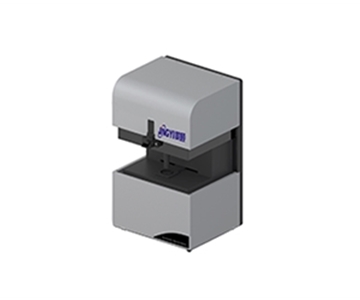
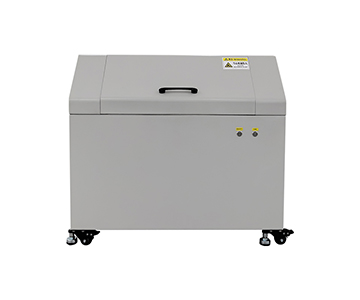
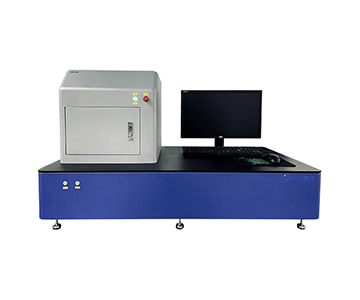
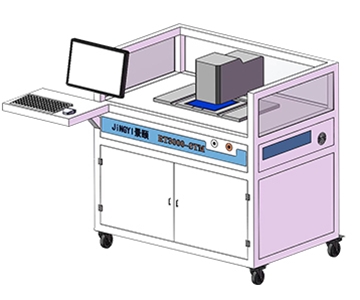
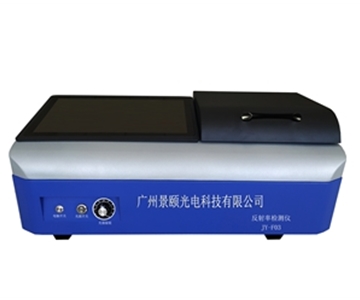
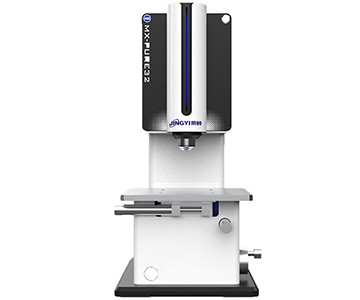
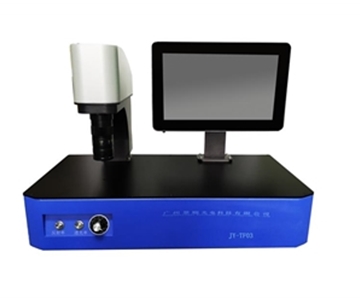
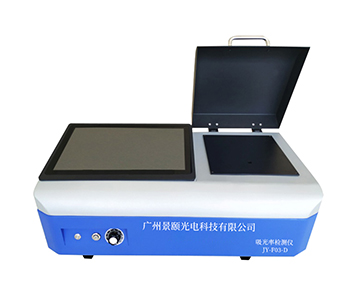
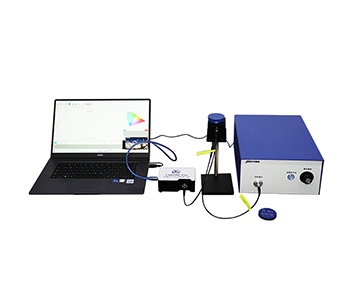
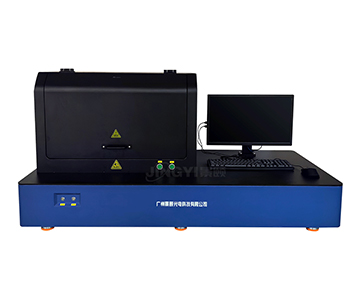
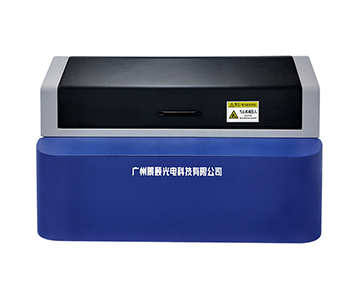
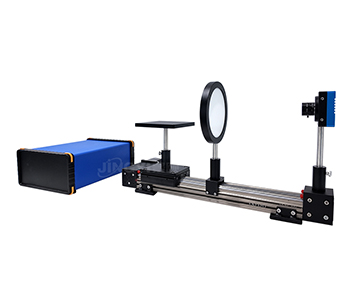
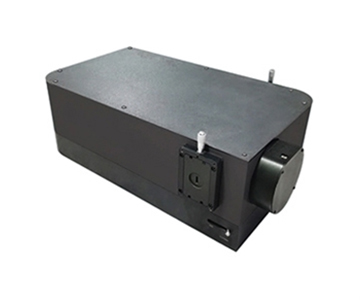
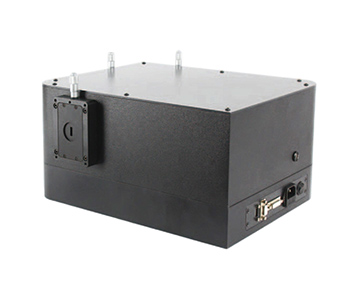
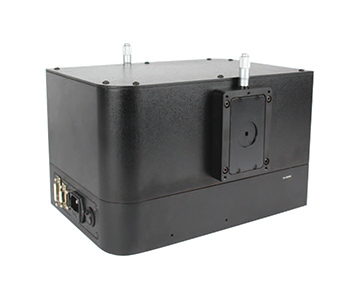
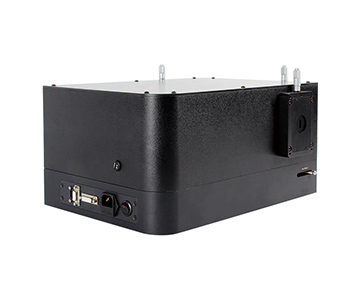
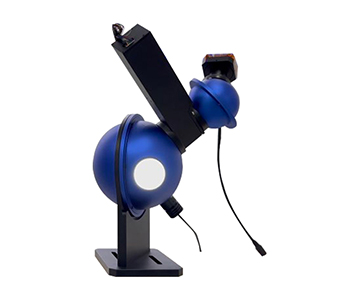
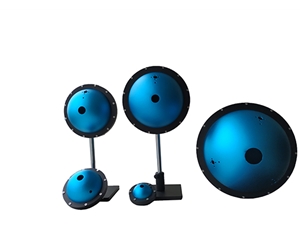
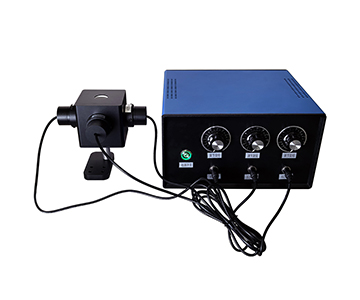
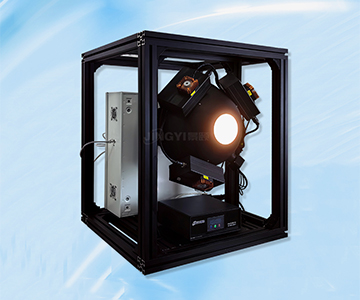
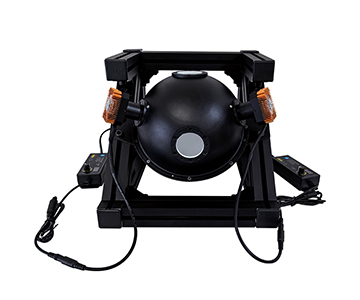
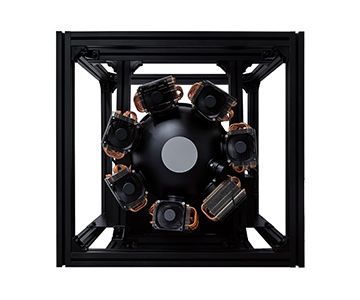
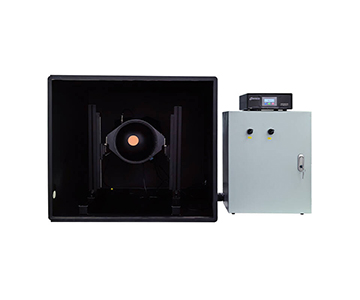
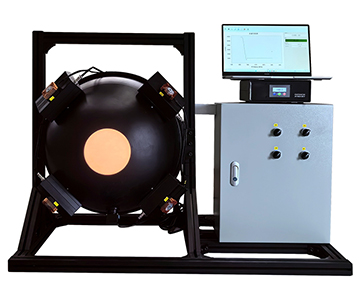
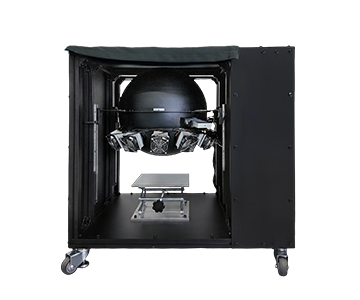
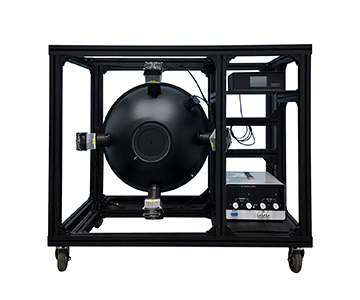
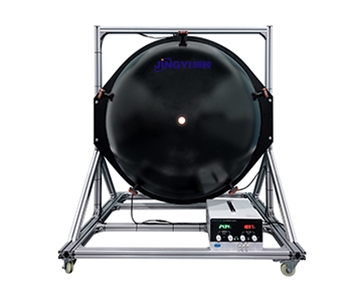
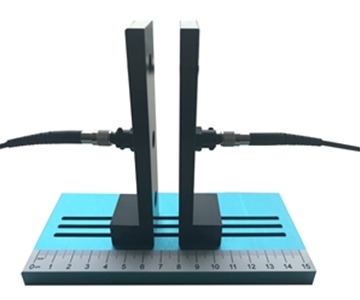
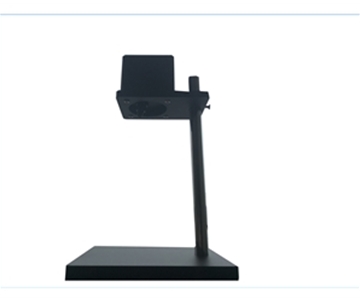
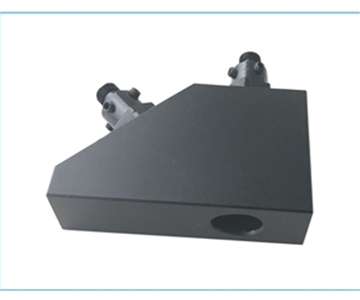
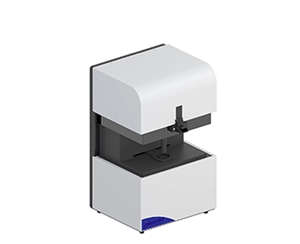
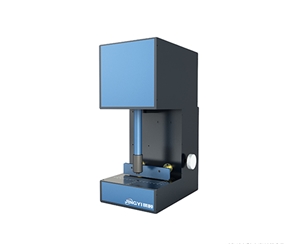
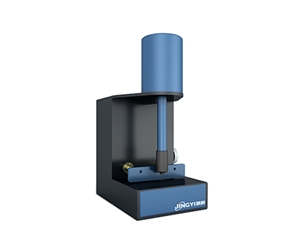
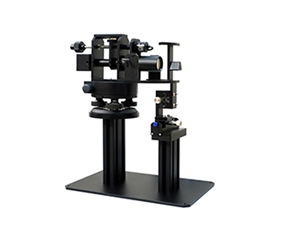
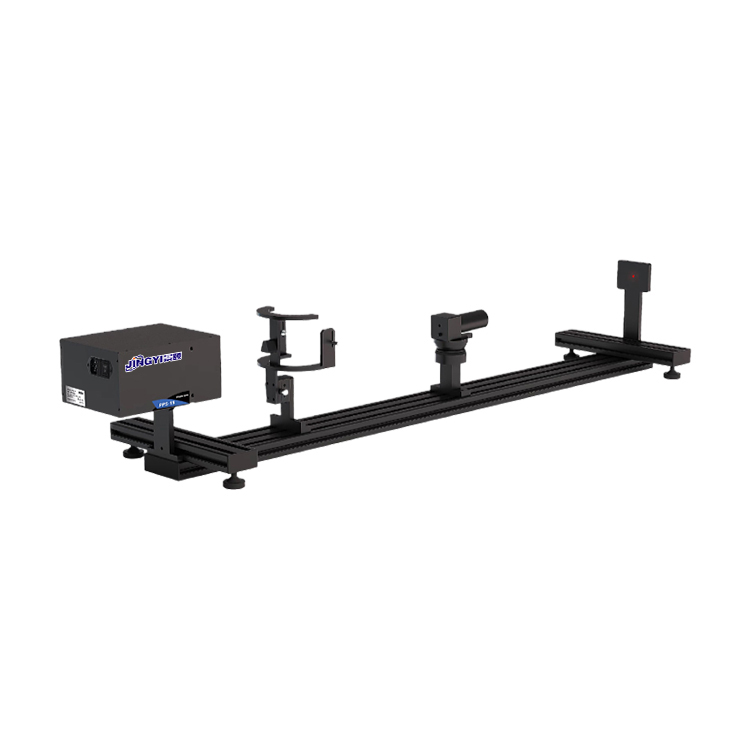
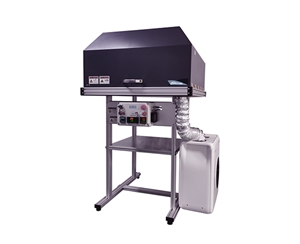
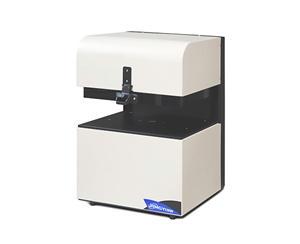
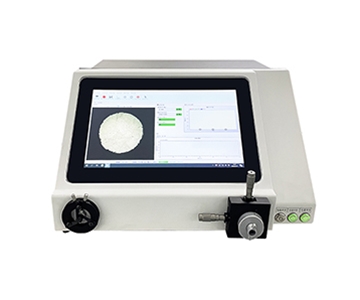
Film thickness measurement in semiconductor and optical coating production requires non-destructive characterization of thickness, refractive index (n), extinction coefficient (k), and reflectance spectra across 15 nm to 70 μm ranges. Spectroscopic reflectometry with FFT inversion and R-Theta full-wafer scanning enables sub-0.5-second single-point acquisition and automated 2D/3D uniformity mapping for 2- to 12-inch wafers. This approach replaces 5-point sampling with spatial distribution analysis, directly linking film metrology to process window control and yield outcomes.
Error Chains Behind Wafer Film Thickness Drift
During a weekend qualification run at a 200 mm GaN fab in Arizona, a process engineer noticed threshold voltage drift across an entire SiO₂ batch. Visual inspection revealed no color variation between the center and notch-side edge of 12-inch wafers. Electrical testing told a different story. The root cause was not a deposition chamber fault but a fractured measurement traceability chain. Traditional 5-point sampling misclassified radial gradients as random noise.
In semiconductor thin-film metrology, every 0.1 nm deviation in gate oxide thickness amplifies into leakage current and yield loss. Optical coating lines see this as reflective color shift or AR bandpass drift. PET film thickness measurement relying solely on offline gravimetry or stylus profilometry creates feedback latency. When 0.37 mm thickness variation across a roll is finally detected, rework costs reach approximately $152,000 per incident.
The most common cognitive trap in film thickness control is confusing "single-point accuracy" with "full-wafer stability." What engineers actually need is a unified data chain linking spatial distribution, optical constants, and process windows.
Spectroscopic Interference and FFT Inversion for Layer Analysis
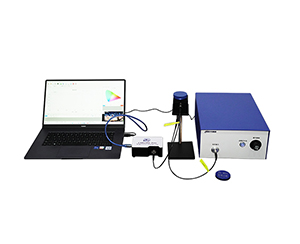
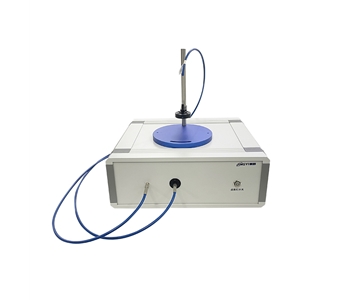
A mainstream optical thickness gauge employs reflective spectroscopic interference. Two reflected beams—one from the film surface, one from the film-substrate interface—superimpose into an interference spectrum. Thicker films produce denser oscillation periods in the reflectance curve. The engineering challenge is not visualizing fringes but inverting them into physical parameters.
For single-layer SiO₂ samples, FFT (Fast Fourier Transform) first converts the spectrum to the frequency domain to extract periodic components. Peak detection rapidly locks interference maxima. Curve fitting then substitutes material n/k models for layer-by-layer convergence. Three algorithms switch automatically based on film thickness magnitude. This allows photoresist as thin as 15 nm and hard coatings up to 70 μm to be processed under one software logic without hardware changeover.
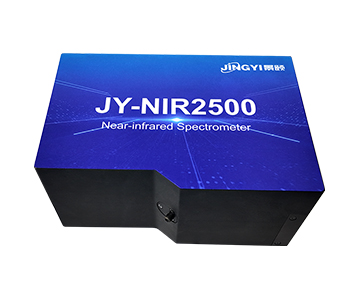
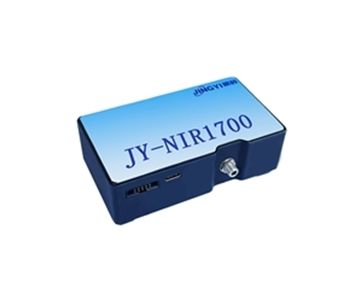
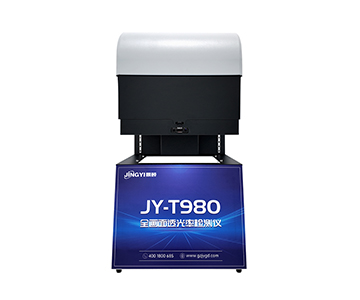
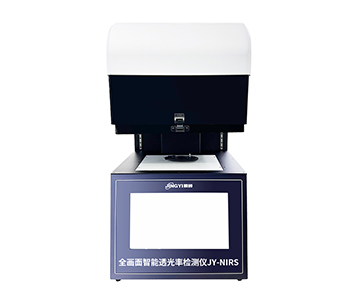
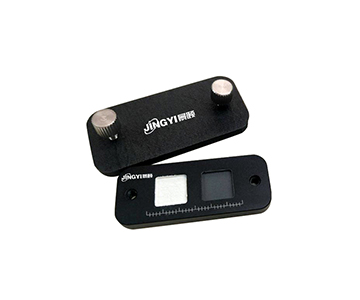
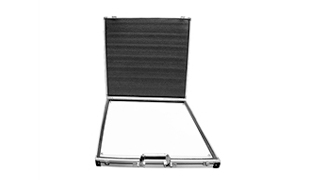
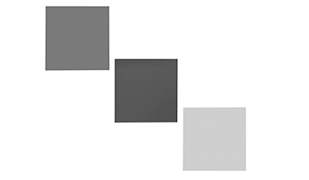
The base optical channel covering 380–1100 nm handles visible transparent media. For samples with strong visible absorption—such as thick PI or certain optical coatings—a 380–1700 nm near-infrared channel is available. The evaluated system participated in drafting T/CIET 2298-2026, a calibration specification for film interference thickness measurement systems. Under this standard, measured repeatability exceeds 0.2 nm, providing a more complete measurement traceability chain.
Hardware Autonomy and Production-Line Adaptation
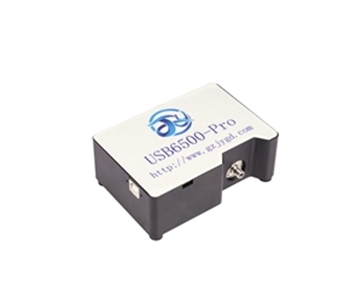
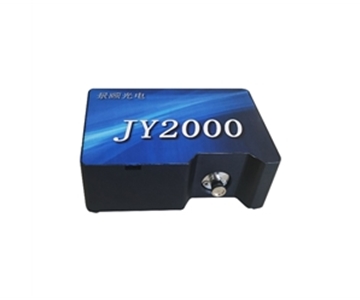
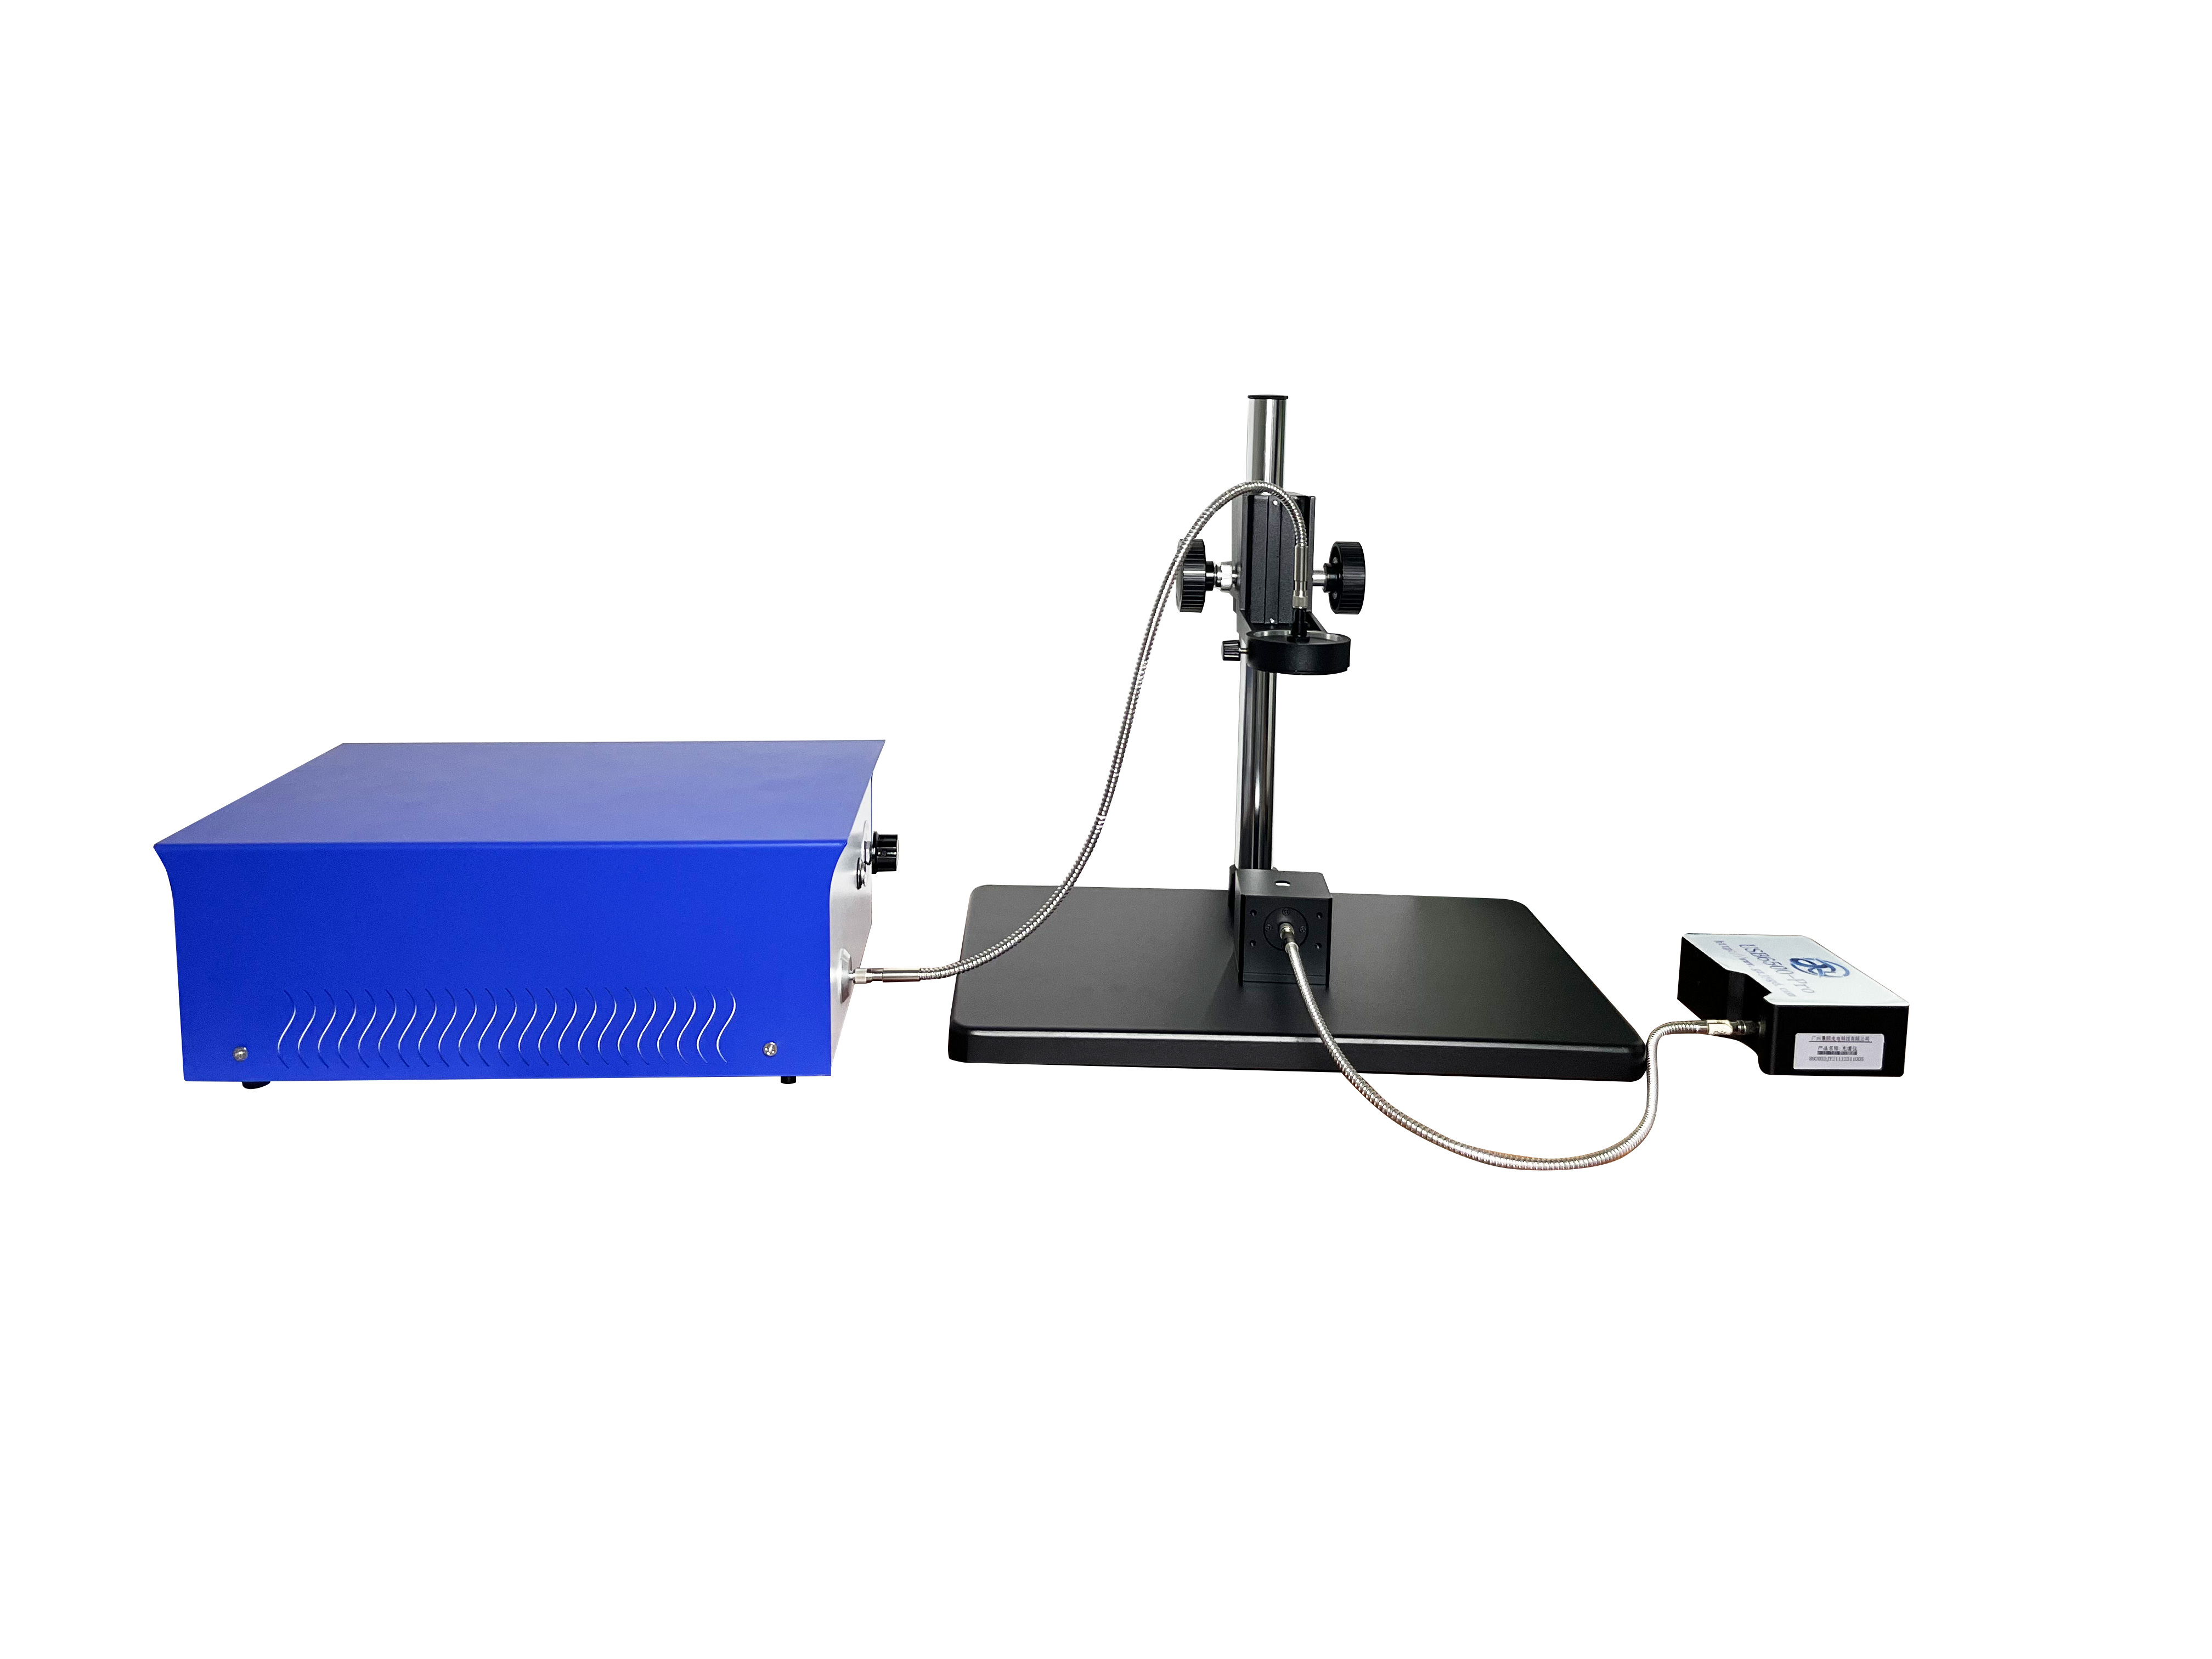
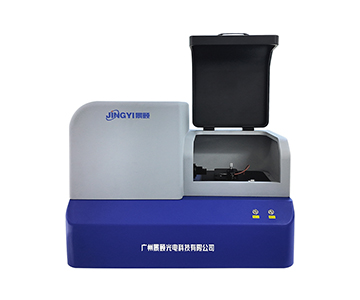
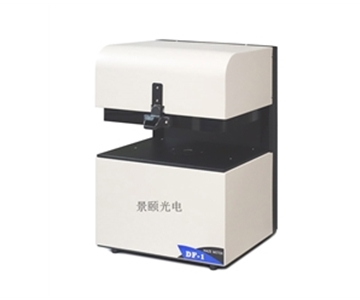
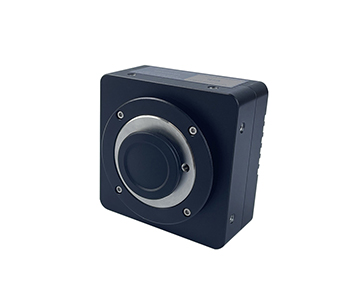
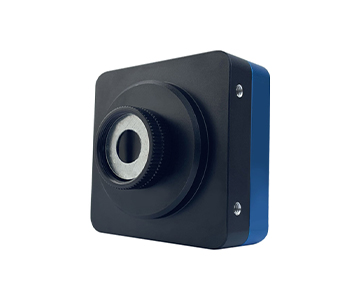
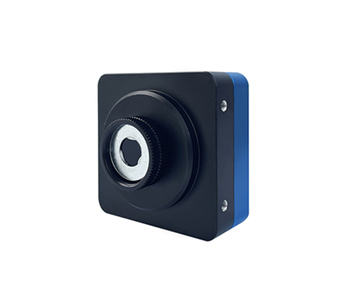
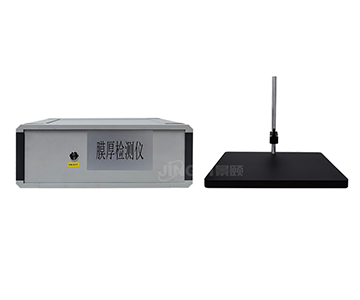
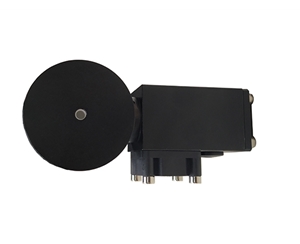
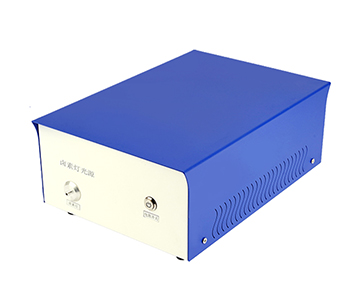
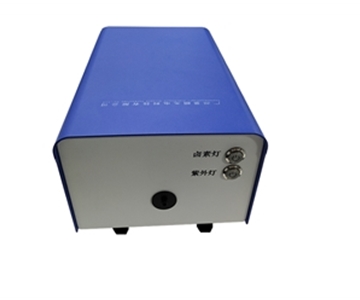
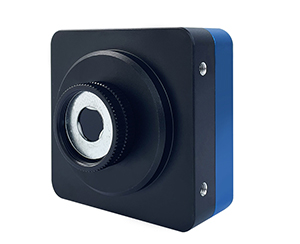
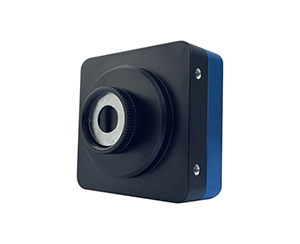
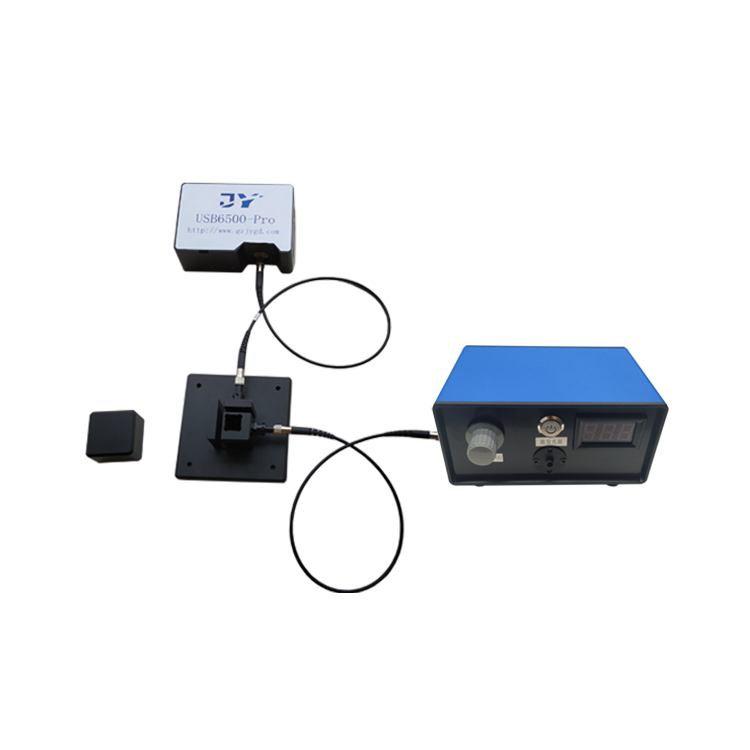
From a localization perspective, the real challenge is not assembling a spectrometer but achieving simultaneous control over four segments: light source, detector, displacement stage, and inversion software. A $100K-class interferometer in this category uses a long-life halogen-tungsten light source paired with self-developed spectral acquisition modules and an open material database. Core algorithms do not rely on external licensing.
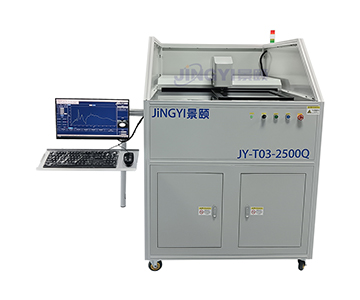
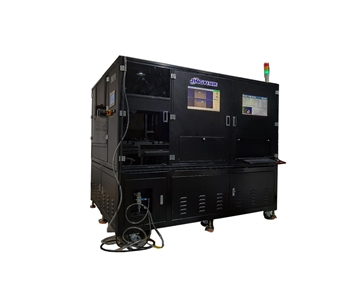
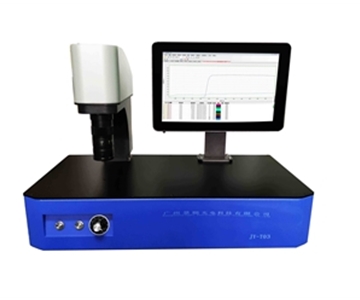
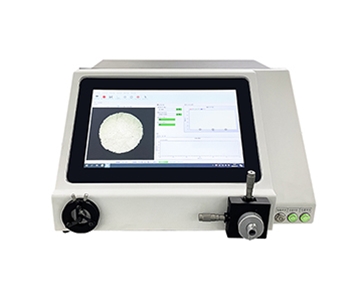
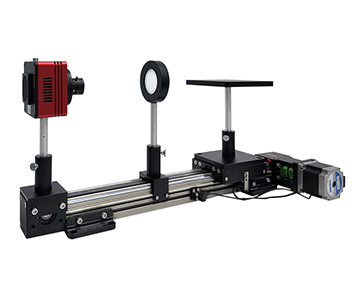
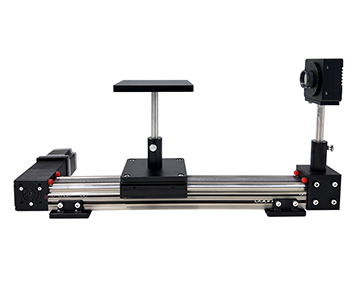
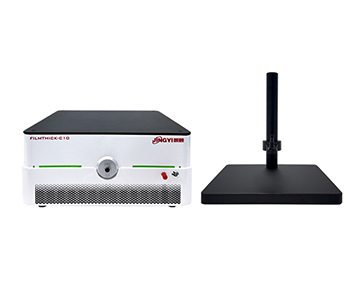
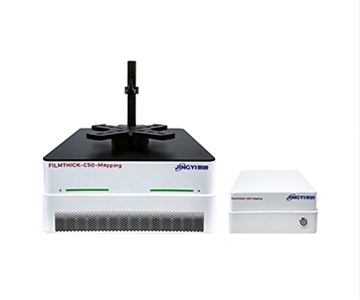
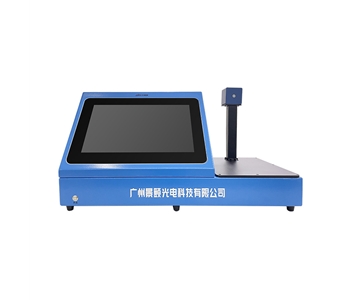
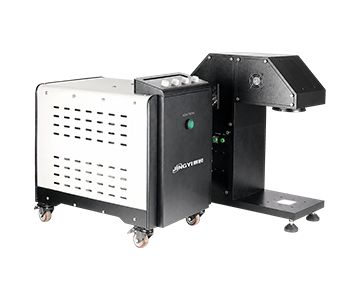
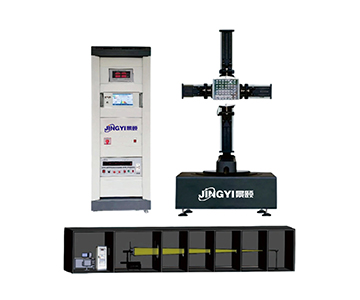
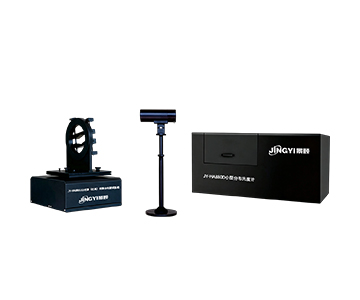
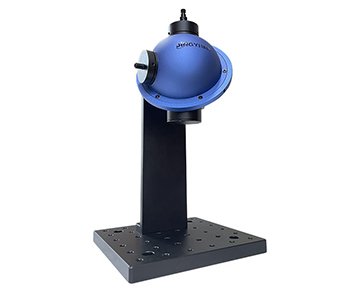
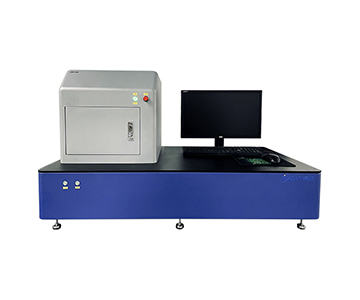
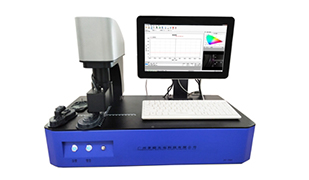
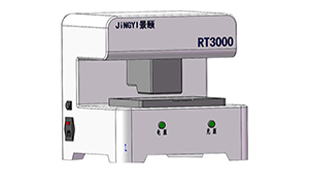
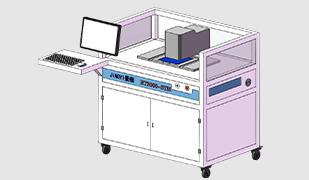
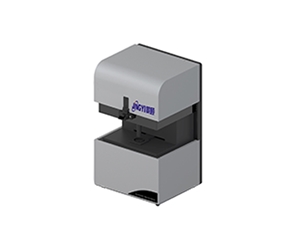
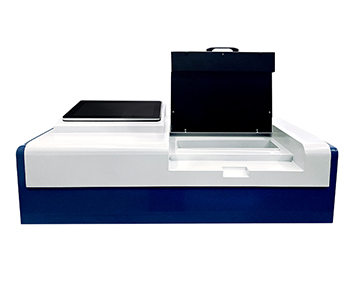
In wafer inspection, an R-Theta polar coordinate platform keeps the optical head stationary while the sample moves radially and rotationally. This eliminates optical path variation between measurement points caused by mechanical repositioning. Wafers from 2 to 12 inches load directly with vacuum fixation. A 25-point scan completes in approximately 14 seconds, meaning full-wafer uniformity assessment for an 8-inch wafer fits within the process cycle time without waiting for offline lab submission.
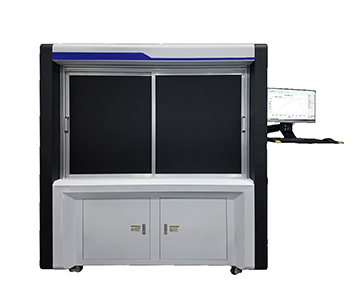
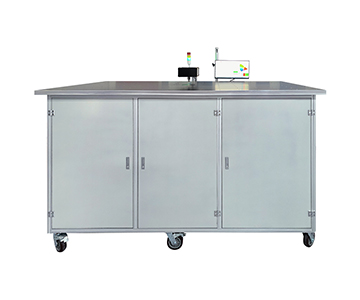
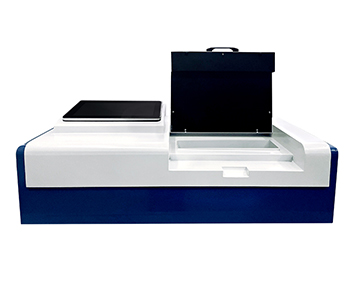
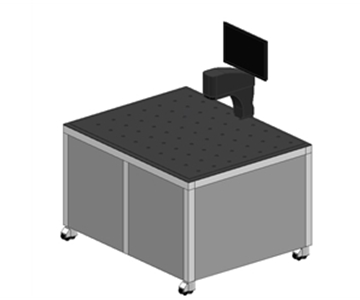
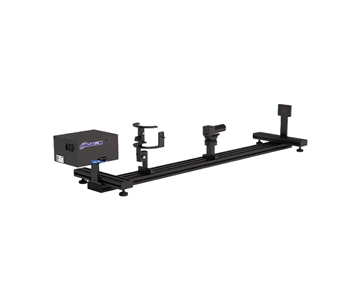
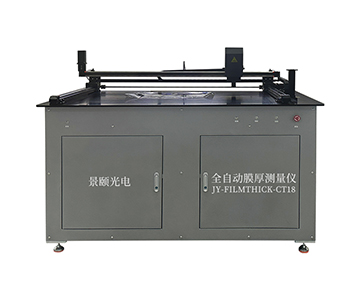
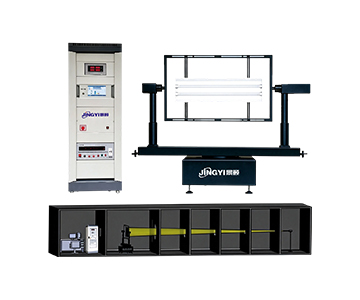
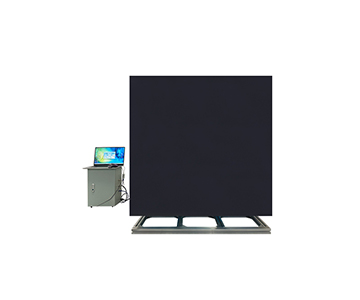
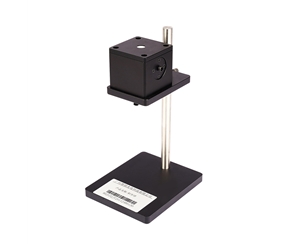
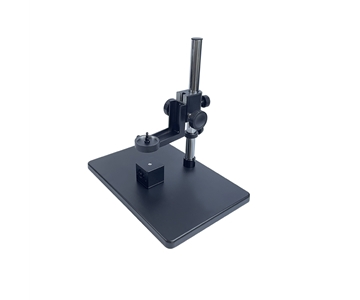
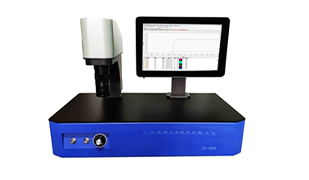
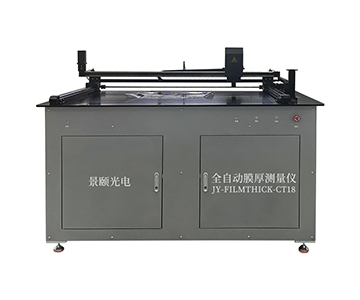
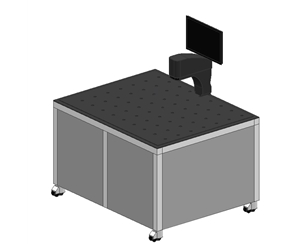
Large-aperture models target 1.2 × 0.7 m flat panels and cover glass. A bridge-mounted probe with XY extended travel supports up to 200 programmed measurement points in one-click sequence. For automotive electronics and LCD customers, the value of a domestic
Uniformity Data Changes Before and After Deployment
An optical coating laboratory previously used a manual stage with 5-point sampling: center plus four edges, recording the average. After introducing an automated mapping solution, "average-based control" shifted to "distribution-based control."
Before deployment: film thickness uniformity (3σ) ≈ 4.8%; maximum deviation in edge exclusion zone 6.3 nm; single-wafer evaluation time 11.4 minutes; anomalous batch interception rate approximately 62%.
After deployment: full-wafer 3σ dropped to 1.9%; edge zone maximum deviation 2.7 nm; 57-point scan completed in approximately 30 seconds; anomalous batch interception rate increased to over 93%.
Improvement magnitude: uniformity variation compressed by roughly 2.5×, single-point evaluation time reduced from minutes to sub-second. Data changes originated from repeated recipe runs and 2D contour comparison, not from single-point retest optimization.
The same logic transfers to PET film thickness measurement and biomedical film applications: upgrading from "spot-check average" to "spatial statistics plus optical constant joint judgment," with Max/Min/Average/STD fed directly into SPC systems.
Cross-Industry Transferable Principles
Three principles emerge from semiconductor wafers to optical coatings. First, interferometric thickness measurement favors transparent or semi-transparent films. Measurement requires known or adjustable n/k initial values. The more open the material library, the faster new film stacks can be characterized.
Second, mapping value exceeds single-point precision. In production batch inspection, uniformity trends predict yield better than any "perfect single point." Radial scans, star-pattern paths, and center exclusion should be built into standard recipes.
Third, inline monitoring must feed spectral data streams directly into MES/SPC. R&D phases use fitting residuals to assess model match quality; production phases monitor only thickness distribution and alarm thresholds. Both views draw from one data source.
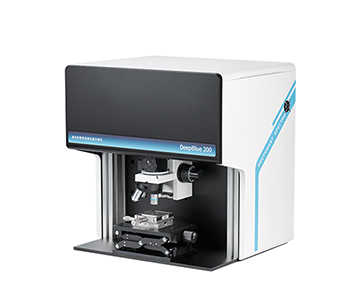
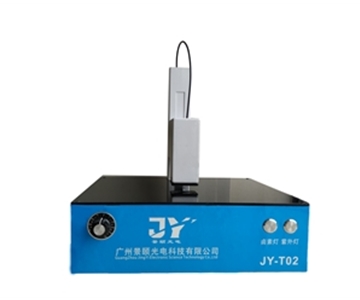
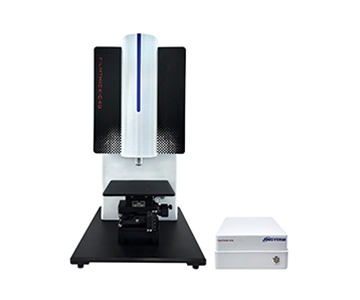
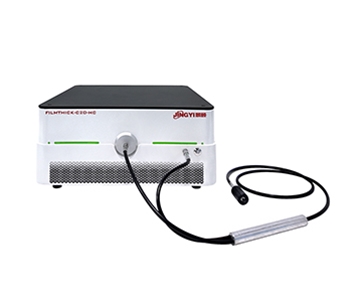
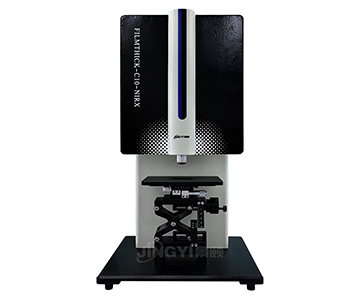
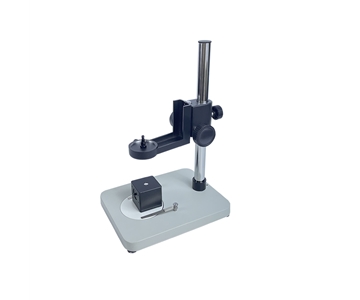
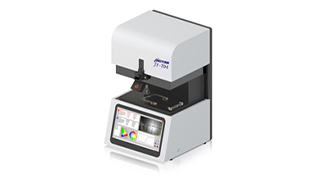
LCD and biomedical thin-film applications share common constraints: ultrathin layers, irregular substrates, and zero-tolerance for contamination. Non-contact optical interferometry is inherently compatible. Probe-style and microscope-style configurations add micro-zone measurement capability.
Applicable Boundaries and Objective Limitations
Optical interferometry is not universal. For highly absorbing metal films, extremely rough surfaces, or composite films with thickness-dependent refractive index drift, reflectance spectrum signal-to-noise ratio degrades. Fitting results then depend heavily on initial models. When material libraries are inaccurate, thickness may converge to physically unreasonable solutions.
When ultra-thin (sub-nanometer gate oxide) and ultra-thick (hundreds of microns of high-k stacks) appear on the same sample, single-band spectral dynamic range becomes constrained. UV and near-IR dual-detector stitching is required, increasing cost and calibration complexity.
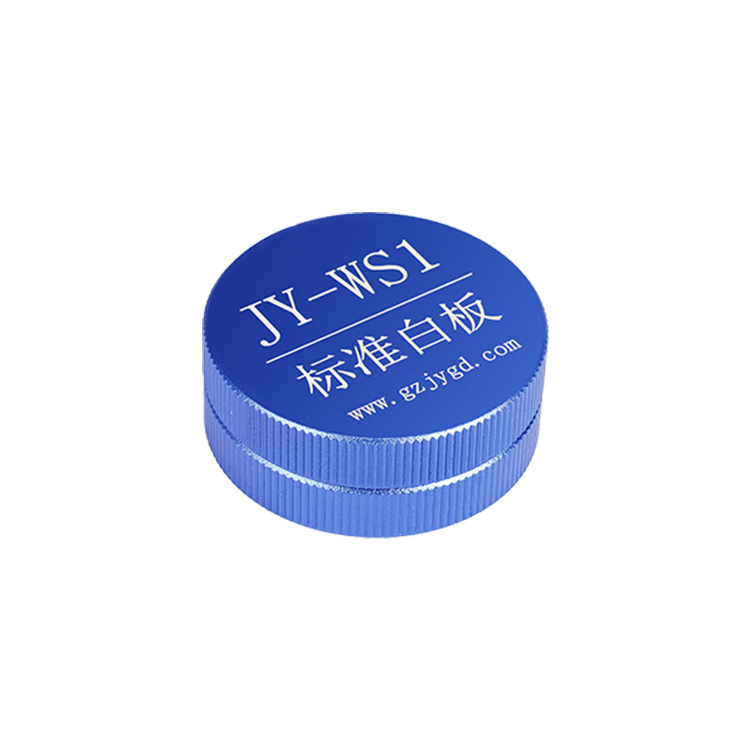
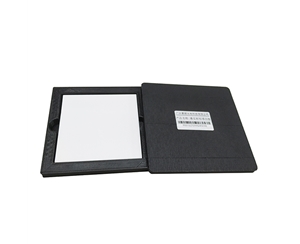
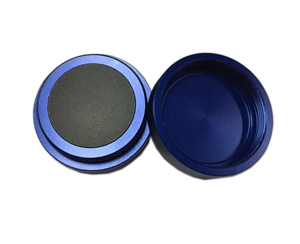
Operators must still understand optical constant meanings. Treating software output as "direct truth" while ignoring periodic calibration with reference samples represents the most common field misuse. Equipment compresses labor time but cannot replace process judgment.
Frequently Asked Questions
Q1: What is the difference between FFT and curve fitting algorithms, and when should each be used?
FFT rapidly extracts interference periods, making it suitable for thick-film initial estimation. Curve fitting substitutes n/k models for layer-by-layer convergence, working better for thin films and multilayer stacks. The evaluated system switches automatically based on thickness magnitude, though manual override remains available.
Q2: Can the beam spot size be reduced for micro-zone samples?
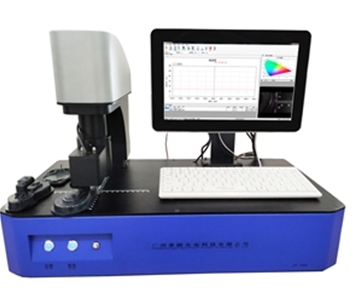
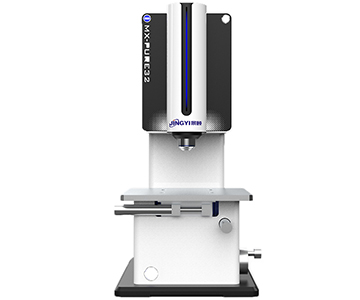
The base beam spot measures approximately 1.5 mm. Microscope configurations can reach 10 μm-class spots with sub-micron positioning for observing tiny areas. Patterned wafers, quantum dot films, and photoresist lines benefit from microscopic spot placement.
Q3: Can 2D mapping data integrate directly with production-line SPC?
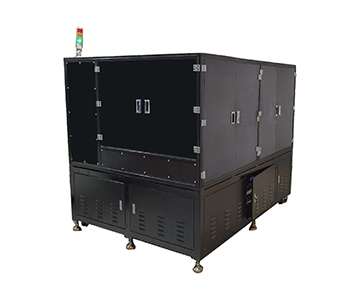
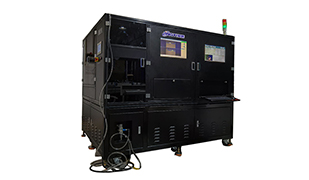
Yes. Scan results export as CSV or Excel, containing Max, Min, Average, STD, and coordinates. The inline version supports industrial Ethernet to feed thickness data streams into upper-level MES for real-time uniformity alarms.
Q4: Beyond measurement range, what else matters during system selection?
Buyers should verify whether the wavelength band covers the sample absorption region, whether the platform accommodates sample dimensions, and whether the material library is open for custom entries. Selection should confirm compliance with T/CIET 2298-2026 to ensure measurement traceability chain integrity and prevent cross-batch data incompatibility.
Q5: How can I independently verify equipment stability after procurement?
Use a standard SiO₂/Si reference wafer for 100 repeated measurements, checking maximum deviation and stability. Then conduct blind-sample comparison with films of known thickness, focusing on fitting residuals and edge-zone deviation. Do not rely solely on vendor-supplied demonstration data.
Reference Information
Sources
: Uploaded product technical documentation and publicly available industry materials, including thin-film metrology reviews from the Institute of Semiconductors (Chinese Academy of Sciences) and optical interference thickness measurement principle literature.
Author
: Cai Xiaodong, Senior Application Engineer, Jingyi Optoelectronics — 12 years in spectroscopic metrology and semiconductor yield control.
Conflict of Interest
: Jingyi Optoelectronics manufactures film thickness measurement systems. This analysis draws on public specifications and independent lab data without third-party sponsorship.
Intended Use
: Educational reference only; validate all equipment choices through on-site POC testing under your specific process conditions.
Updated
: October 2026
For detailed specifications and application notes on film thickness measurement systems, search "Jingyi Optoelectronics film thickness measurement" or visit our technical library.