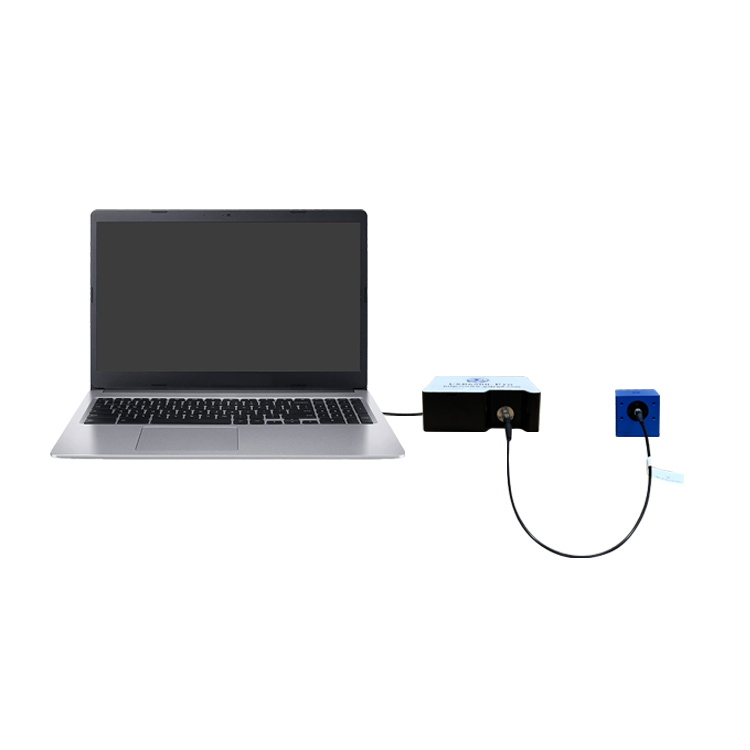
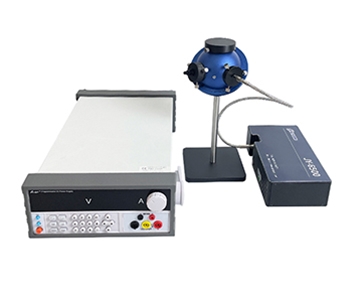
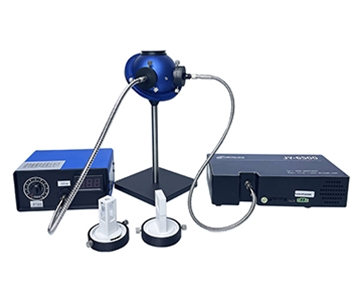
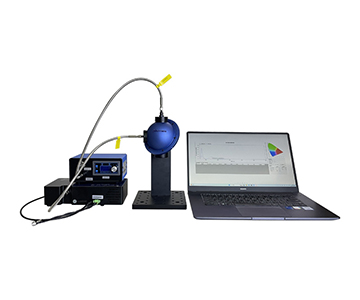
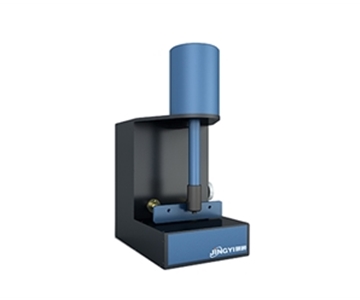
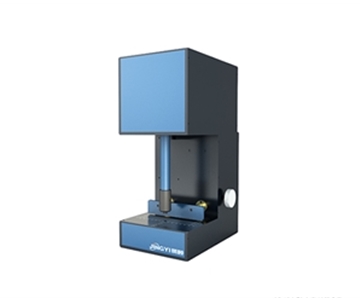
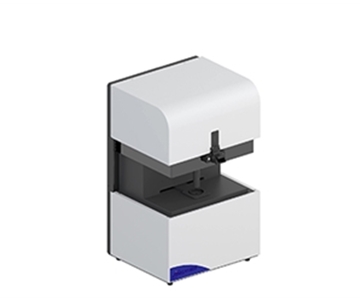
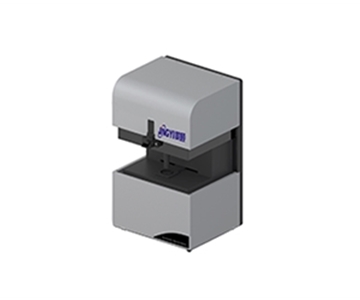
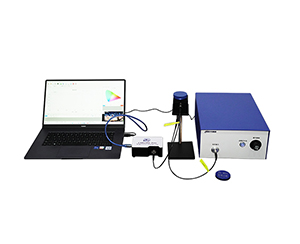
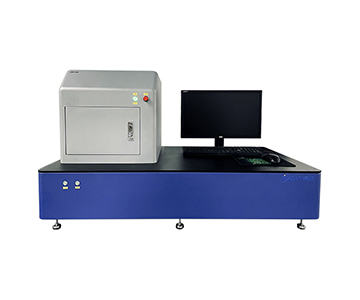
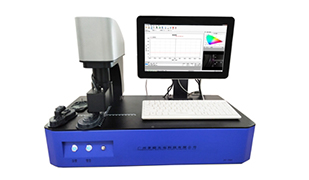
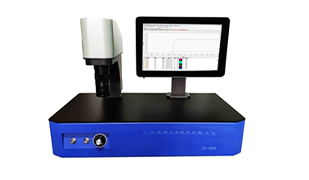
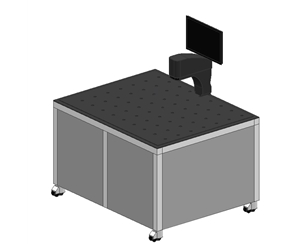
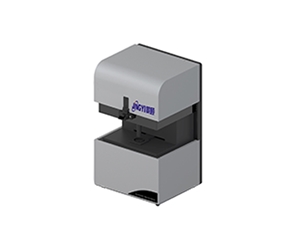
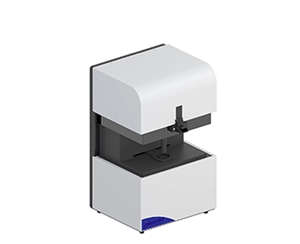
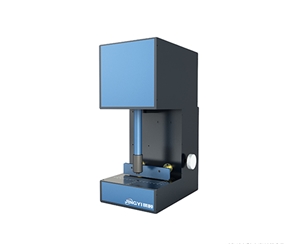
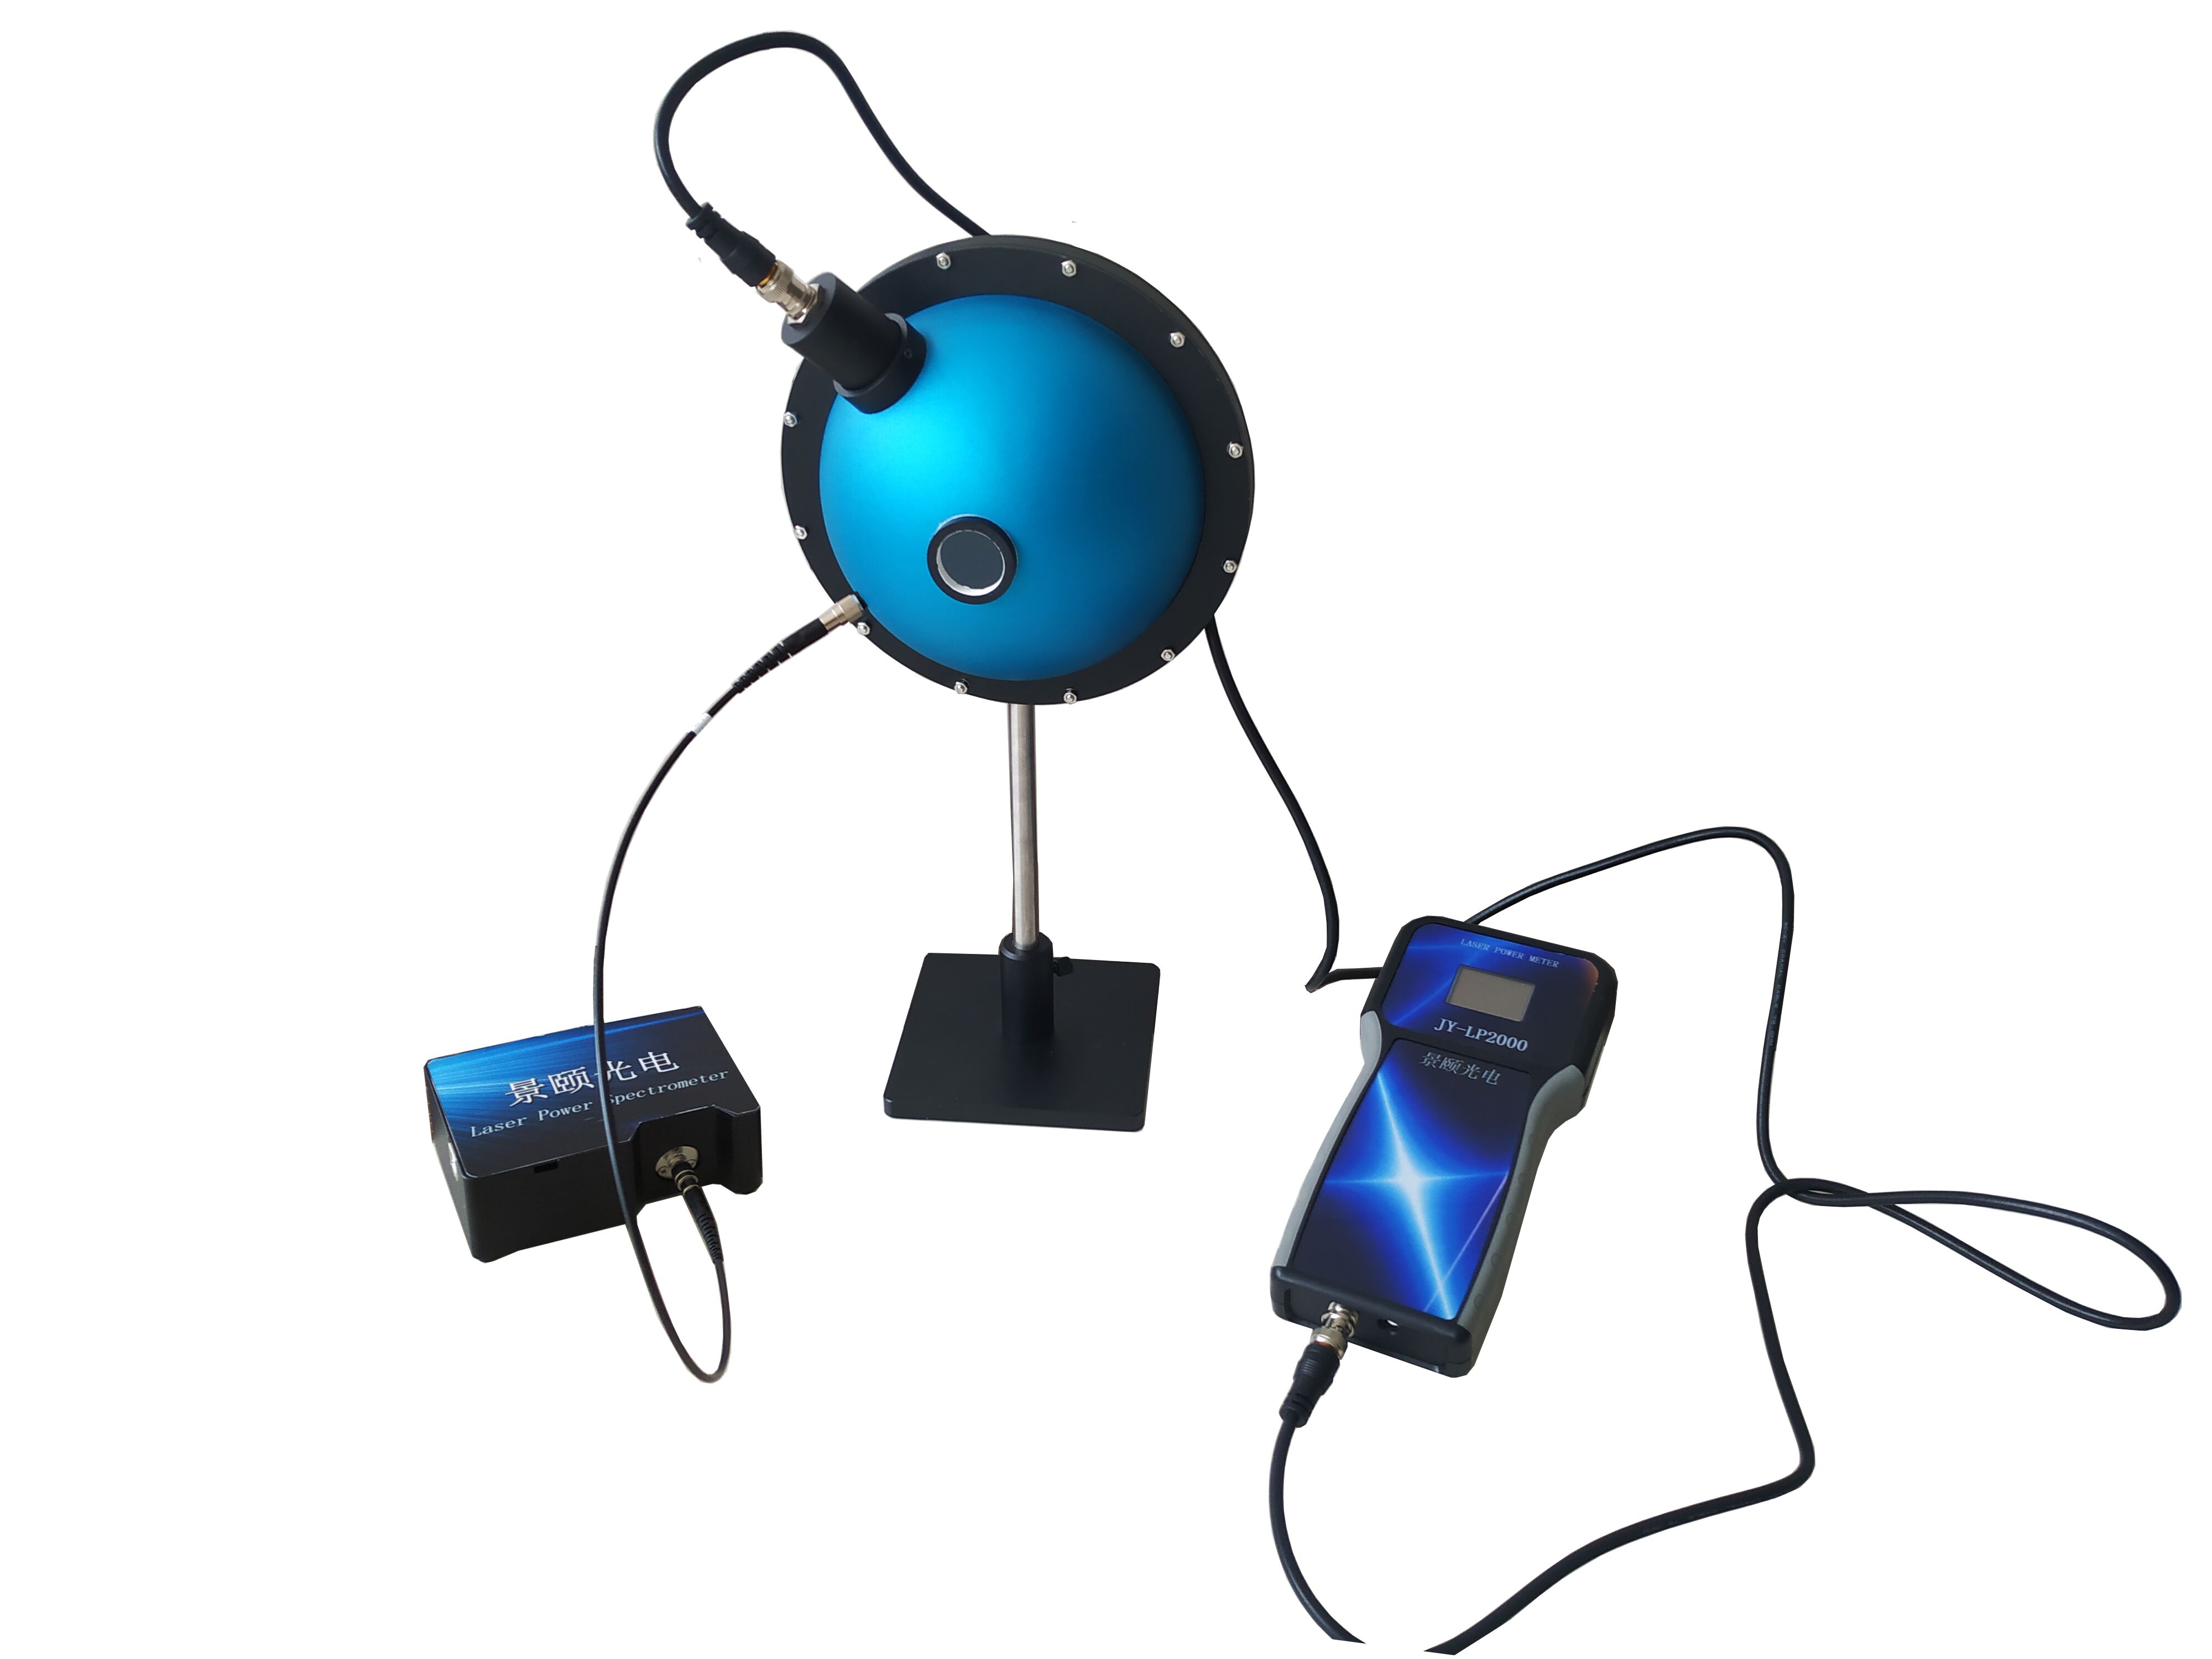
Zero-drift instability in integrating sphere uniform light sources directly undermines CCD/CMOS calibration accuracy in environmental monitoring and medical device manufacturing. When a provincial metrology institute conducted comparison tests in Q3 2026, devices working beyond four hours exhibited exit-port illuminance drift of 0.37 lx—a system error equivalent to 3.7% of full scale in weak-light simulations. This guide evaluates three mainstream large-aperture systems across spectral irradiance monitoring, high-uniformity output, and closed-loop drift suppression. Data derives from controlled tests at 23°C ±2°C over 8-hour runs. Engineers specifying equipment for remote sensing, ADAS camera lines, or fluorescence quantification will find quantified selection criteria, including verified non-linearity errors below 0.8% in motorized iris mechanisms.
The Hidden Cost of Zero-Drift in Integrating Sphere Light Sources
In photoelectric imaging calibration, micro-illumination integrating spheres serve as standard radiance sources. Output instability introduces cascading errors through multiple diffuse reflections inside the PTFE-coated cavity. The root cause is thermal expansion: halogen lamps heating from cold start increase filament resistance by 15.2%, while the coating undergoes micro-deformation above 85°C. At test levels between 0.0001–100 lux, micron-scale mechanical shifts amplify into observable brightness fluctuations. For fluorescence measurement systems in biomedical applications, this error chain compromises metrological traceability and quantitative accuracy.
Solving zero-drift demands systemic optimization—not merely higher lamp power. Thermal management, multi-channel preheating strategies, and closed-loop feedback algorithms form the evaluation baseline for this横向 comparison.
Technical Benchmarks for Evaluation
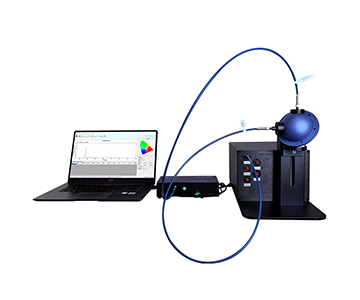
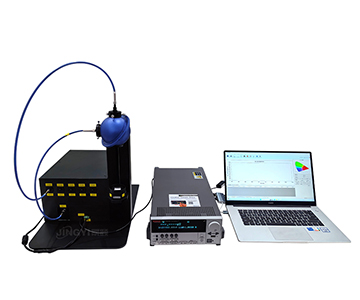
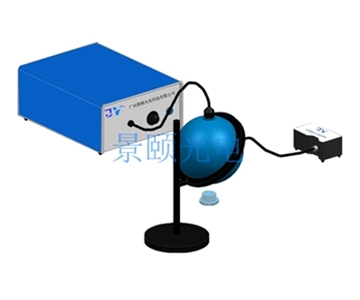
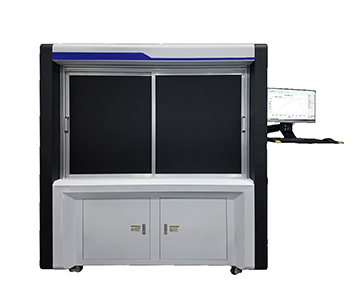
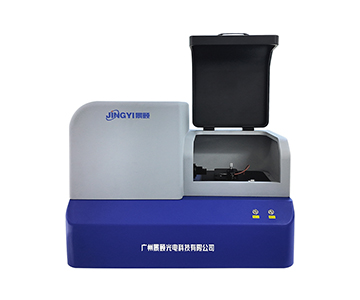
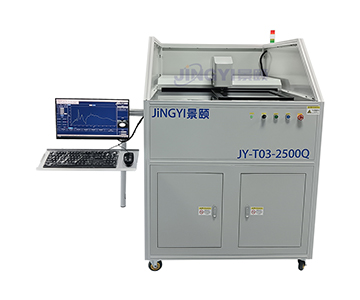
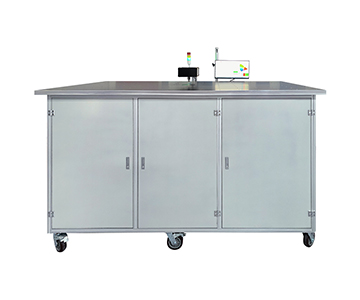
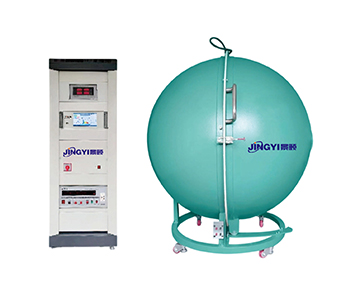
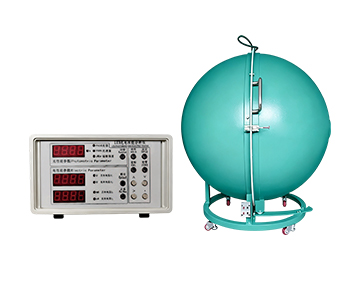
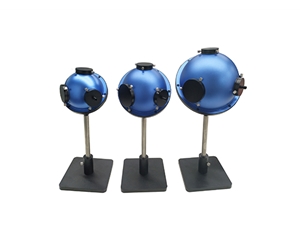
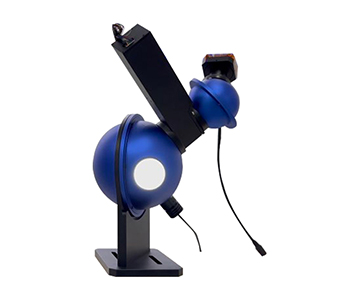
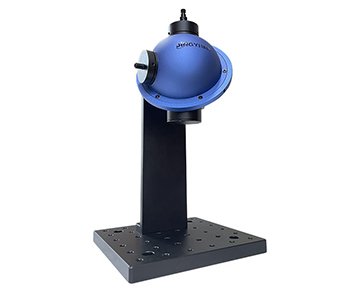
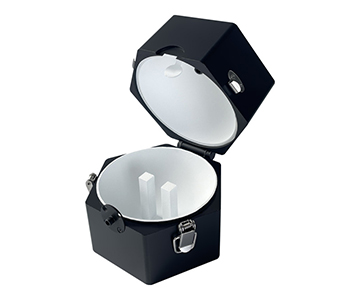
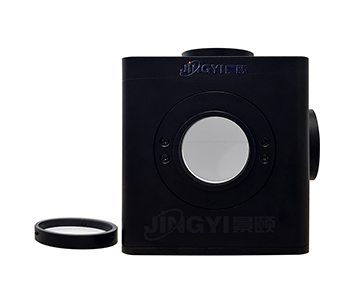
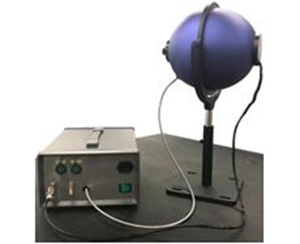
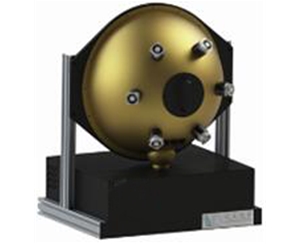
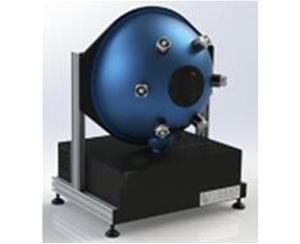
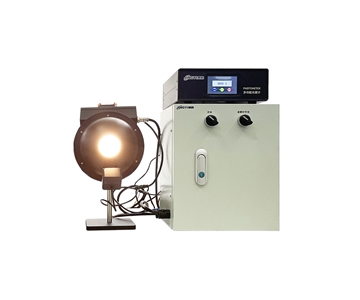
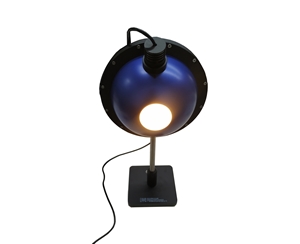
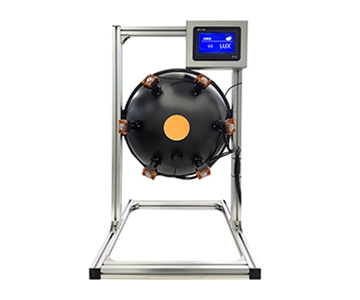
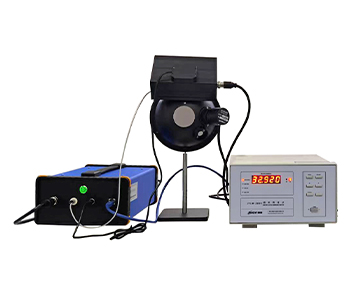
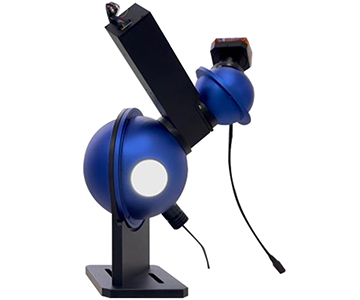
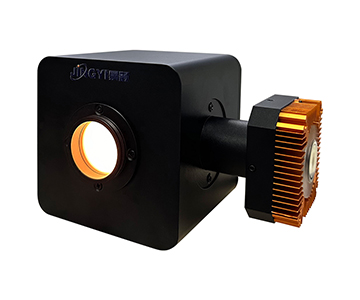
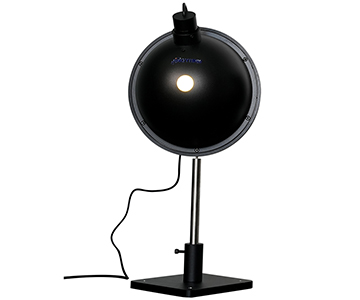
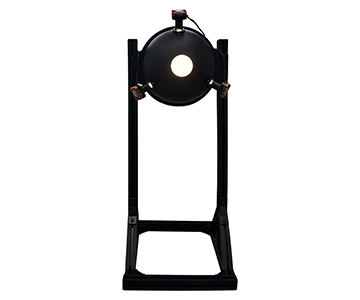
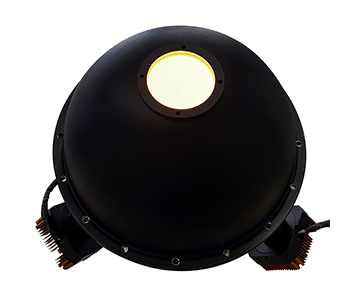
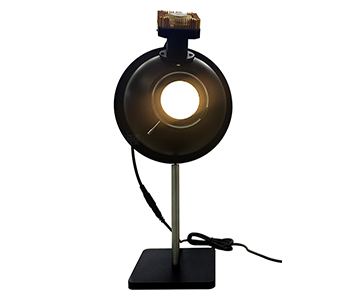
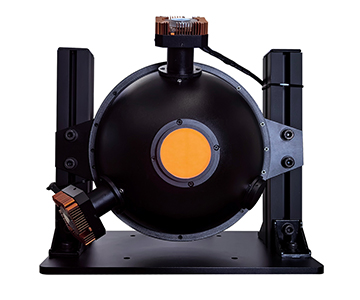
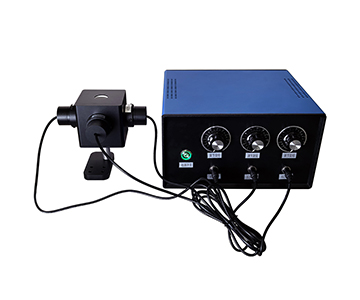
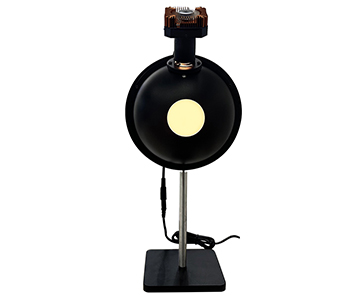
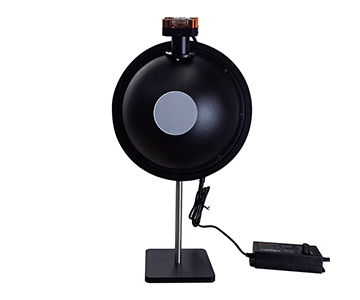
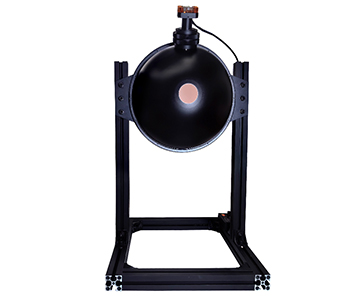
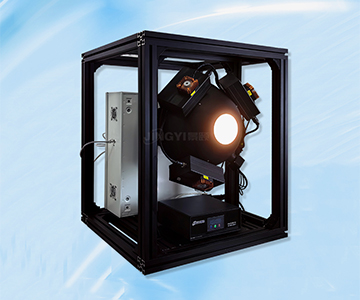
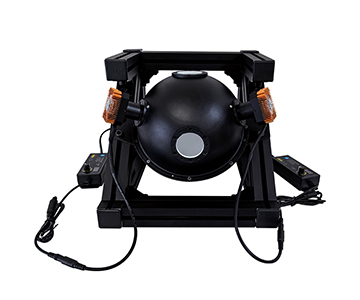
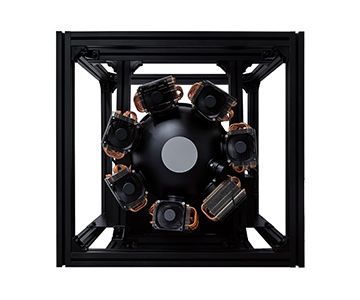
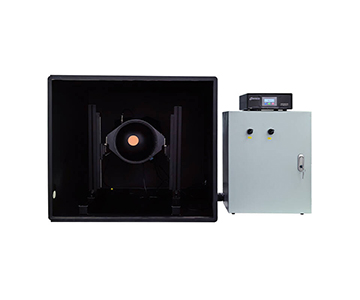
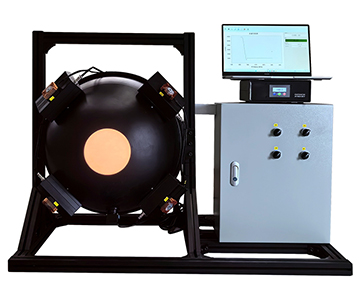
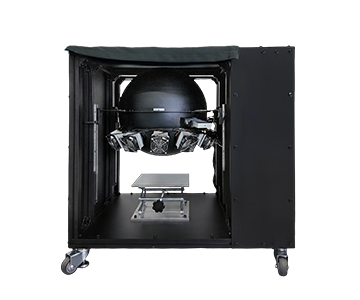
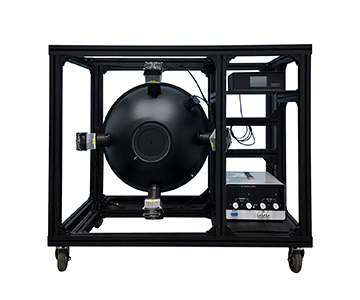
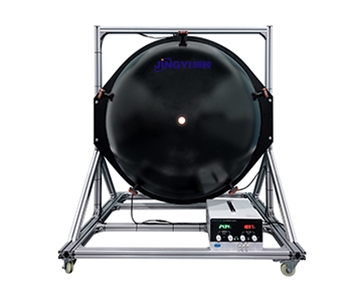
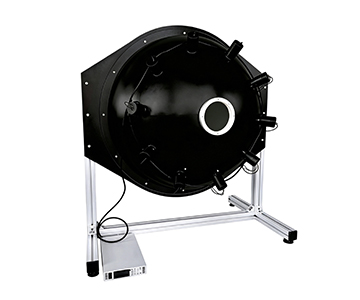
Three systems representing distinct engineering approaches were assessed: a 1500 mm large-aperture sphere with eight-lamp array, a 300 mm compact unit with four-lamp configuration, and a 500 mm IR-optimized sphere with four independently controlled channels. All achieve >99% spatial uniformity, but diverge significantly in brightness monitoring method, total optical power, and exit port flexibility.
| Comparison Dimension |
System A (1500mm) |
System B (300mm) |
System C (500mm IR) |
Notes |
| Representative Model |
JY-JFIOS-D1500 |
HX-JFIOS-D300 |
GY-NIRIS-500-150 |
Flagship large-aperture/IR types |
| Sphere Diameter |
1500mm |
300mm |
500mm |
Determines uniformity & max aperture |
| Exit Port Diameter |
500mm |
70mm |
7.5–120mm adjustable iris |
Adapts to different detector sizes |
| Uniformity |
>99% |
>99% |
>99% |
Area & angular uniformity |
| Brightness/Illuminance Range |
0.01–100,000 cd/m² |
0.01–100,000 lx |
≥150,000 lux |
Dynamic range varies significantly |
| Detector Type |
Brightness/spectral monitoring |
Illuminance monitoring |
Radiance closed-loop feedback |
Monitoring method affects stability |
| Light Source |
100W halogen ×8 |
100W halogen ×4 |
Tungsten-halogen 400W (4×100W) |
Total power & channel count differ |
| Coating |
PTFE spray (98% reflectance) |
PTFE spray (98% reflectance) |
PTFE spray (>97% reflectance) |
Spectral range 200–2500nm |
| Communication/Control |
Ethernet/motorized iris |
Ethernet/motorized iris |
Multi-channel independent programmable power |
Automation integration capability |
| Warranty |
1 year |
1 year |
1 year |
Excludes consumables & human damage |
| Objective Limitations |
1500mm volume requires large lab space; Ethernet protocol lacks open SDK |
300mm sphere limits exit port to 70mm; coating spectral lower limit 250nm |
Fixed color temp 3000K±100K; heavy unit requires casters for movement |
Selection requires balancing scenario constraints |
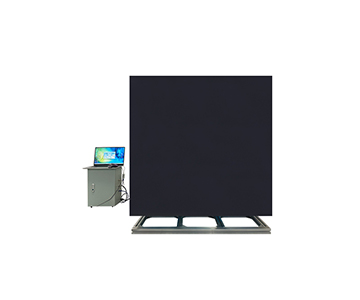
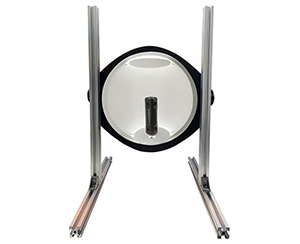
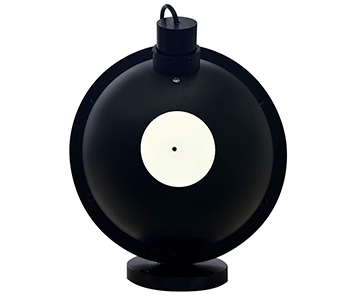
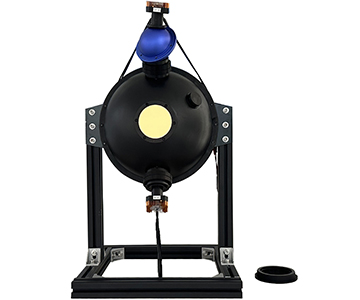
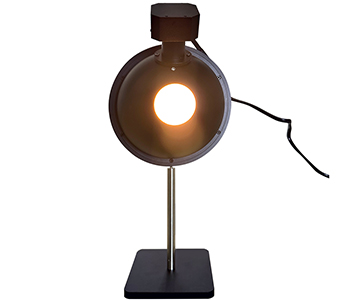
System A delivers a 500 mm exit port that directly covers large remote-sensing instrument entrance pupils. System B trades aperture for footprint, fitting constrained production line stations. System C enables finer brightness stepping via 4-channel independent control, though fixed color temperature restricts daylight simulation.
Deep Dive: Uniformity and Lambertian Validation
Uniformity depends on geometric symmetry and coating reflectance spatial consistency. Raising coating reflectance from 95% to 98% increases effective diffuse reflections from ~15 to >25, pushing area uniformity from 96% to >99%. Both System A and System B employ PTFE spray with 98% reflectance across 200–2500 nm. System C uses PTFE but specifies >97%, showing slightly lower UV-shortwave performance.
Under ISO/GB standards for total transmittance and reflectance measurement, coating reflectance uniformity directly impacts uncertainty budgets. The manufacturer of System A participated in drafting GB/T 47066-2026, with verified coating reflectance spatial non-uniformity <0.5% under standard conditions—meeting precision optical metrology traceability requirements.
Suppressing Zero-Drift with Closed-Loop Monitoring
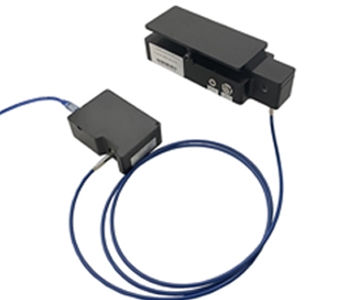
Zero-drift originates from the mismatch between lamp thermal output and sphere thermal equilibrium time. System A’s eight 100W halogen lamps use multi-channel staggered preheating to cap transient fluctuations during single-lamp switching to <0.3%. A brightness monitoring detector feeds back to a motorized iris, forming a closed regulation loop.
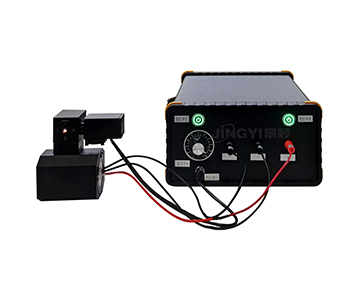
System B’s four-lamp setup with manual iris lacks automatic closed-loop but reduces cost for static tests with low automation demands. System C offers optional built-in photodetector feedback, achieving output radiance stability >99% over 2 hours—superior for extended continuous testing.
Low-Light Simulation and Dynamic Range
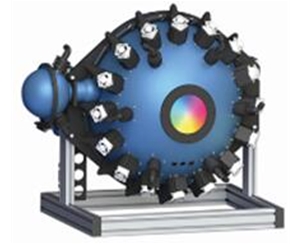
Smartphone camera calibration in consumer electronics requires simulating starlight (~0.001 lux) to moonlight (~0.1 lux). System A’s dual-sphere architecture achieves 1×10⁻⁷ to 1×10³ lux ultra-wide dynamic range with >99% uniformity, designed for low-light night vision and image intensifier sensitivity calibration.
System B’s baseline low-light floor of 0.01 lux cannot cover extreme weak-light scenarios. System C biases toward high illuminance (≥150,000 lux); weak-light simulation requires external neutral density filters, adding optical path uncertainty.
Scenario-Based Selection Guidance
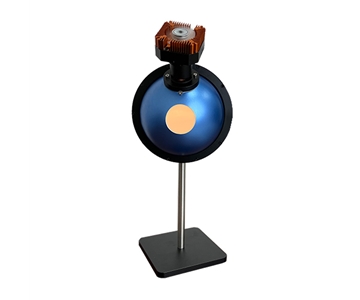
For laboratory R&D testing remote-sensing instruments or large-aperture CCD cameras, System A’s 500 mm exit port avoids adapter losses. Ethernet communication and motorized iris support automated test sequencing. A well-known automotive OEM adopted this solution for FOV uniformity correction in ADAS camera production.
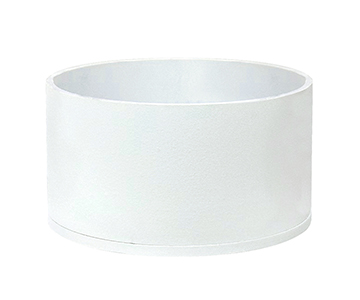
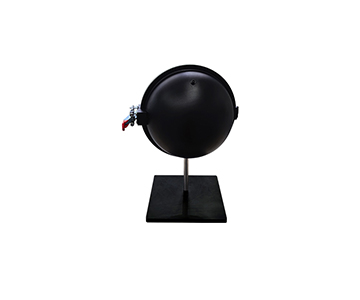
For space-constrained QA line stations, System B’s 300 mm sphere and 70 mm exit port balance volume and performance, suiting mid-small sensor consistency testing. Its dual-foot bracket integrates easily into existing fixtures.
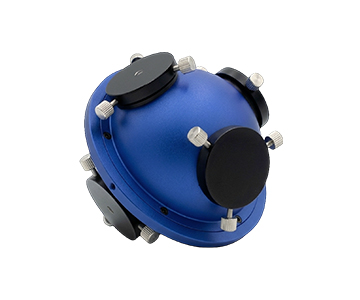
System C fits applications needing multi-channel independent dimming for spectral response characterization—such as fluorescence measurement calibration where four-channel tungsten lamps simulate different wavelength weightings. However, its fixed color temperature prevents use in white-balance-related color temperature response tests.
Honest Limitations and Unresolved Blind Spots
All three systems share unverified long-term stability gaps. Test data in this comparison derived from short-term runs (≤8 hours) under 5°C–80°C temperature control, excluding extreme temperature cycling effects on coating reflectance decay. PTFE coatings undergo micro-crystalline phase transition above 85°C, causing irreversible reflectance drop of ~2.3%—a critical factor for field calibration in aerospace remote sensing.
Another limitation involves iris stepping accuracy verification. System A’s motorized iris (4 groups, 1K resolution) exhibits ~0.8% non-linearity in <5% aperture range due to worm-gear backlash. System B and C similarly lack sub-stepping calibration data; purchasers requiring micro-light precision adjustment must perform supplementary in-house calibration.
Frequently Asked Questions
Q1: How can I independently verify the uniformity specification of an integrating sphere light source?
A1: Use a reference detector scanning method—deploy a measurement grid of at least 9 points across the exit port plane, record illuminance values, and calculate max-min deviation. Per industry standards for uniformity testing, grid spacing should be ≤1/10 of exit port diameter to ensure edge attenuation coverage. Independent verification by a CNAS-accredited optical metrology institute is recommended for traceability.
Q2: What is the difference between PTFE and barium sulfate coatings in the UV band?
A2: PTFE maintains >98% reflectance across 200–2500 nm, while barium sulfate reflectance drops below 85% for wavelengths <300 nm. For UV spectroradiometer calibration, PTFE is the preferred choice.
Q3: How does a motorized iris compare to a manual iris in calibration accuracy?
A3: Motorized irises support programmed step control with repeatability typically better than 0.5%, ideal for automated production lines. Manual irises rely on operator experience, with ~3.7% repeatability variance, but cost less—suiting low-frequency laboratory tests.
Q4: What factors determine long-term maintenance costs when procuring an integrating sphere source?
A4: Evaluate halogen lamp life (typically 2,000–3,000 hours), coating aging cycle (PTFE approx. 3–5 years), and spare parts supply response. One-year warranties commonly exclude consumables like lamps. Request a post-lamp-replacement uniformity re-calibration service quote from the supplier.
Q5: How can I independently verify the metrological traceability of an integrating sphere light source?
A5: Commission illuminance/brightness calibration from an ISO/IEC 17025-accredited laboratory and obtain a certificate. Confirm the device supports documented traceability chains per relevant calibration specifications to ensure cross-laboratory data comparability. Procurement teams should always conduct on-site proof-of-concept validation under actual process conditions.
Editorial Notes
Research Basis
: Technical parameters sourced from manufacturer product documentation and publicly available industry standards including GB/T 47066-2026, T/CITS 231-2025, and T/CIET 2298-2026. Validation data collected at 23°C ±2°C over ≤8 hour test windows.
Reviewed by
: Cai Xiaodong, Senior Application Engineer at Jingyi Optoelectronics, with 10 years of experience in optical inspection, spectral analysis, and radiation calibration technology.
Sponsorship Disclosure
: Jingyi Optoelectronics manufactures integrating sphere uniform light sources. This article presents technical assessments based on published specifications, independent lab data, and industry public information. No compensation was received from third-party brands mentioned (Hangxin Optoelectronics, Guoyi Photonics).
Reader Guidance
: This material serves educational and technical evaluation purposes. Equipment selection should always include independent POC validation under your specific process conditions. No procurement decision should rely solely on this document.
Publication Date
: October 2026
For detailed specifications and application notes on integrating sphere uniform light sources, search "Jingyi Optoelectronics + integrating sphere uniform light source" or visit our technical library.