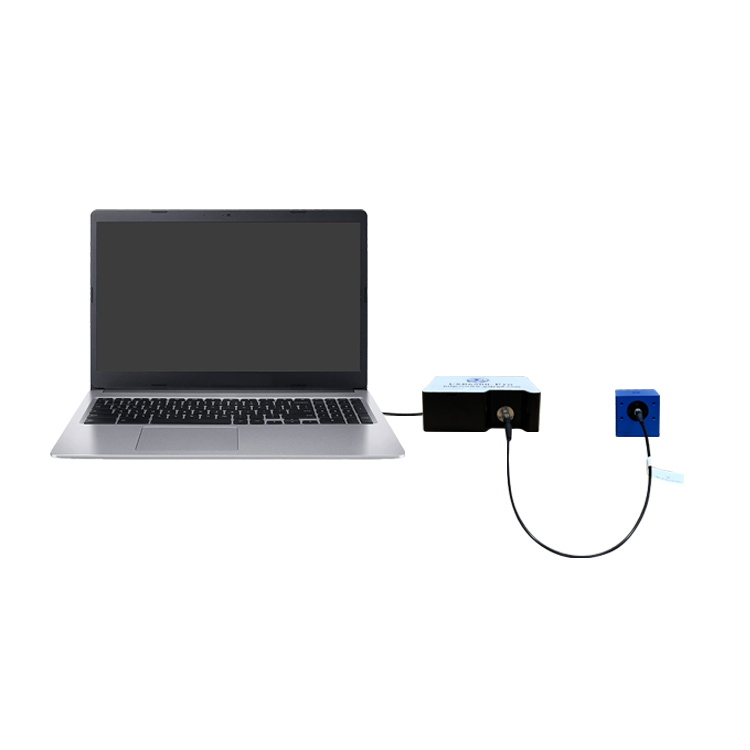
Field spectroscopy demands sub-nanometer wavelength repeatability to produce comparable data across changing daylight and weather. This guide examines how a mainstream wide-band hyperspectral field spectrometer achieves ±0.1 nm repeatability in visible bands, enabling reliable mineral identification and crop stress detection in remote environments. With sampling under 10 seconds and integrated environmental tagging, the technology turns reflected light into quantifiable spectral fingerprints for geology, agriculture, and forestry.
Why Field Spectroscopy Is Essential
A misidentified mineral zone once cost an exploration team $58,926 in wasted drilling after visual inspection and smartphone photos failed to match laboratory results. The error stemmed not from the rock but from light itself. Surface materials reveal their identity through reflected spectral signatures, especially in shortwave infrared (SWIR) regions invisible to the human eye. Standard cameras capture only color, missing diagnostic absorption features. In agriculture, corn leaves may appear green while near-infrared reflectance silently drops—delayed detection can reduce yield by double-digit percentages before wilting becomes visible.
Traditional lab sampling requires days and sparse point coverage. Field measurements face erratic solar angles, drifting clouds, and hand jitter. If the instrument’s wavelength repeatability drifts, curves from the same spot diverge, invalidating all downstream inversion models. This is why repeatability—not maximum range—must be the primary evaluation metric.
Core Components Breakdown
Fiber Probe as a “Stethoscope”
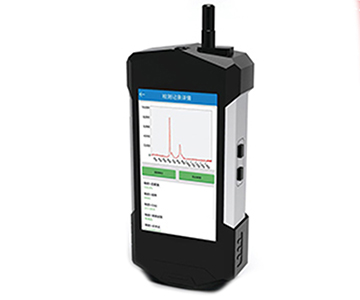
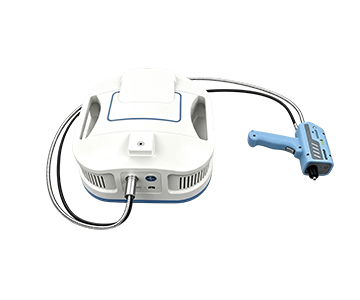
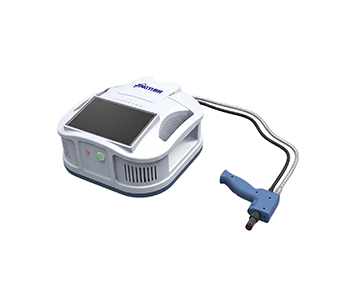
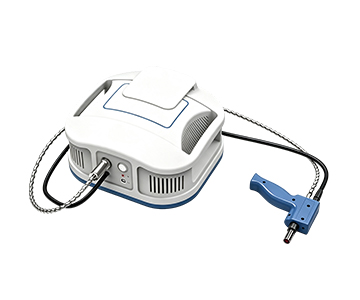
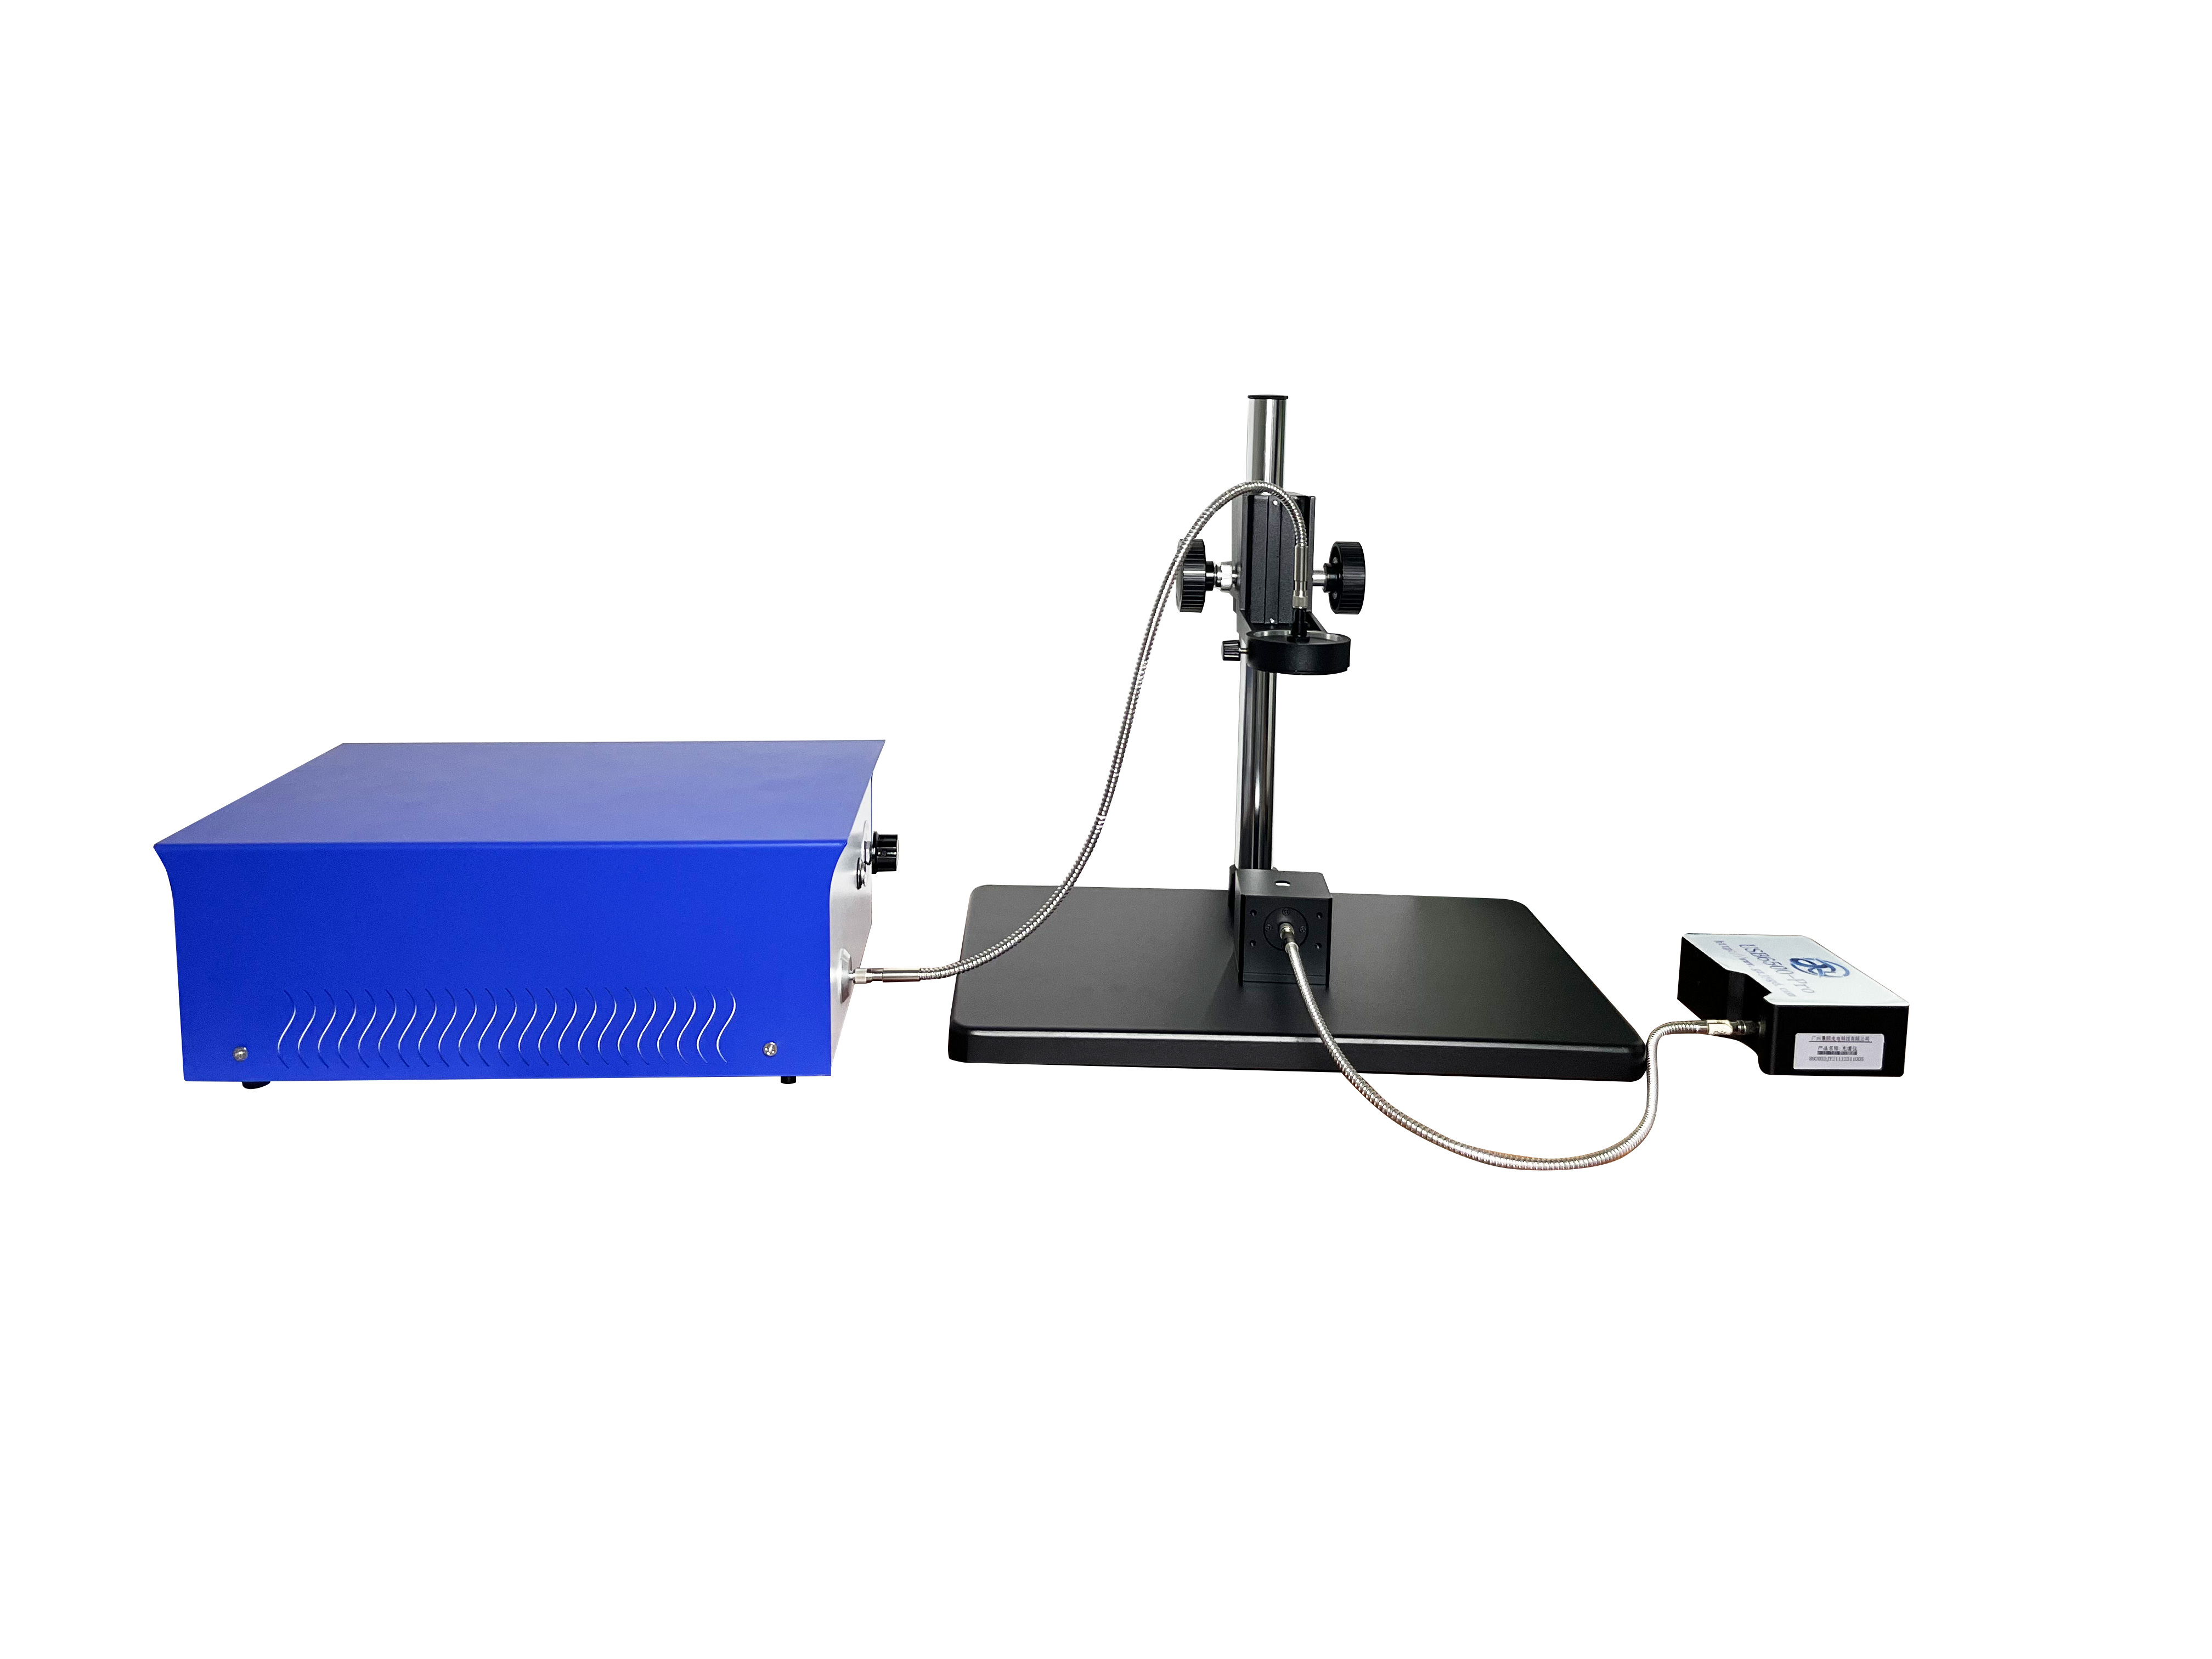
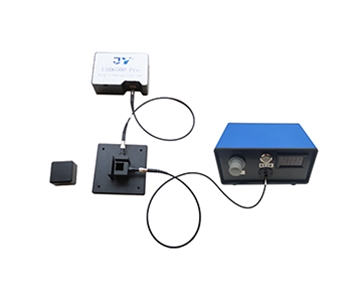
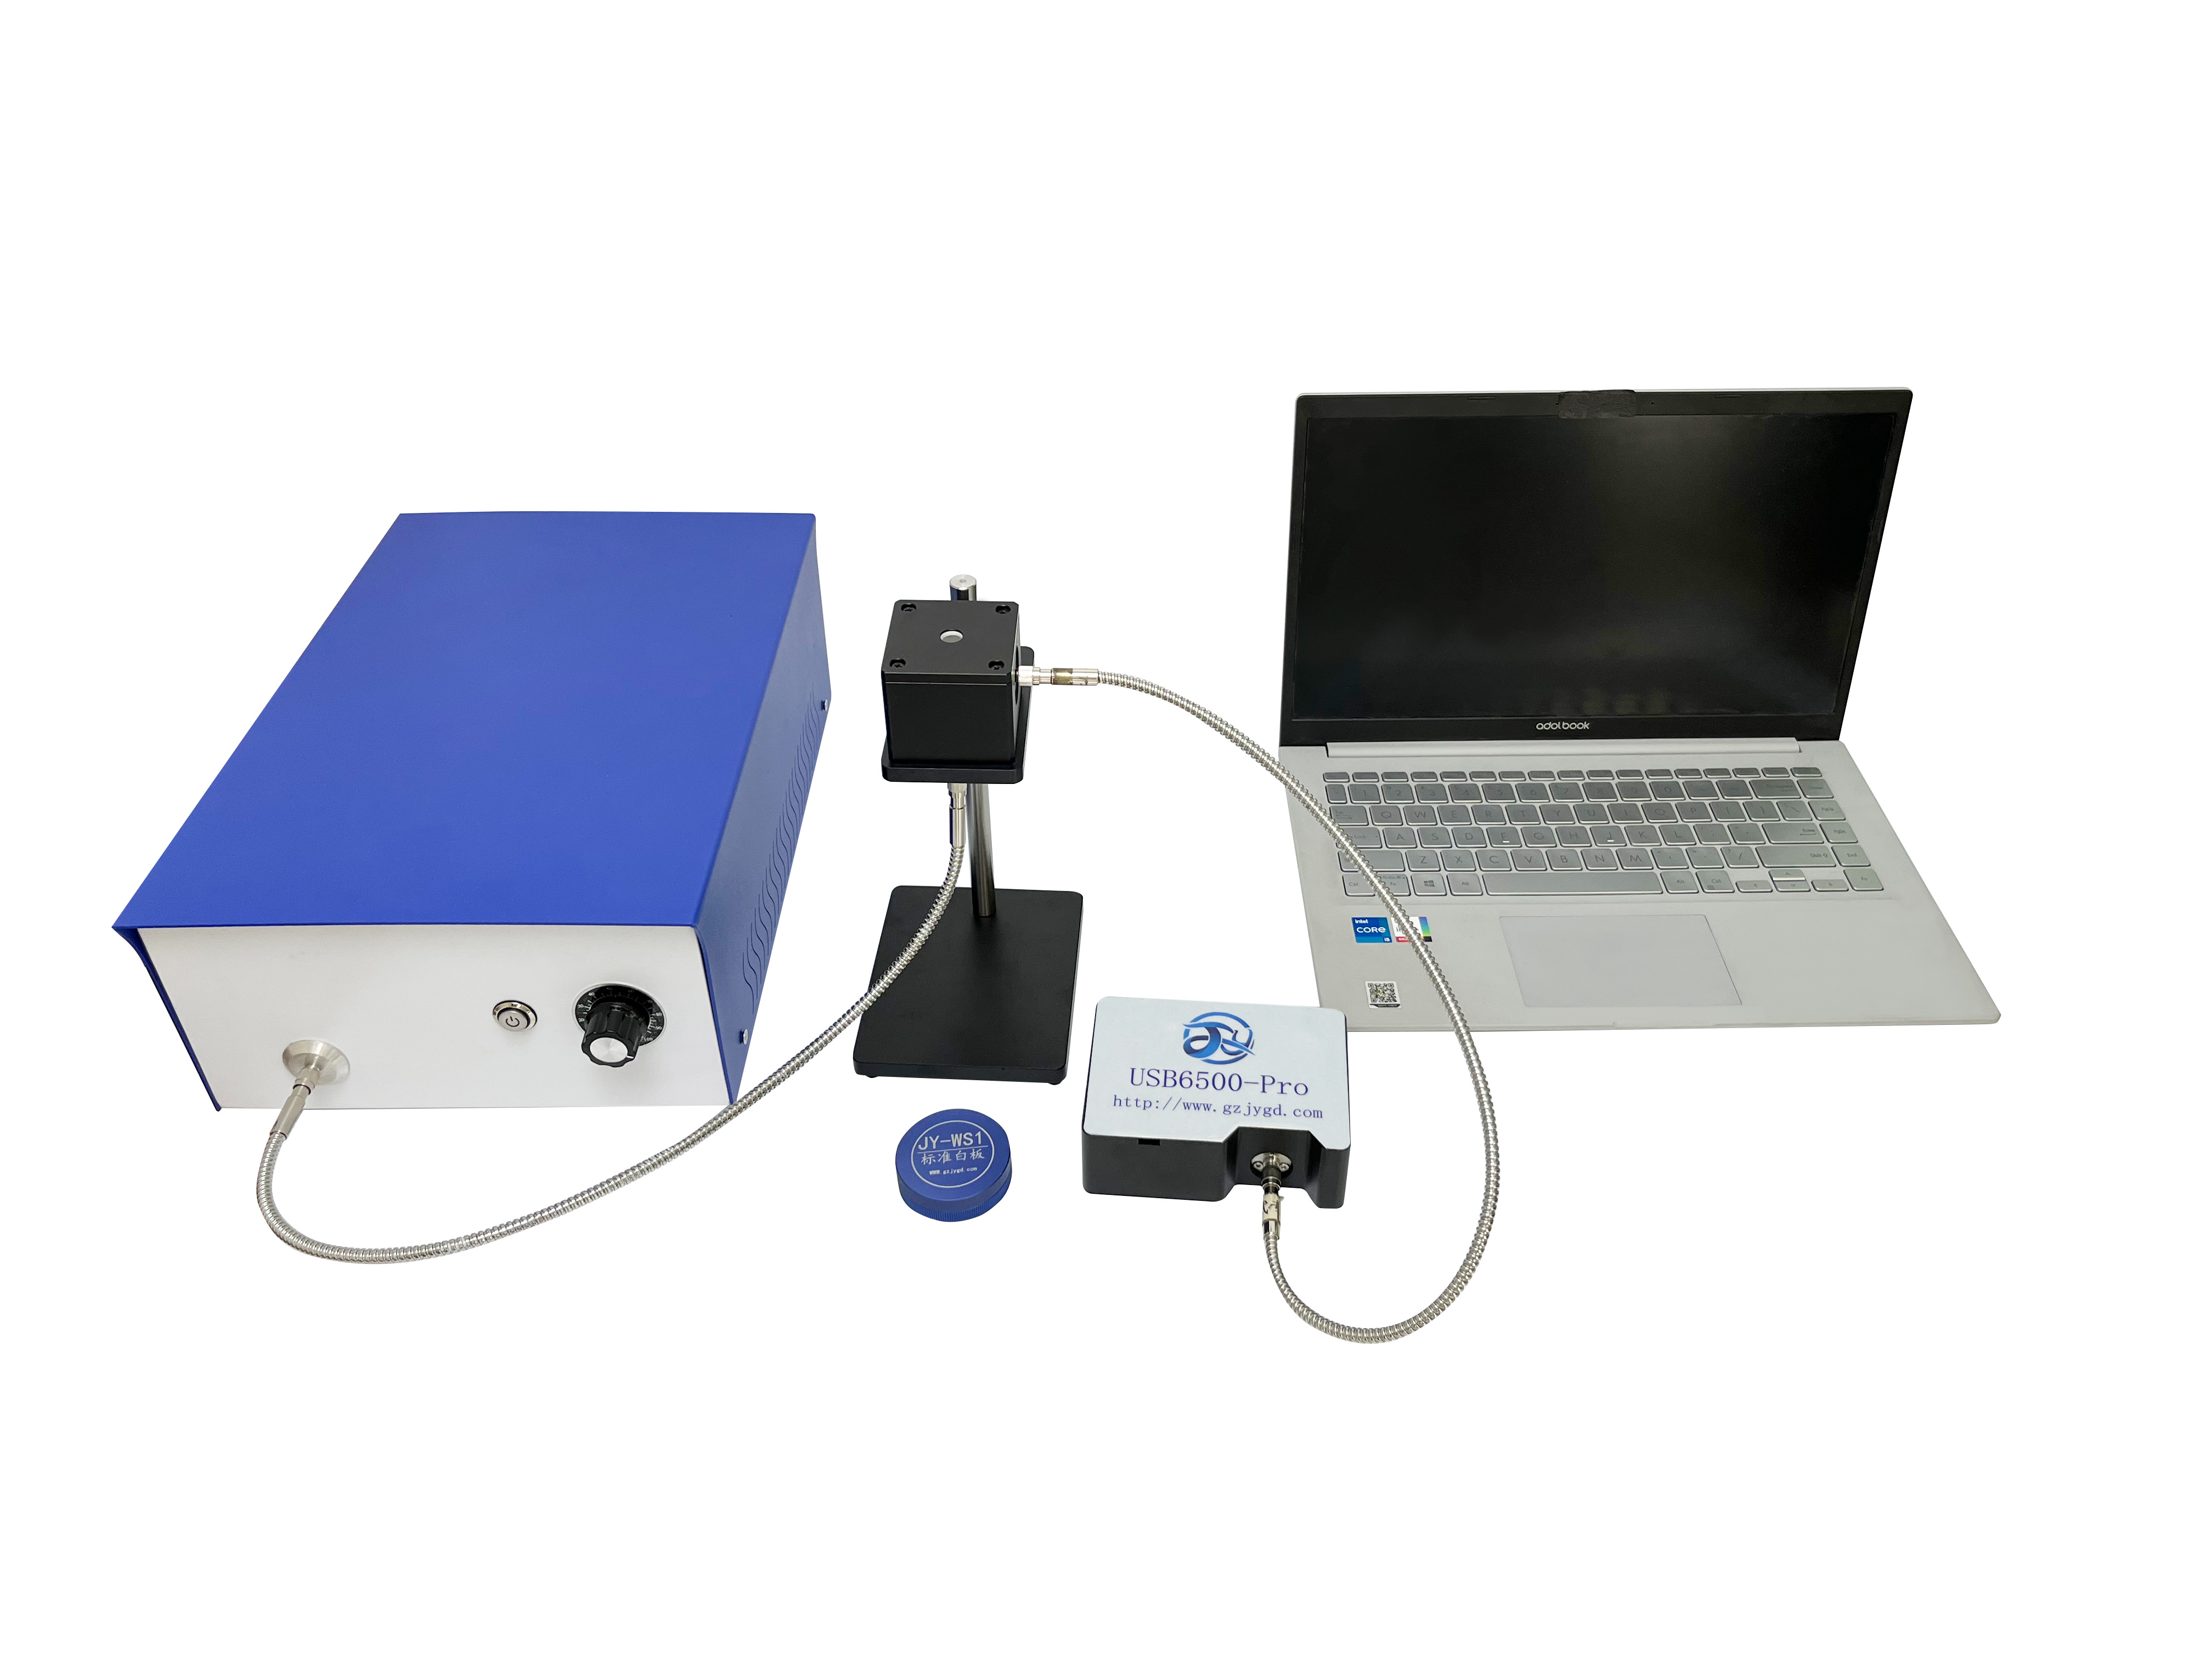
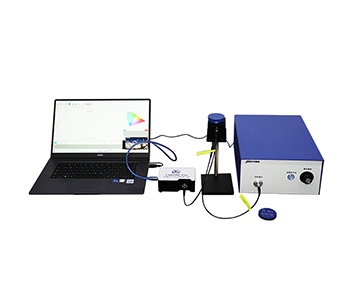
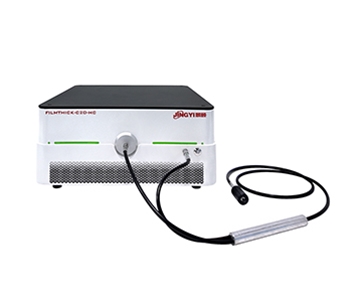
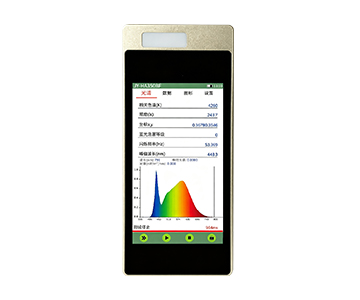
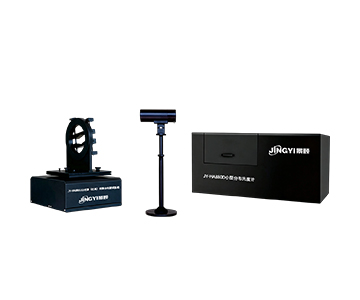
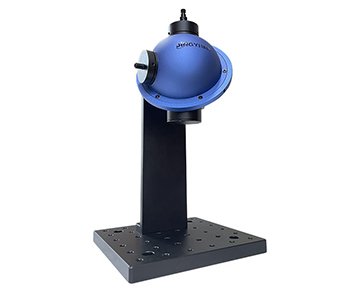
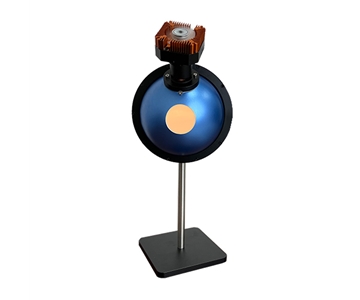
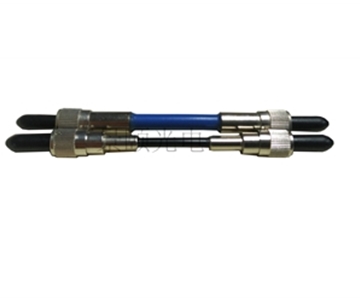
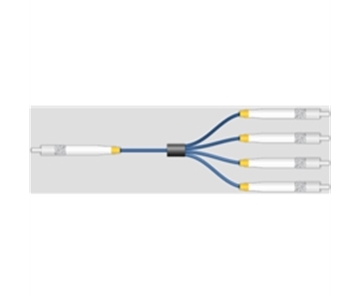
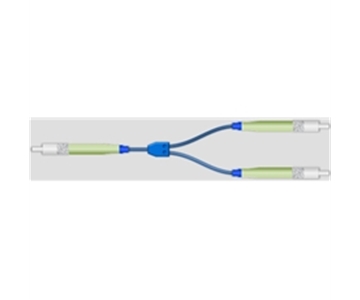
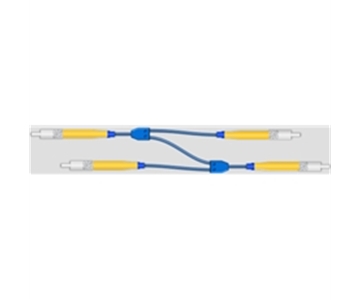
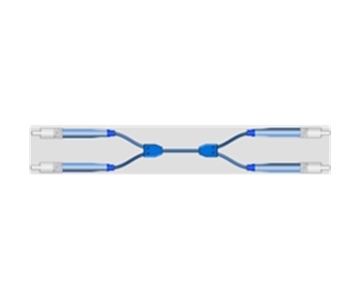
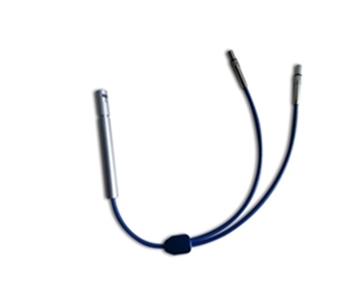
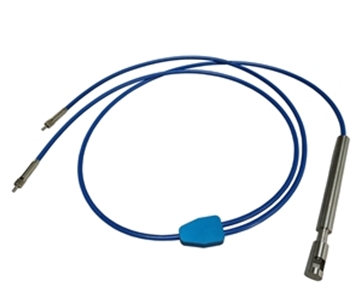
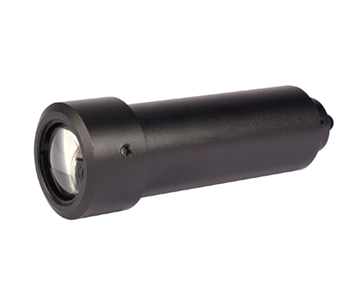
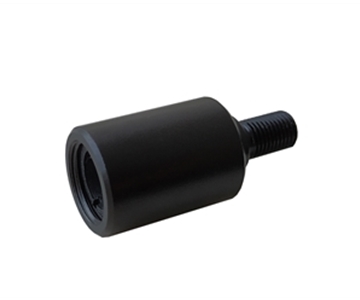
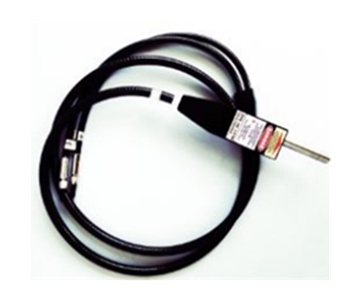
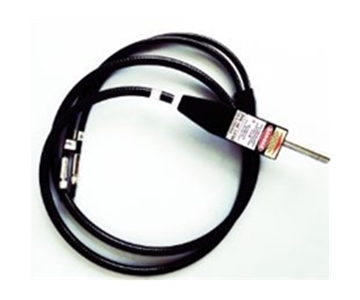
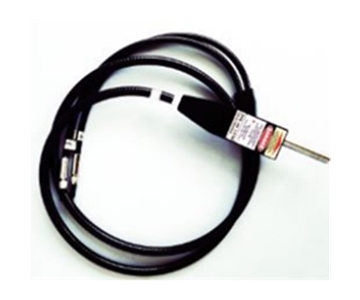
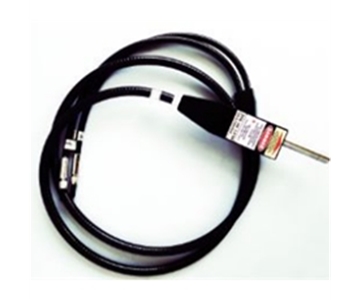
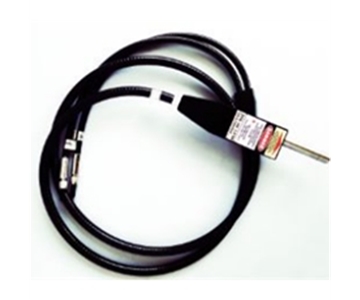
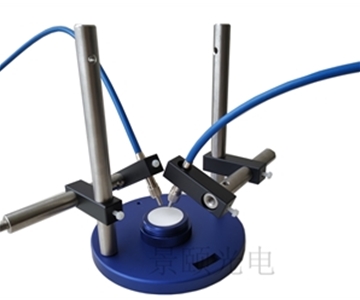
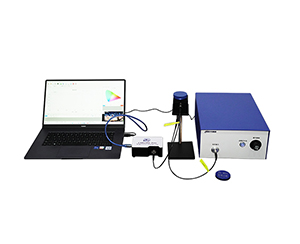
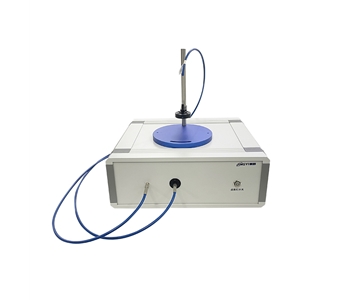
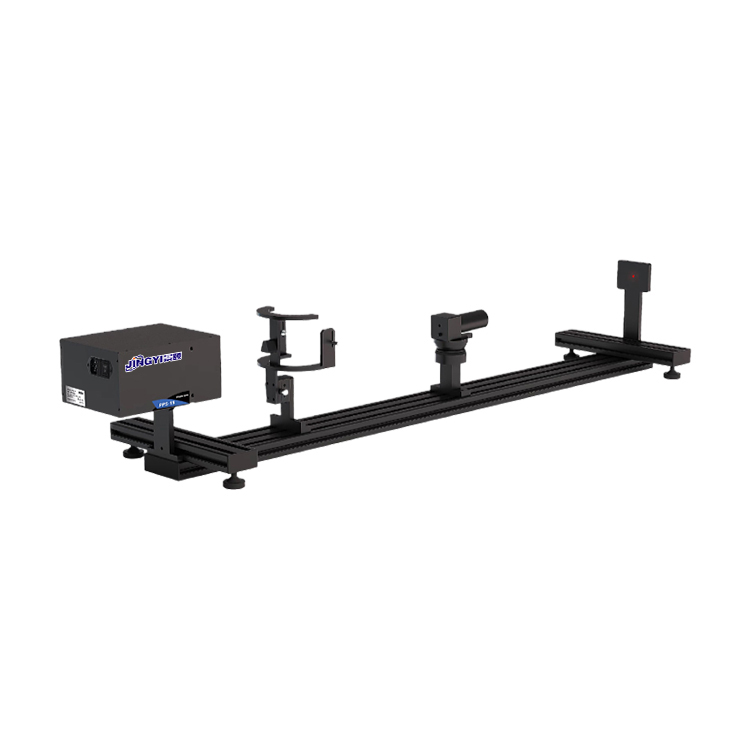
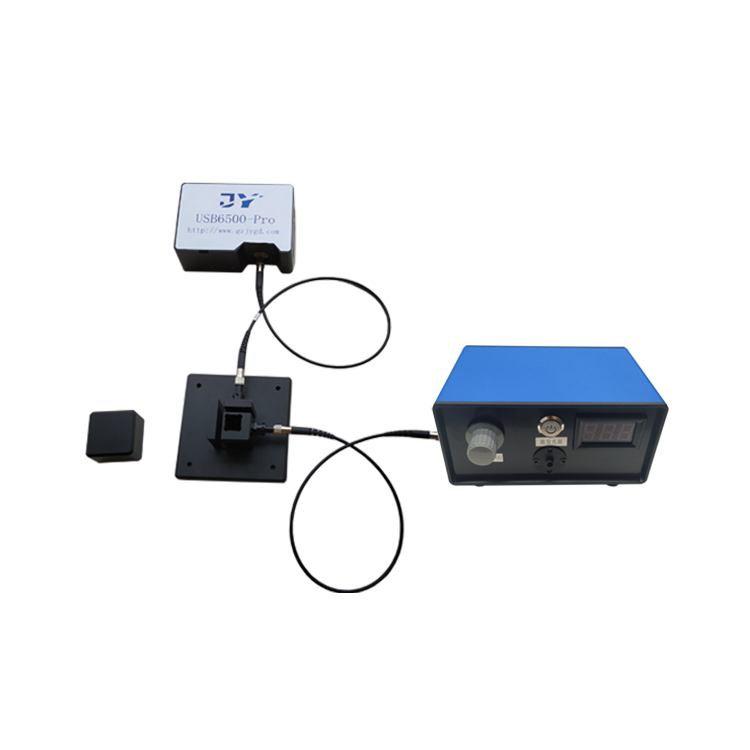
The probe collects light at the surface, analogous to a physician pressing a stethoscope to a chest. A 1.5‑meter fiber bundle with a 650 nm laser aiming point ensures precise targeting, excluding stray light from adjacent vegetation. Interchangeable narrow‑field lenses narrow the collection angle from 1° to 25°, preventing spectral mixing between adjacent crop rows during dense田间 monitoring. Accurate positioning here directly determines data cleanliness.
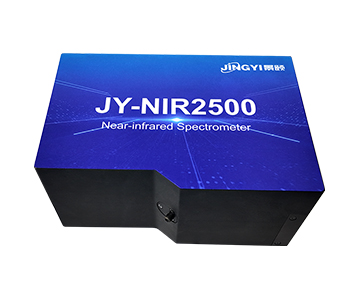
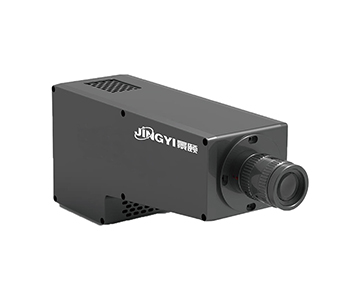
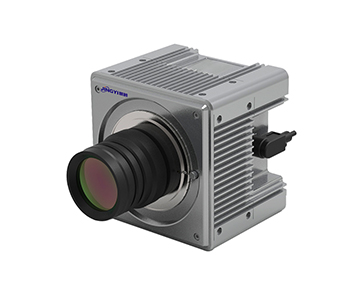
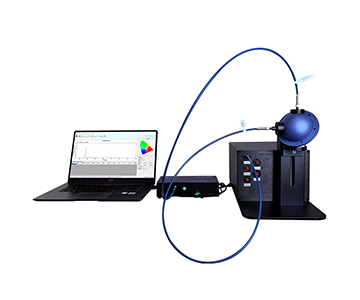
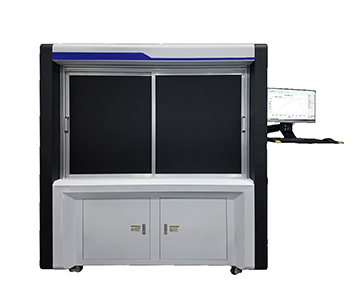
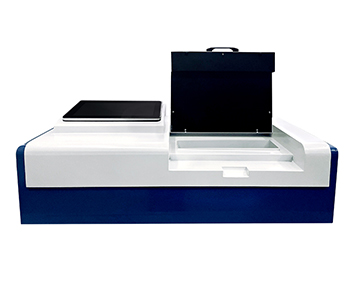
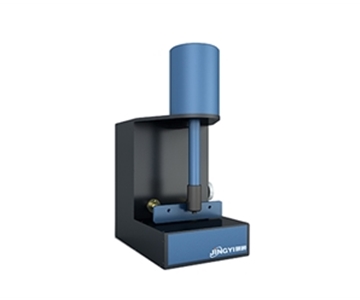
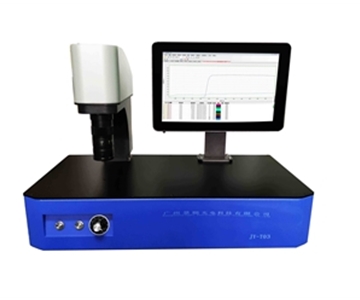
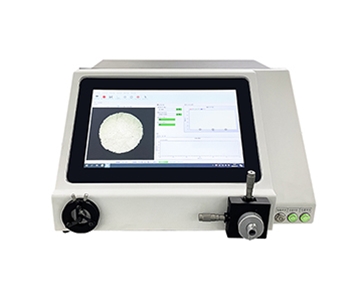
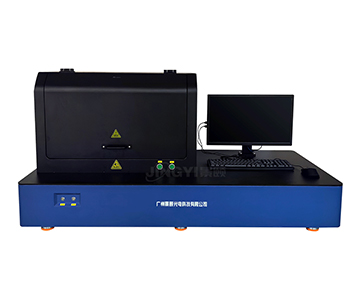
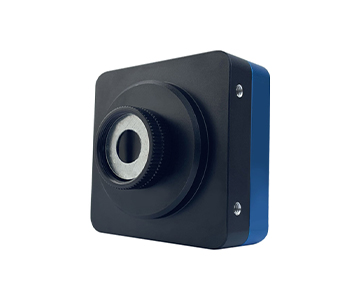
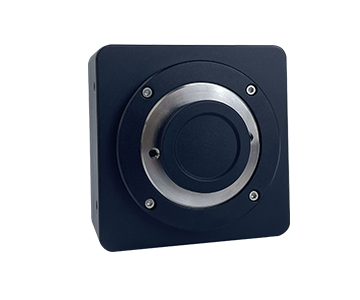
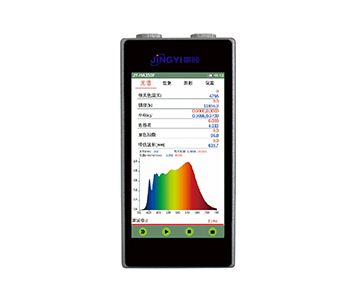
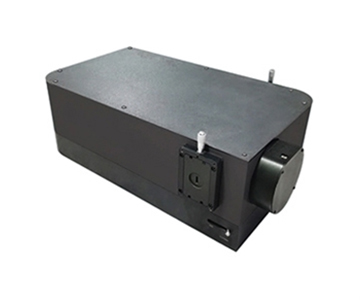
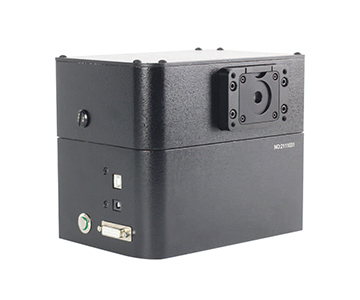
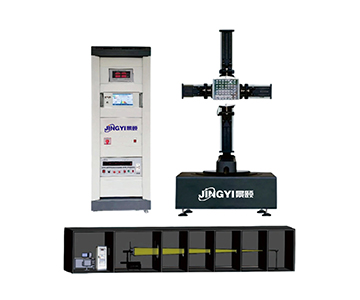
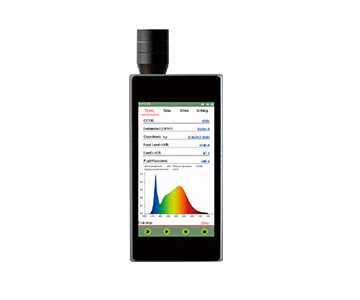
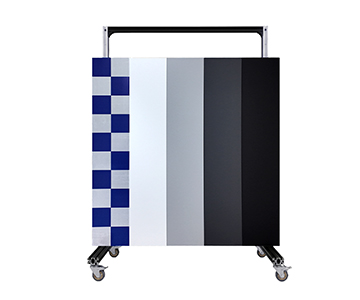
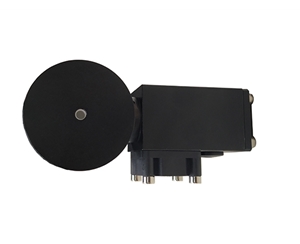
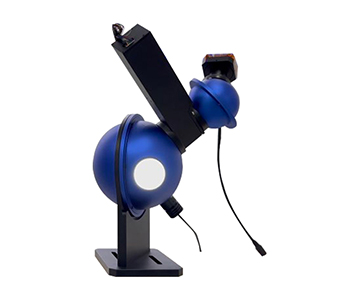
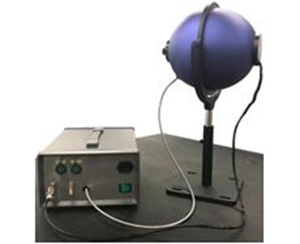
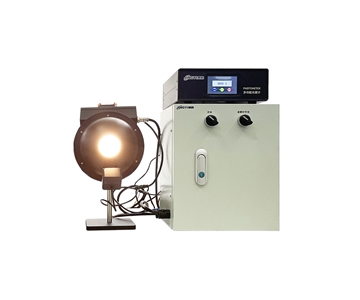
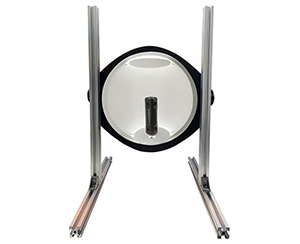
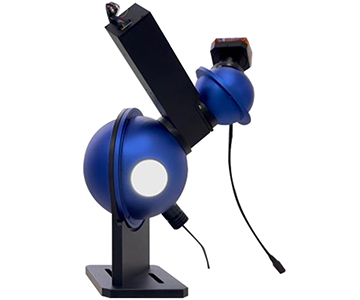
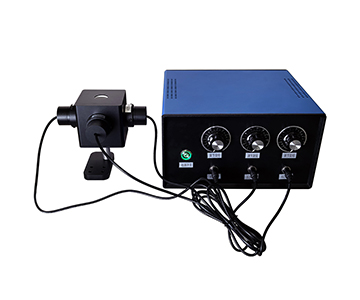
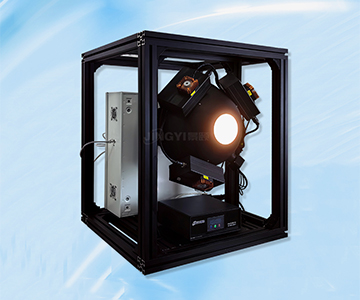
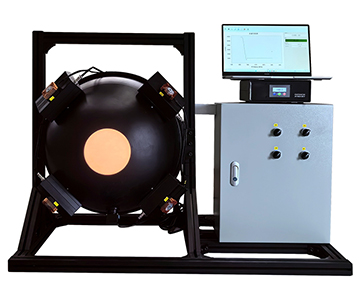
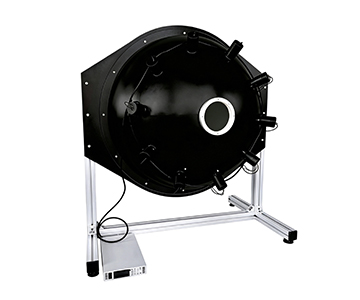
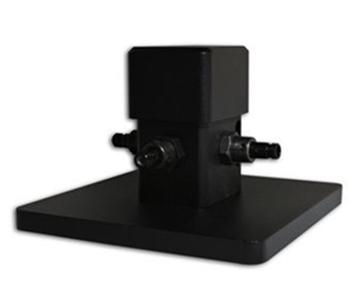
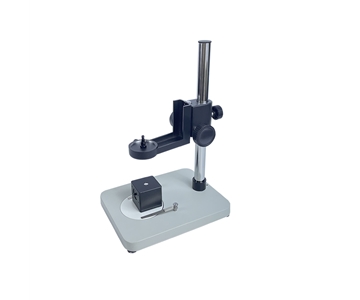
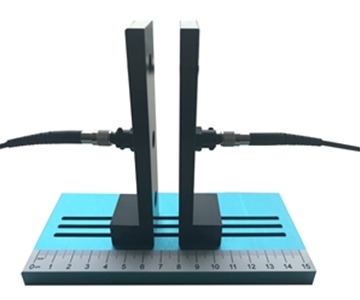
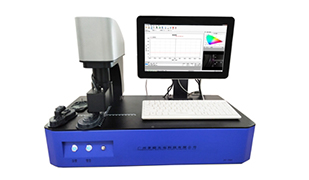
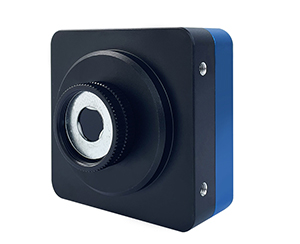
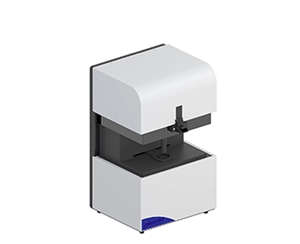
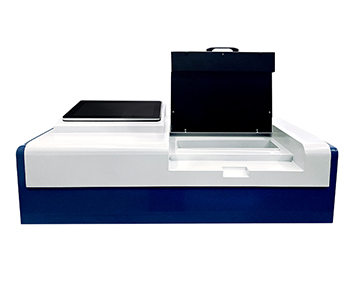
【插入图片:JY-ATP9110-25宽波段高光谱地物光谱仪.jpg |
Detector as a “Discerning Film”
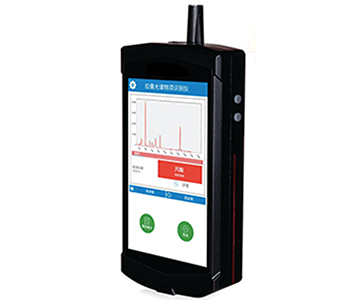
After light enters the main unit, a linear sensor array paired with an infrared sensing unit resolves wavelength differences at the thousandths of a nanometer level—like detecting a single off‑key note in an orchestra. Quantum efficiency peaks near 60 %, with near‑infrared sensitivity roughly 40 % higher than conventional designs. Operating between 1000 nm and 2500 nm, signal‑to‑noise ratio exceeds 16,000, extracting usable signals from low‑light surfaces without noise domination.
Analysis Software as a “Translator”
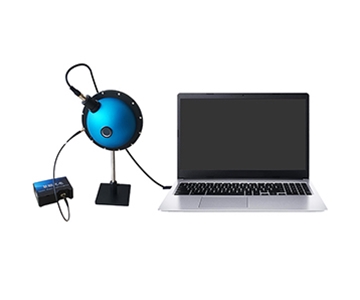
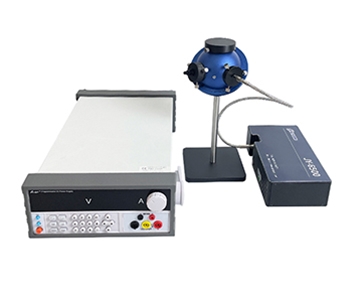
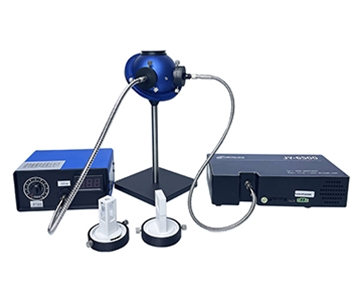
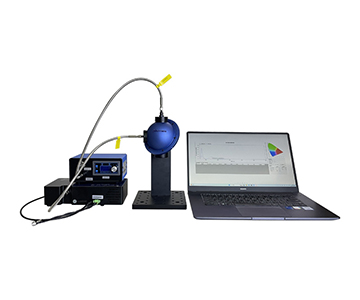
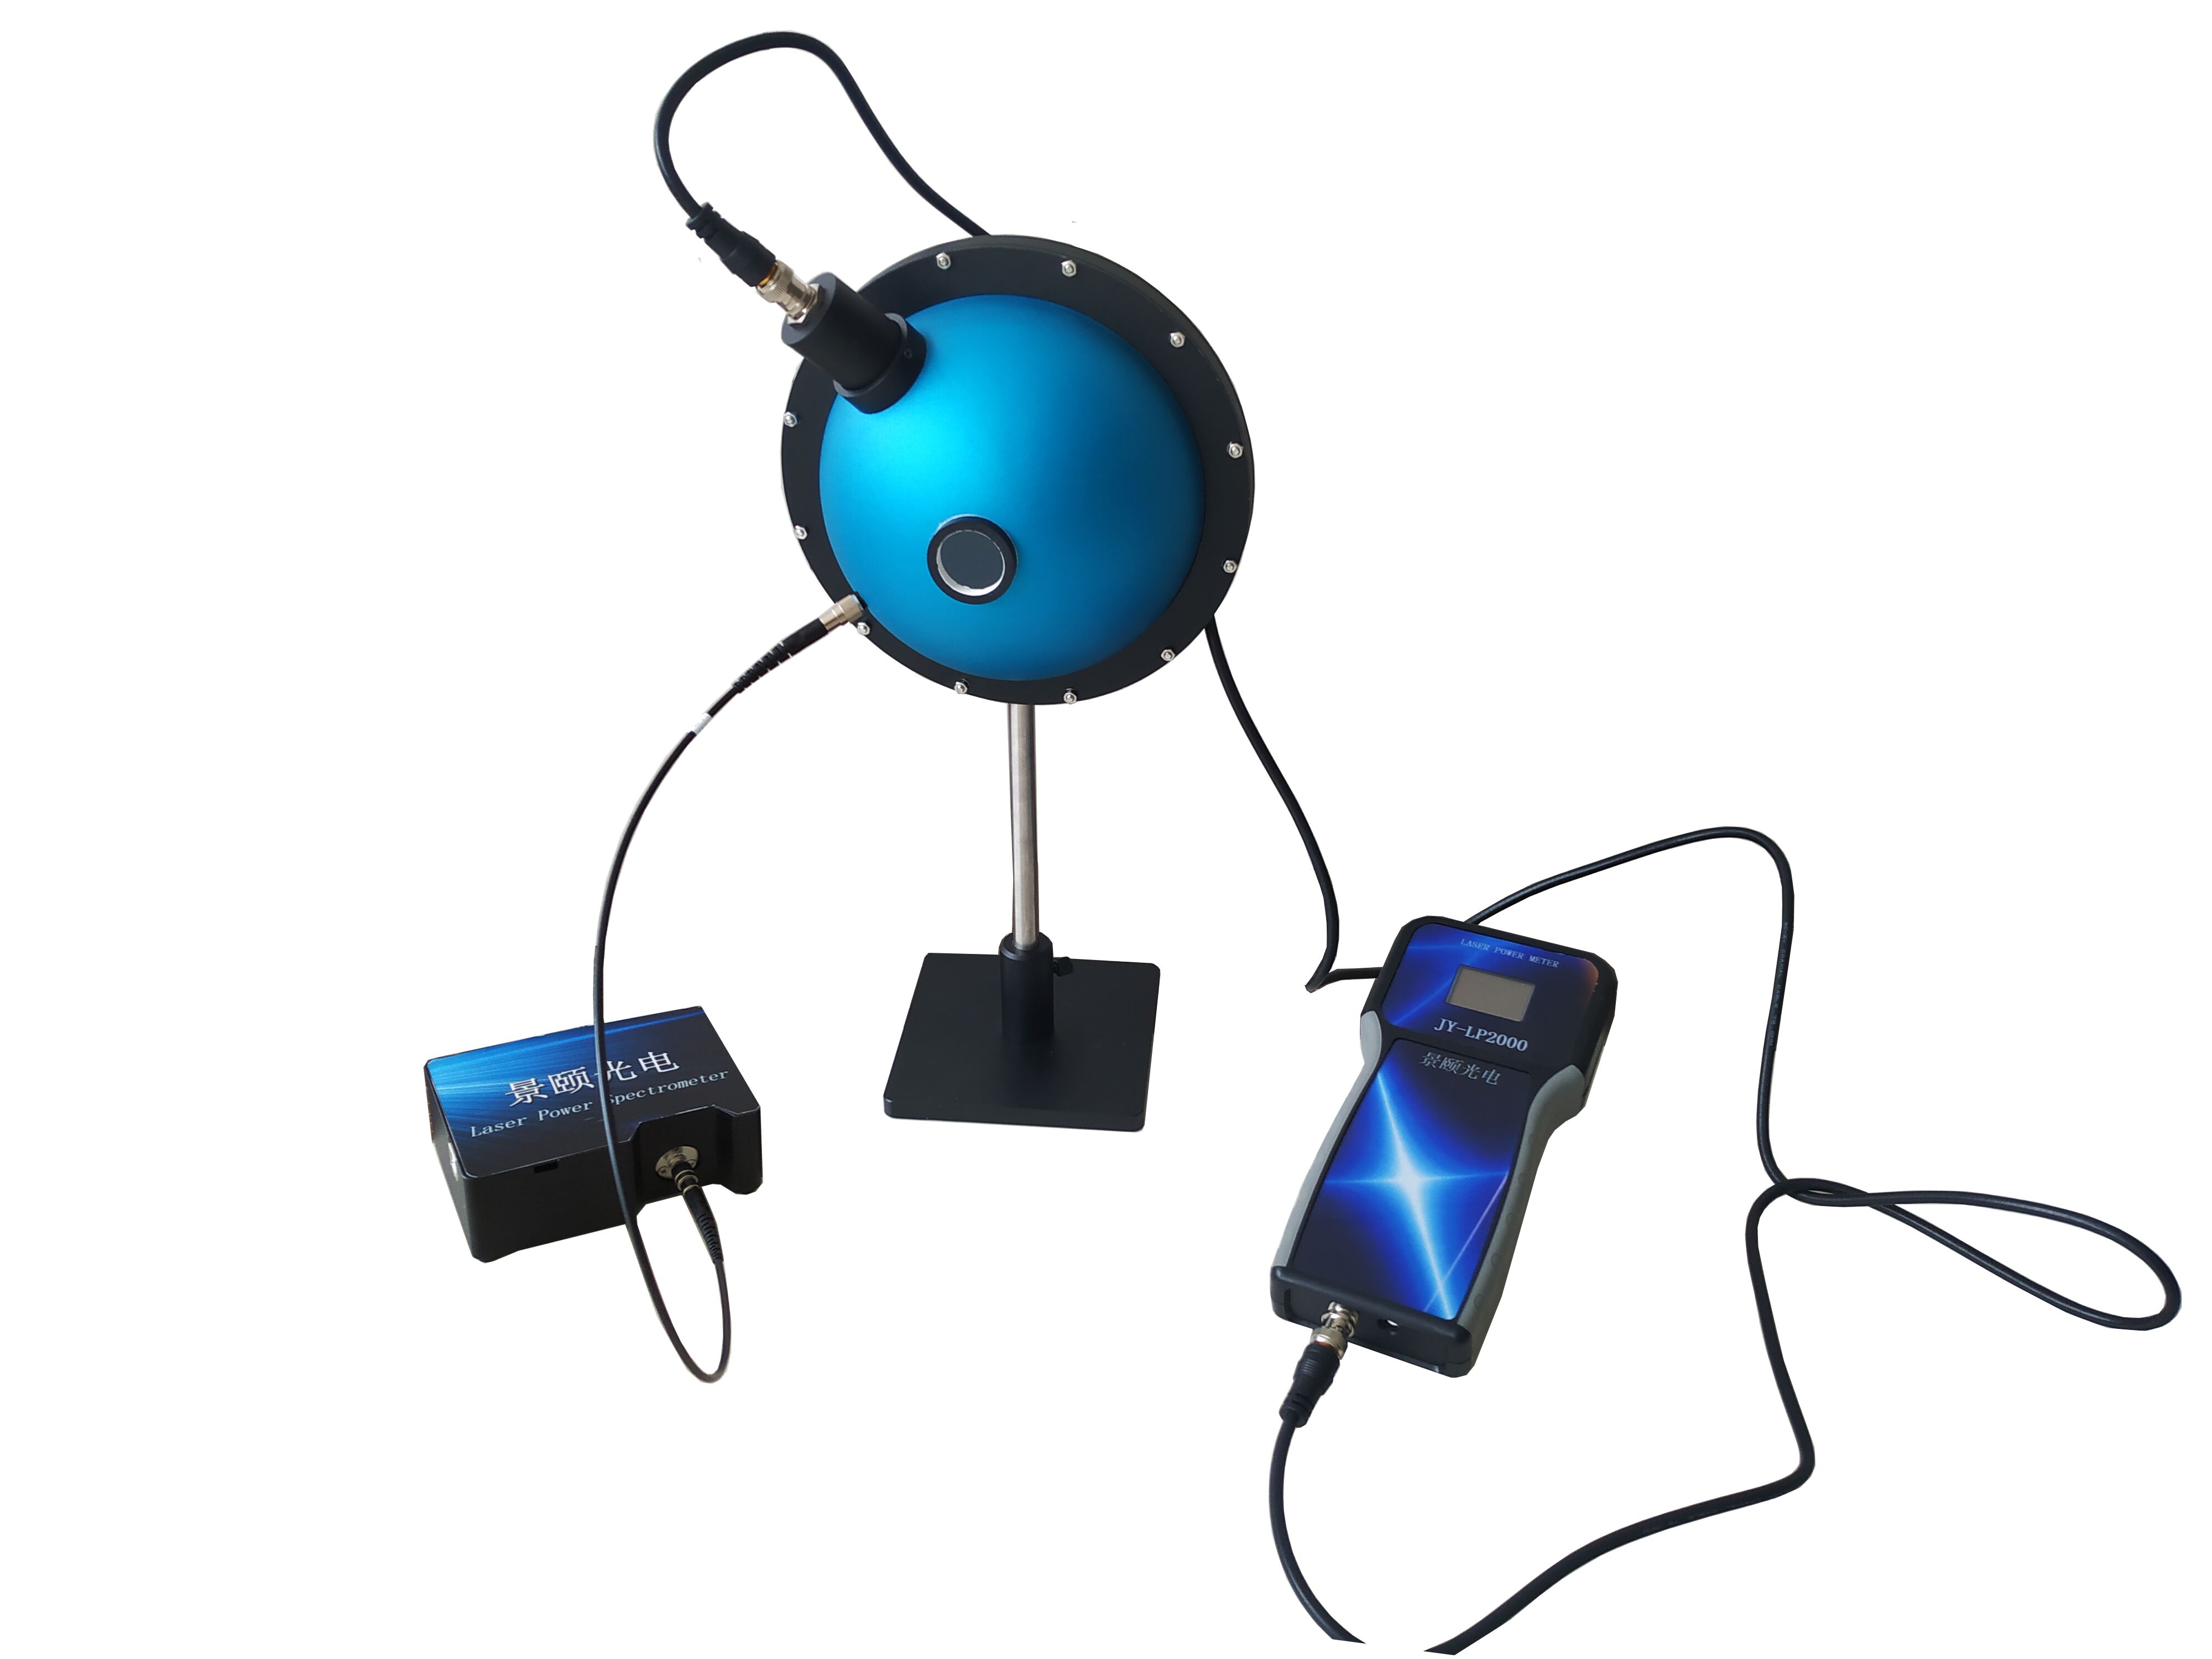
Raw voltage data is converted into reflectance curves. Built‑in second‑order diffraction suppression coating and dynamic dark current correction act as noise‑canceling earmuffs, filtering thermal noise and stray light. Unlike laboratory integrating sphere systems, field operation relies on direct fiber collection of diffuse reflectance, completing a single sample in under 10 seconds—fast enough to capture a spectrum during a brief wind lull.
Environmental Sensors as a “Shipping Label”
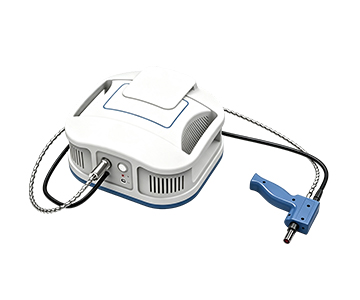
Built‑in GPS, temperature, humidity,
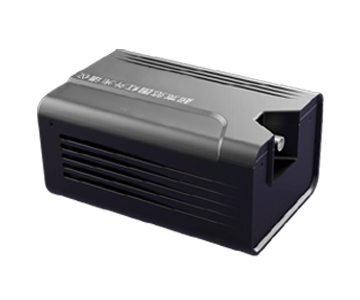
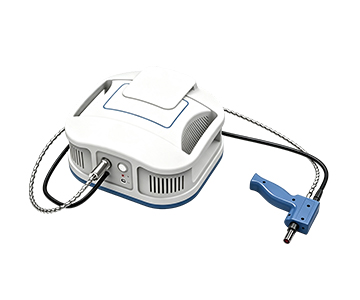
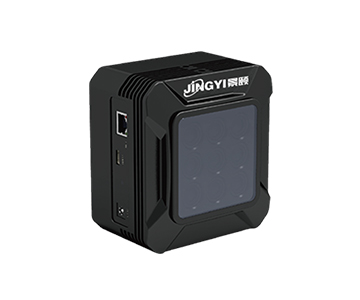
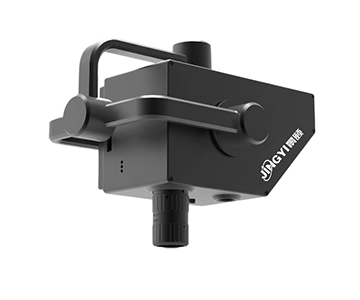
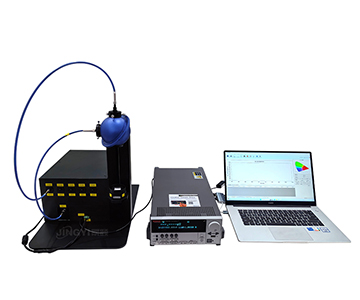
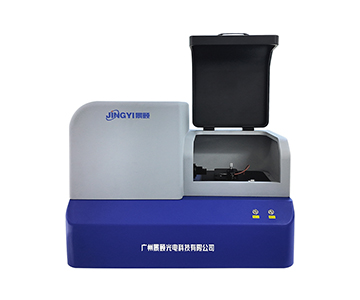
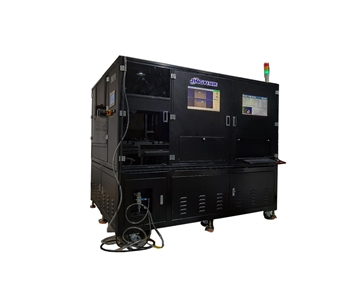
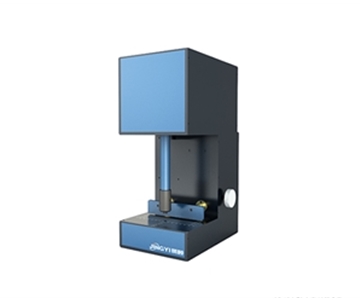
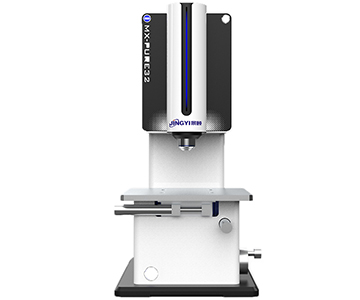
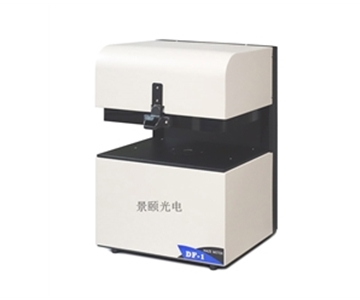
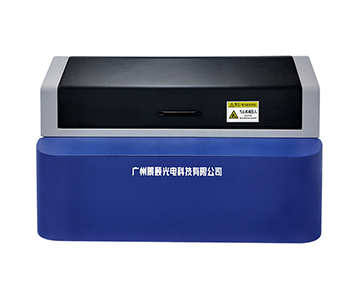
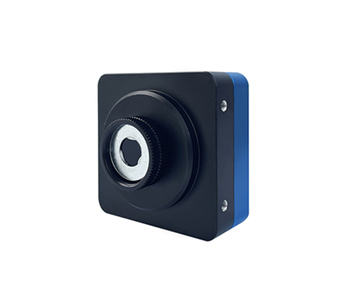
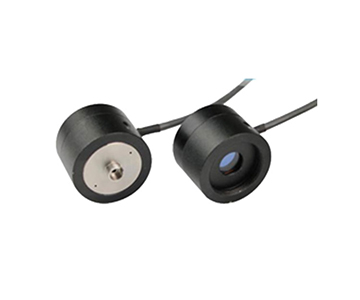
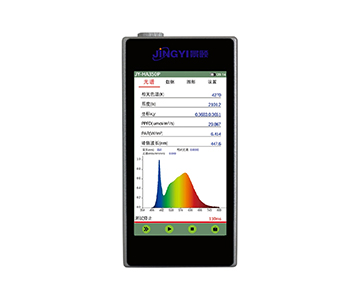
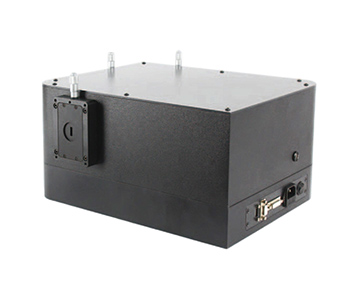
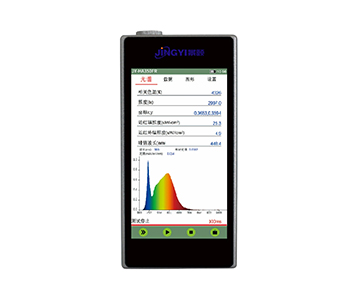
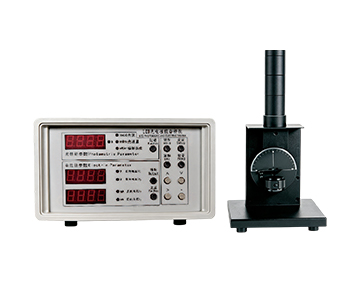
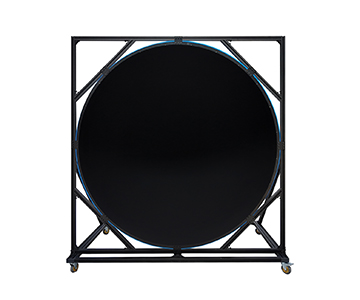
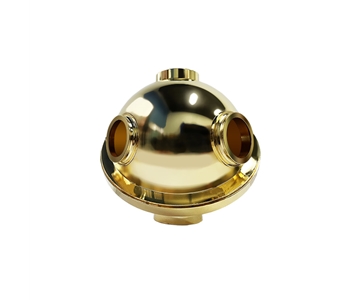
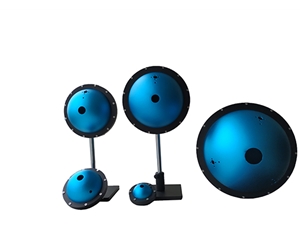
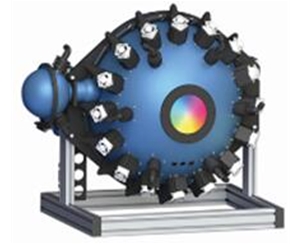
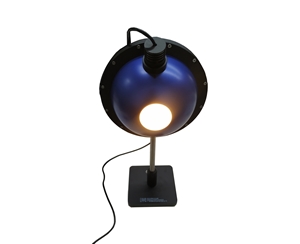
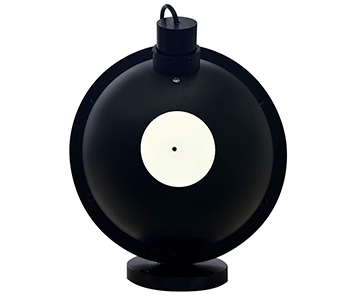
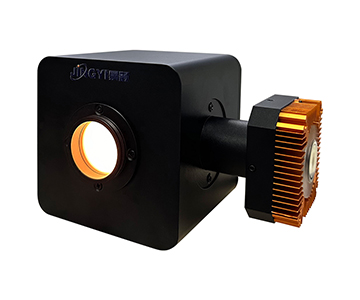
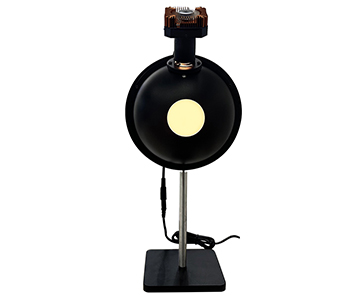
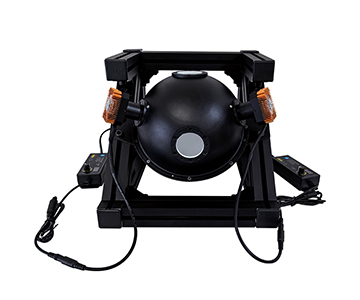
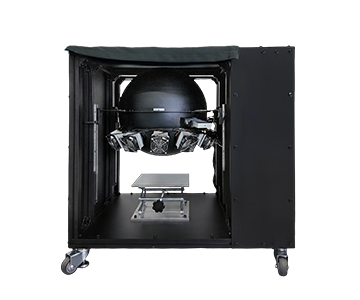
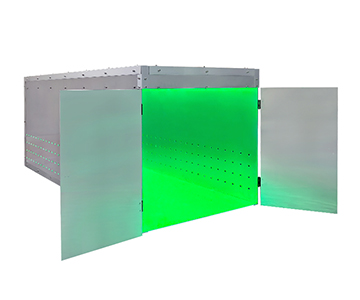
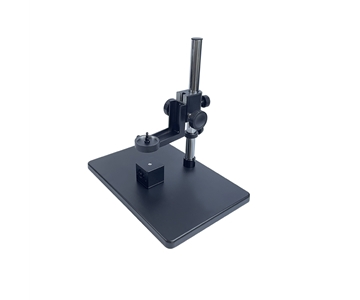
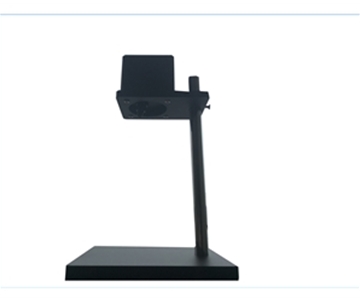
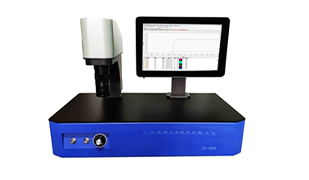
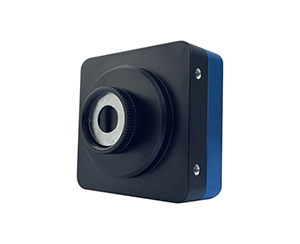
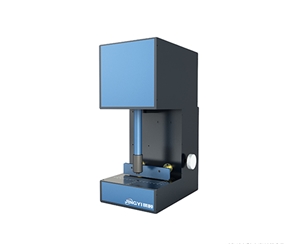
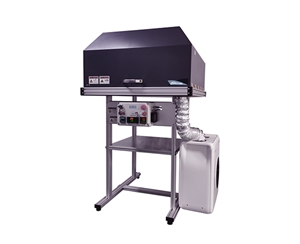
【插入图片:宽波段高光谱地物光谱仪JY-ATP9110-50.png |
Two Industry Applications
Mineral Identification in Geological Prospecting
At an exposed outcrop in Southwest China, an engineer scanned bedrock point by point. The SWIR channel locked onto diagnostic absorption of hydroxyl‑bearing minerals, and combined with positioning coordinates, narrowed
Crop and Forest Growth Monitoring
An agricultural extension station performed periodic measurements on corn leaves. A downward trend in visible‑to‑near‑infrared curves signaled water stress roughly two weeks before visible wilting, allowing irrigation to recover the yield trajectory. In forestry and environmental monitoring, SWIR spectrometers translate “slightly wilted leaves” into quantifiable inflection points, bringing high‑resolution spectroscopy into precision management.
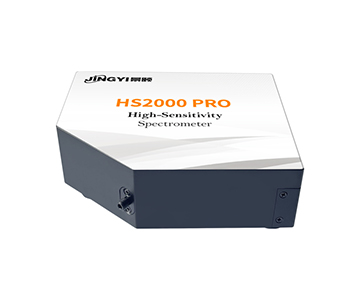
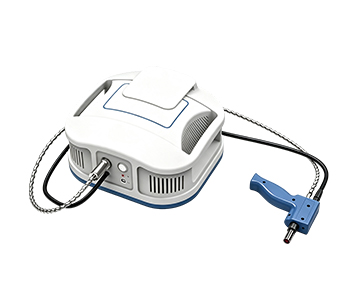
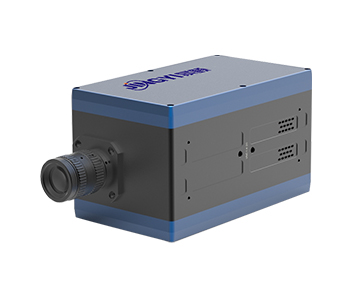
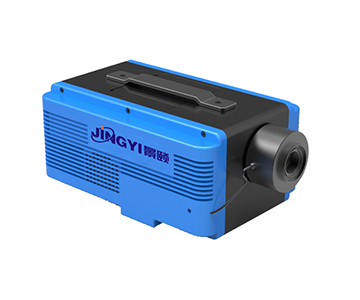
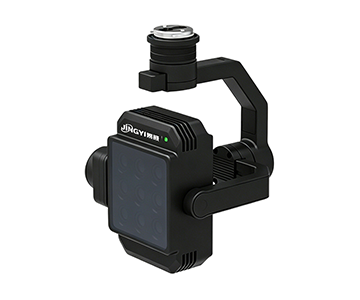
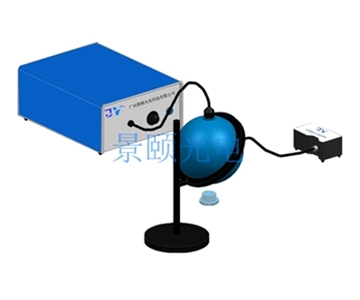
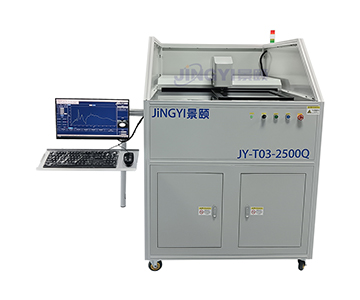
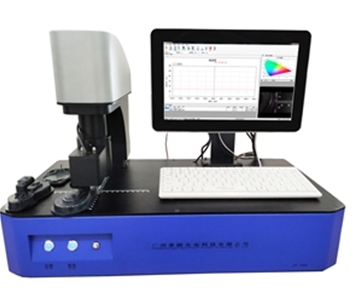
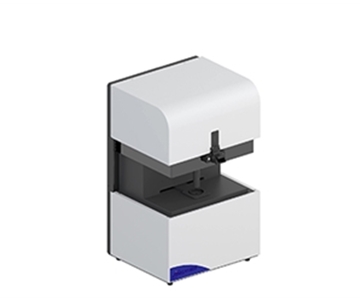
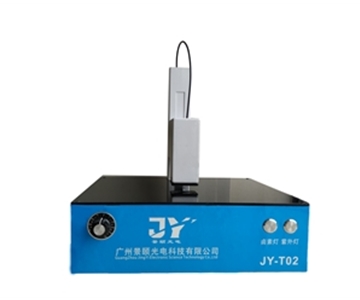
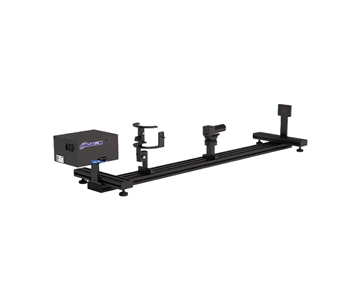
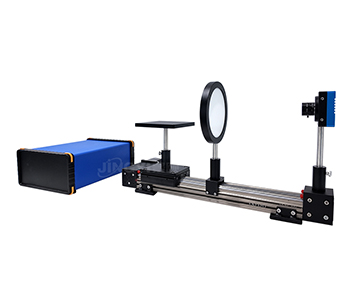
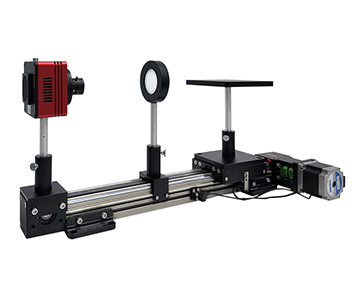
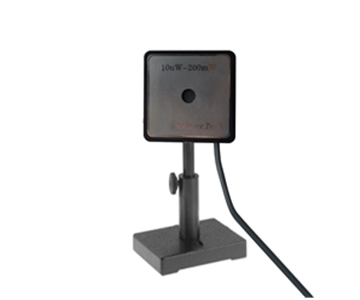
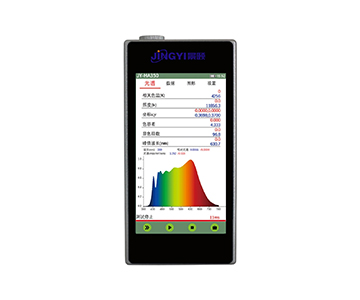
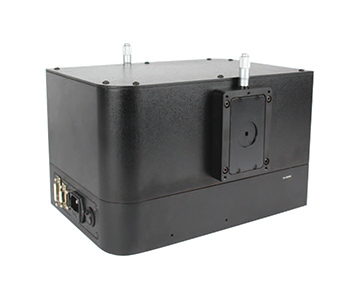
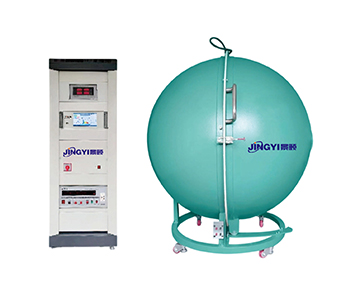
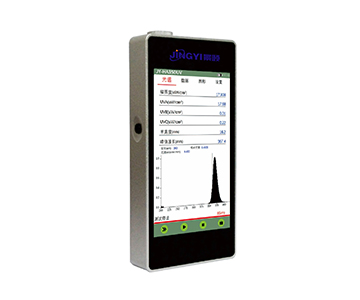
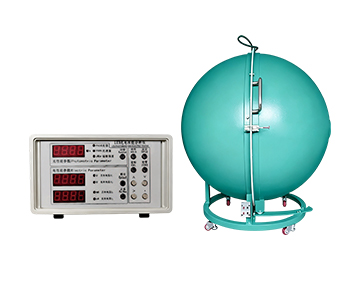
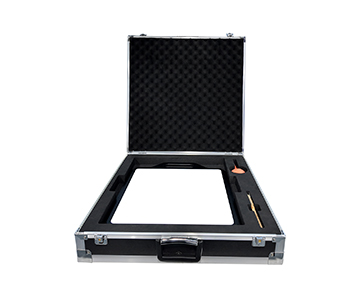
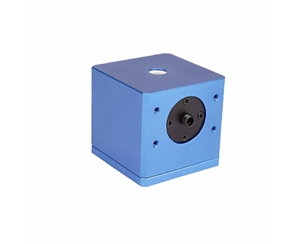
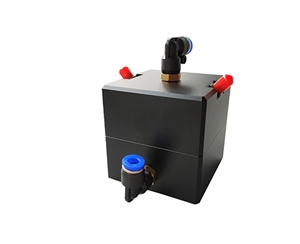
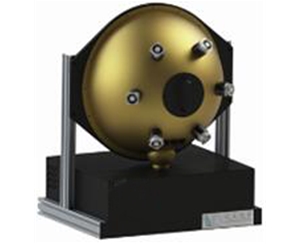
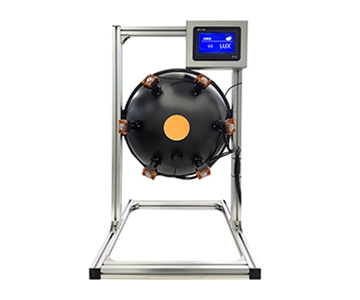
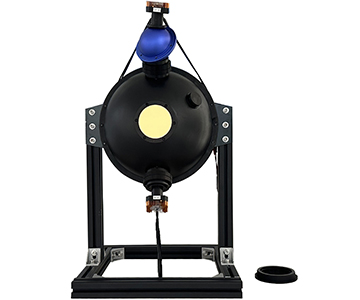
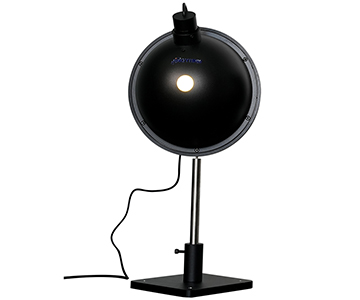
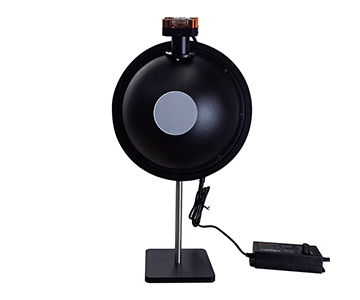
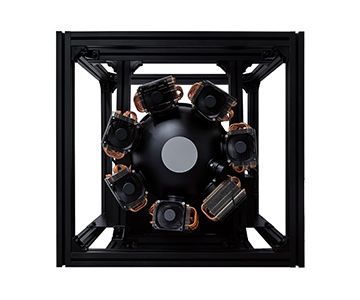
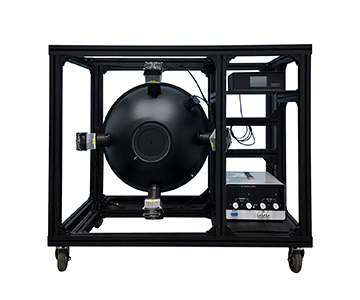
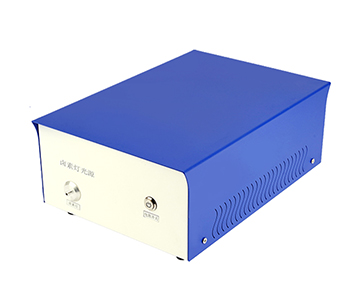
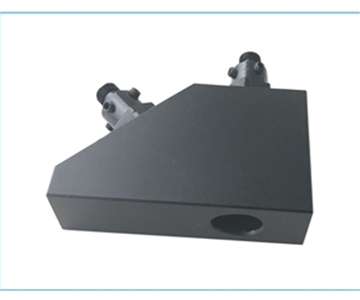
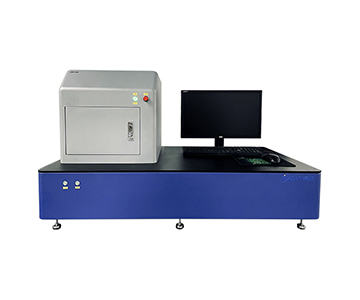
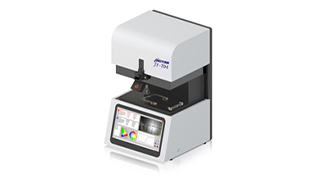
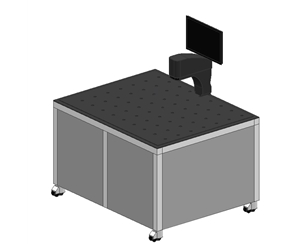
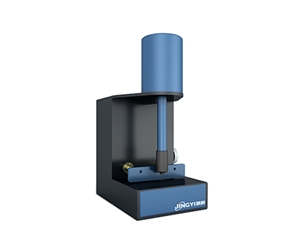
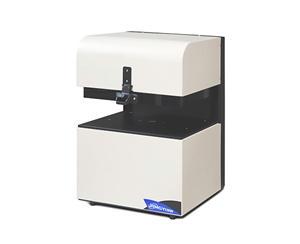
【插入图片:JY-ATP9110-25H宽波段高光谱地物光谱仪.png |
Three Common Misconceptions
Misconception 1: Similar color means identical material.
Many minerals and early‑stage plant diseases appear identical in visible light but show completely different SWIR absorptions. Spectral dimensionality far exceeds color; without infrared coverage, distinct minerals can be misidentified as the same rock.
Misconception 2: Any daytime moment yields reliable data.
Solar elevation changes
Misconception 3: A wide specified range guarantees uniform accuracy.
Visible bands may achieve ±0.1 nm repeatability, but mid‑ to far‑infrared resolution naturally widens to tens of nanometers due to physical limits. Precision measurement requires examining specifications band by band, not fixating on the maximum range number.
Advanced Resources and Standards
Procurement teams benefit more from consulting public standards than from reading brochures. Reflectance measurement methodologies can be cross‑referenced with ASTM E275‑08 (Standard Practice for Describing and Measuring Performance of Ultraviolet, Visible, and Near‑Infrared Spectrophotometers) or ISO 9050 for light transmittance and reflectance. Independent verification baselines should be established using spectral calibration and field reflectance transfer protocols from remote sensing technical white papers, rather than relying solely on vendor claims.
Applicability Boundaries from a Wavelength Repeatability Perspective
Visible bands deliver细腻 performance; ±0.1 nm wavelength repeatability makes multiple measurement curves nearly overlap. Beyond 2.5 µm in mid‑infrared, resolution naturally relaxes to tens of nanometers, and thermal background becomes harder to suppress. Outdoors is not an ideal laboratory: IP54 protection and swappable batteries help, but the 6.5 kg (14.3 lb) main unit remains a burden during extended hikes. High temperature and humidity still require dynamic dark current correction as a safety net. The device does not win on widest range, lightest weight, or highest absolute accuracy simultaneously; it strikes a balance among wide band, portability, and repeatability. Buyers should clarify primary wavelength bands before comparing specifications.
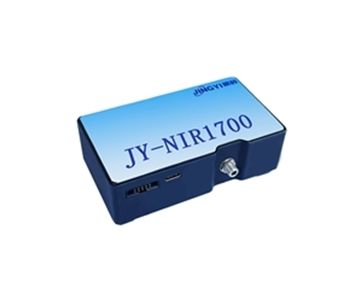
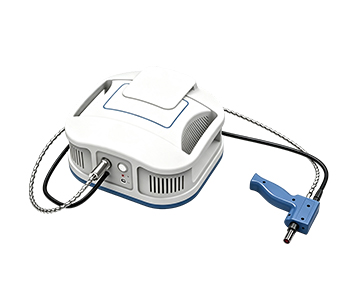
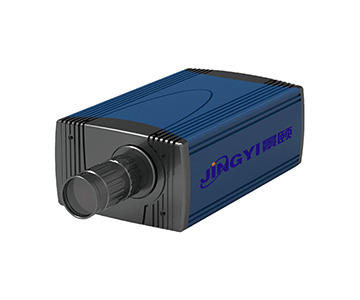
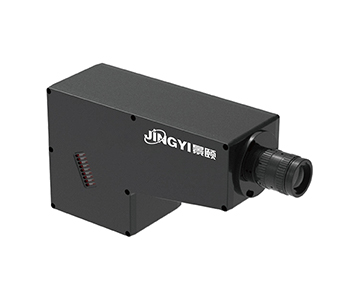
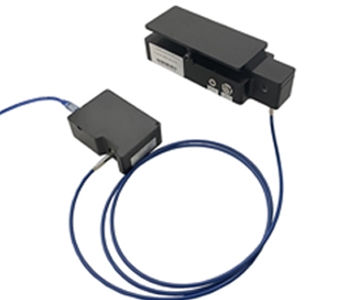
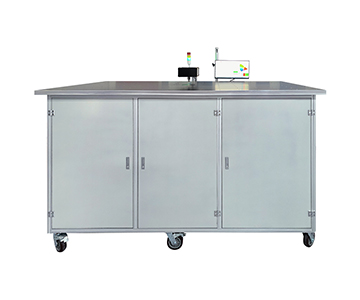
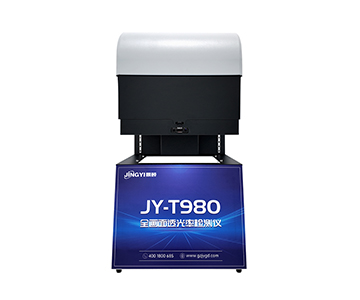
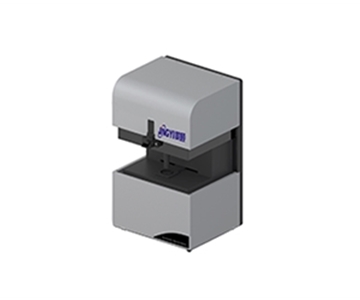
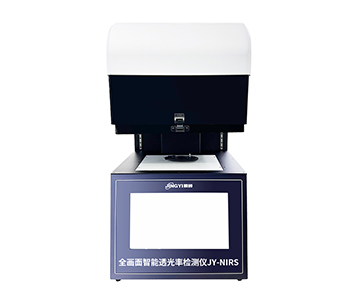
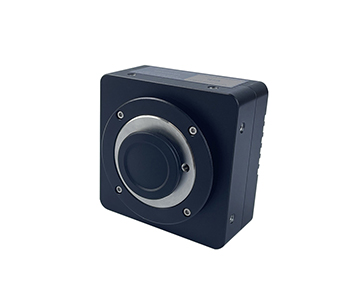
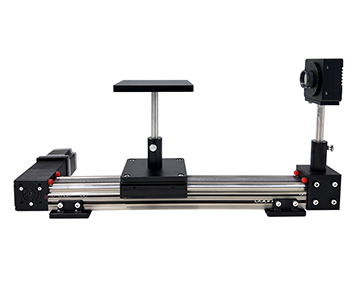
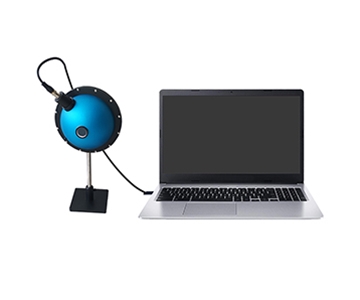
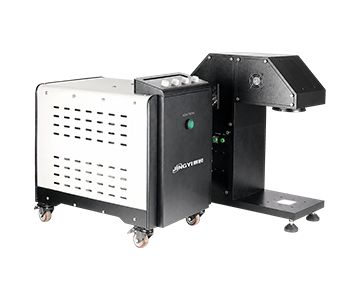
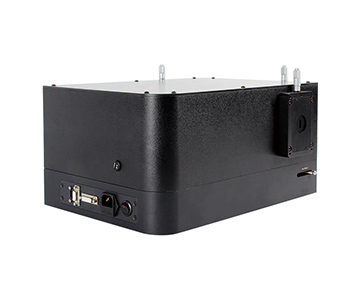
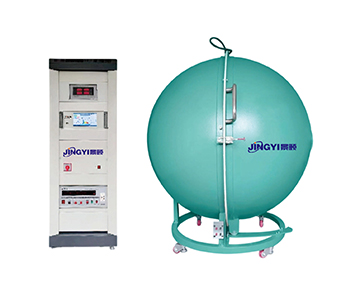
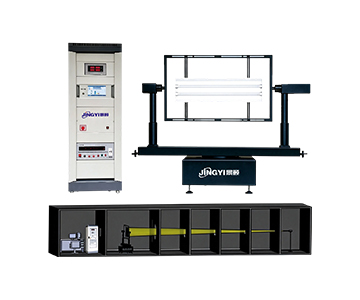
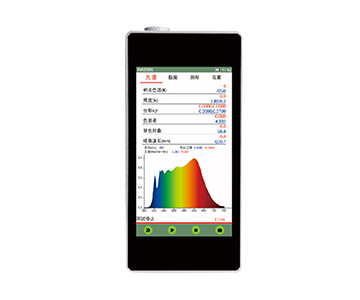
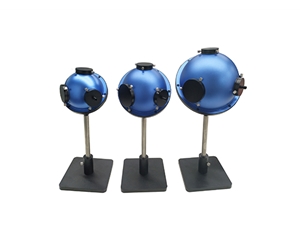
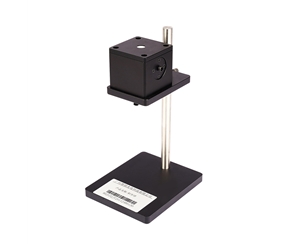
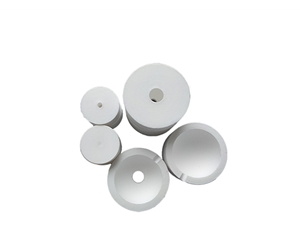
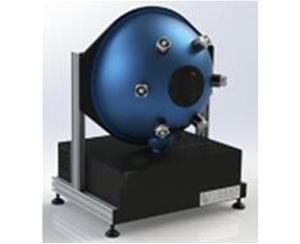
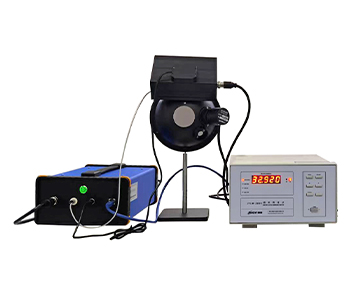
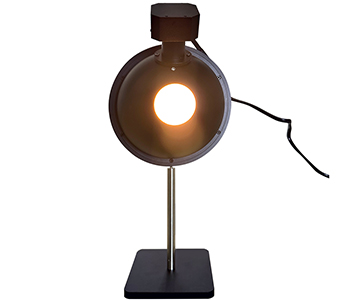
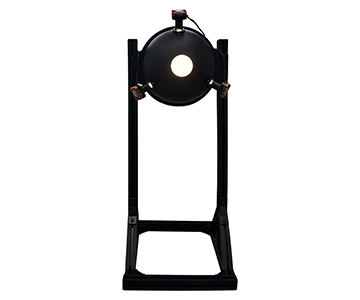
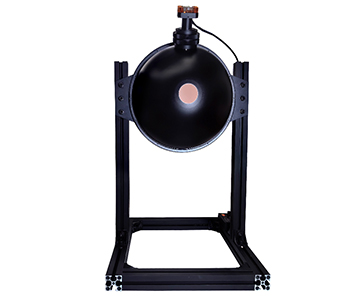
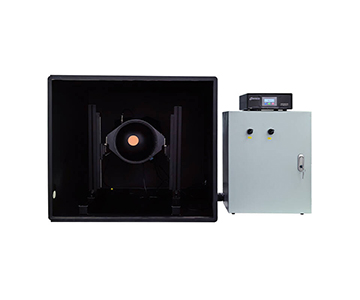
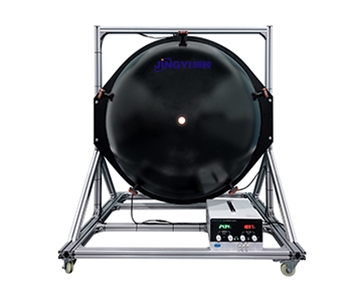
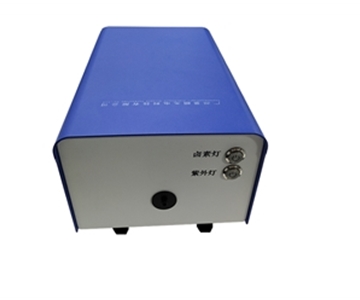
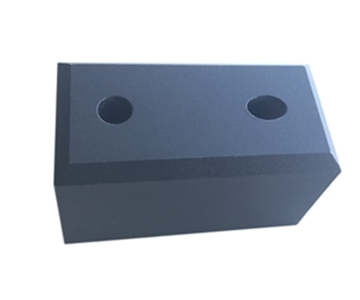
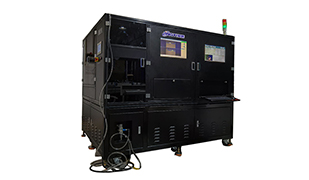
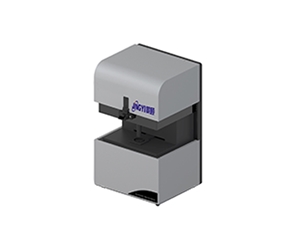
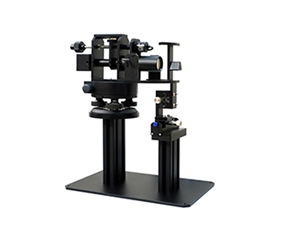
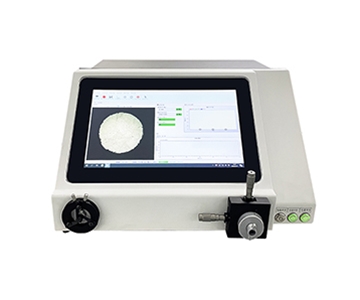
【插入图片:宽波段高光谱地物光谱仪JY-ATP9110TP.jpg |
Frequently Asked Questions
Q1: What exactly does wavelength repeatability measure?
It quantifies the consistency of wavelength positioning when the same surface is measured multiple times under identical conditions. Better repeatability means tighter curve overlap. In cross‑day field observations, it directly determines whether data can be compared horizontally—a more fundamental metric than maximum range.
Q2: Can measurements be taken on cloudy days or from a moving vessel?
Yes. Dynamic dark current correction adapts to low light. On ships, attitude records compensate for angle deviations. Overcast diffuse light actually reduces strong‑light saturation; as long as the probe’s field of view is aimed at the target, valid data can be acquired.
Q3: Can water surfaces, vegetation, and rocks all be measured?
All three are compatible. The fiber collects reflected light non‑contact; simply switch field‑of‑view lenses. For water, a narrow FOV avoids sky glare; for vegetation, a slightly wider FOV improves efficiency.
Q4: How should I select a spectral range without overspending?
Match the range to target absorption features. Vegetation and basic geology are covered by visible‑near‑infrared. Identifying specific minerals requires extension beyond 2500 nm. Blindly pursuing maximum range only increases weight and cost.
Q5: How can I independently verify accuracy upon delivery?
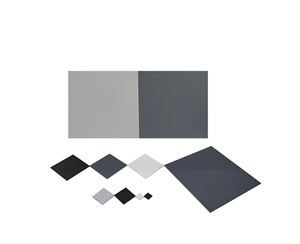
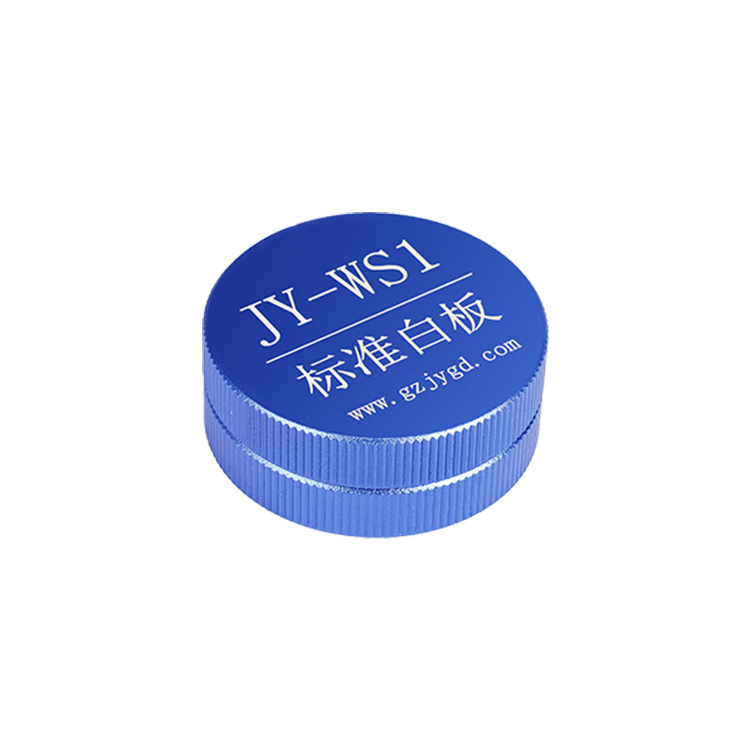
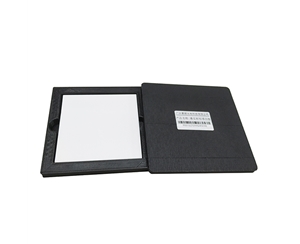
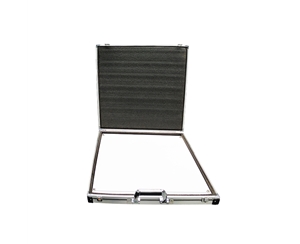
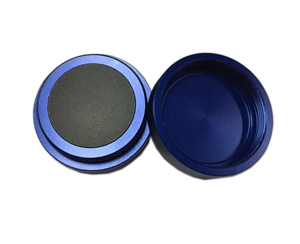
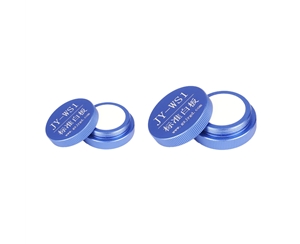
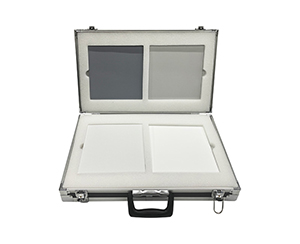
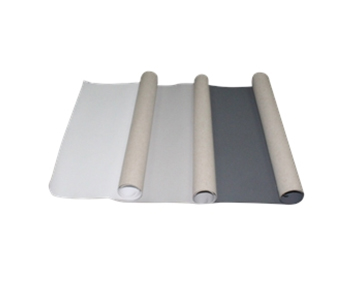
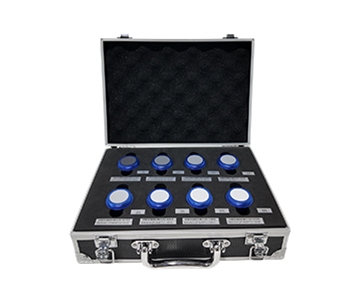
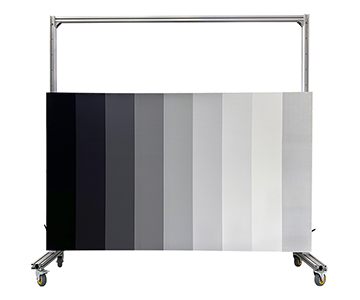
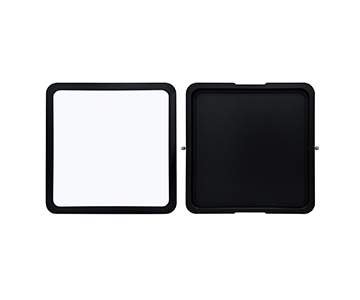
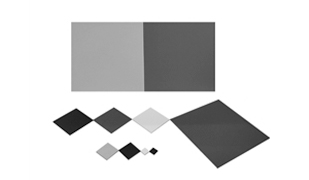
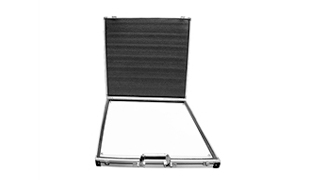
Use a standard diffuse reflectance panel for repeated measurements, comparing wavelength repeatability and SNR against实测 values. Validate against NIST‑traceable reflectance standards or equivalent national metrology frameworks. Focus on multiple‑curve coincidence rather than trusting factory reports alone.
Conclusion
The value of a wide‑band hyperspectral field spectrometer lies not in measuring broadly, but in measuring stably. When wavelength repeatability is seriously factored into procurement criteria, field data gains cross‑temporal and cross‑site comparability. For detailed specifications and application notes on wide‑band hyperspectral field spectrometers, search “Jingyi Optoelectronics + field spectrometer” or visit our technical library.
About This Guide
Data Sources
: Uploaded product technical documentation, GB/T 47066‑2026 national standard (reflectance measurement methodology), publicly available remote sensing measurement data.
Author
: Cai Xiaodong, Senior Application Engineer, Jingyi Optoelectronics, 12 years in optical measurement and hyperspectral equipment application.
Disclosure
: Jingyi Optoelectronics manufactures wide‑band hyperspectral field spectrometers. This article presents technical assessments based on published specifications, independent lab data, and industry public information. No compensation was received from third‑party brands mentioned.
Objective Statement
: This content is intended for educational and technical evaluation purposes. Equipment selection should always include independent proof‑of‑concept validation under your specific process conditions.
Last Updated
: October 2026