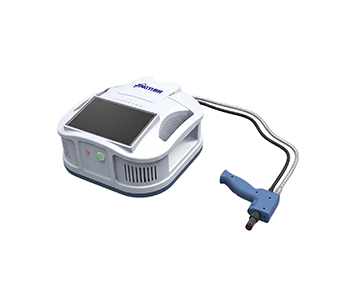
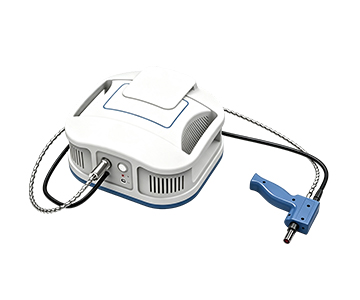
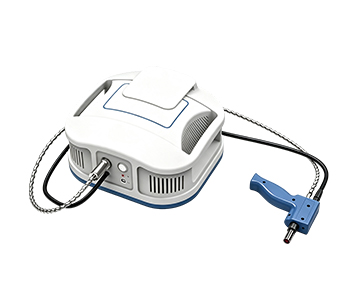
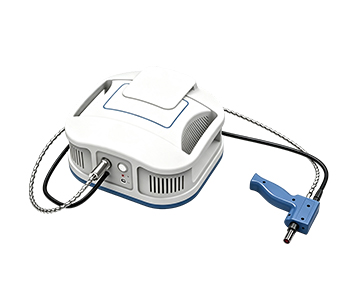
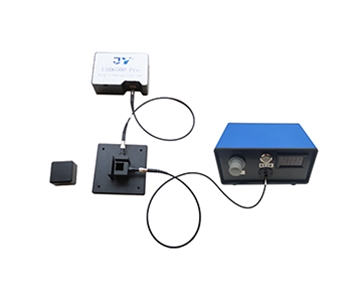
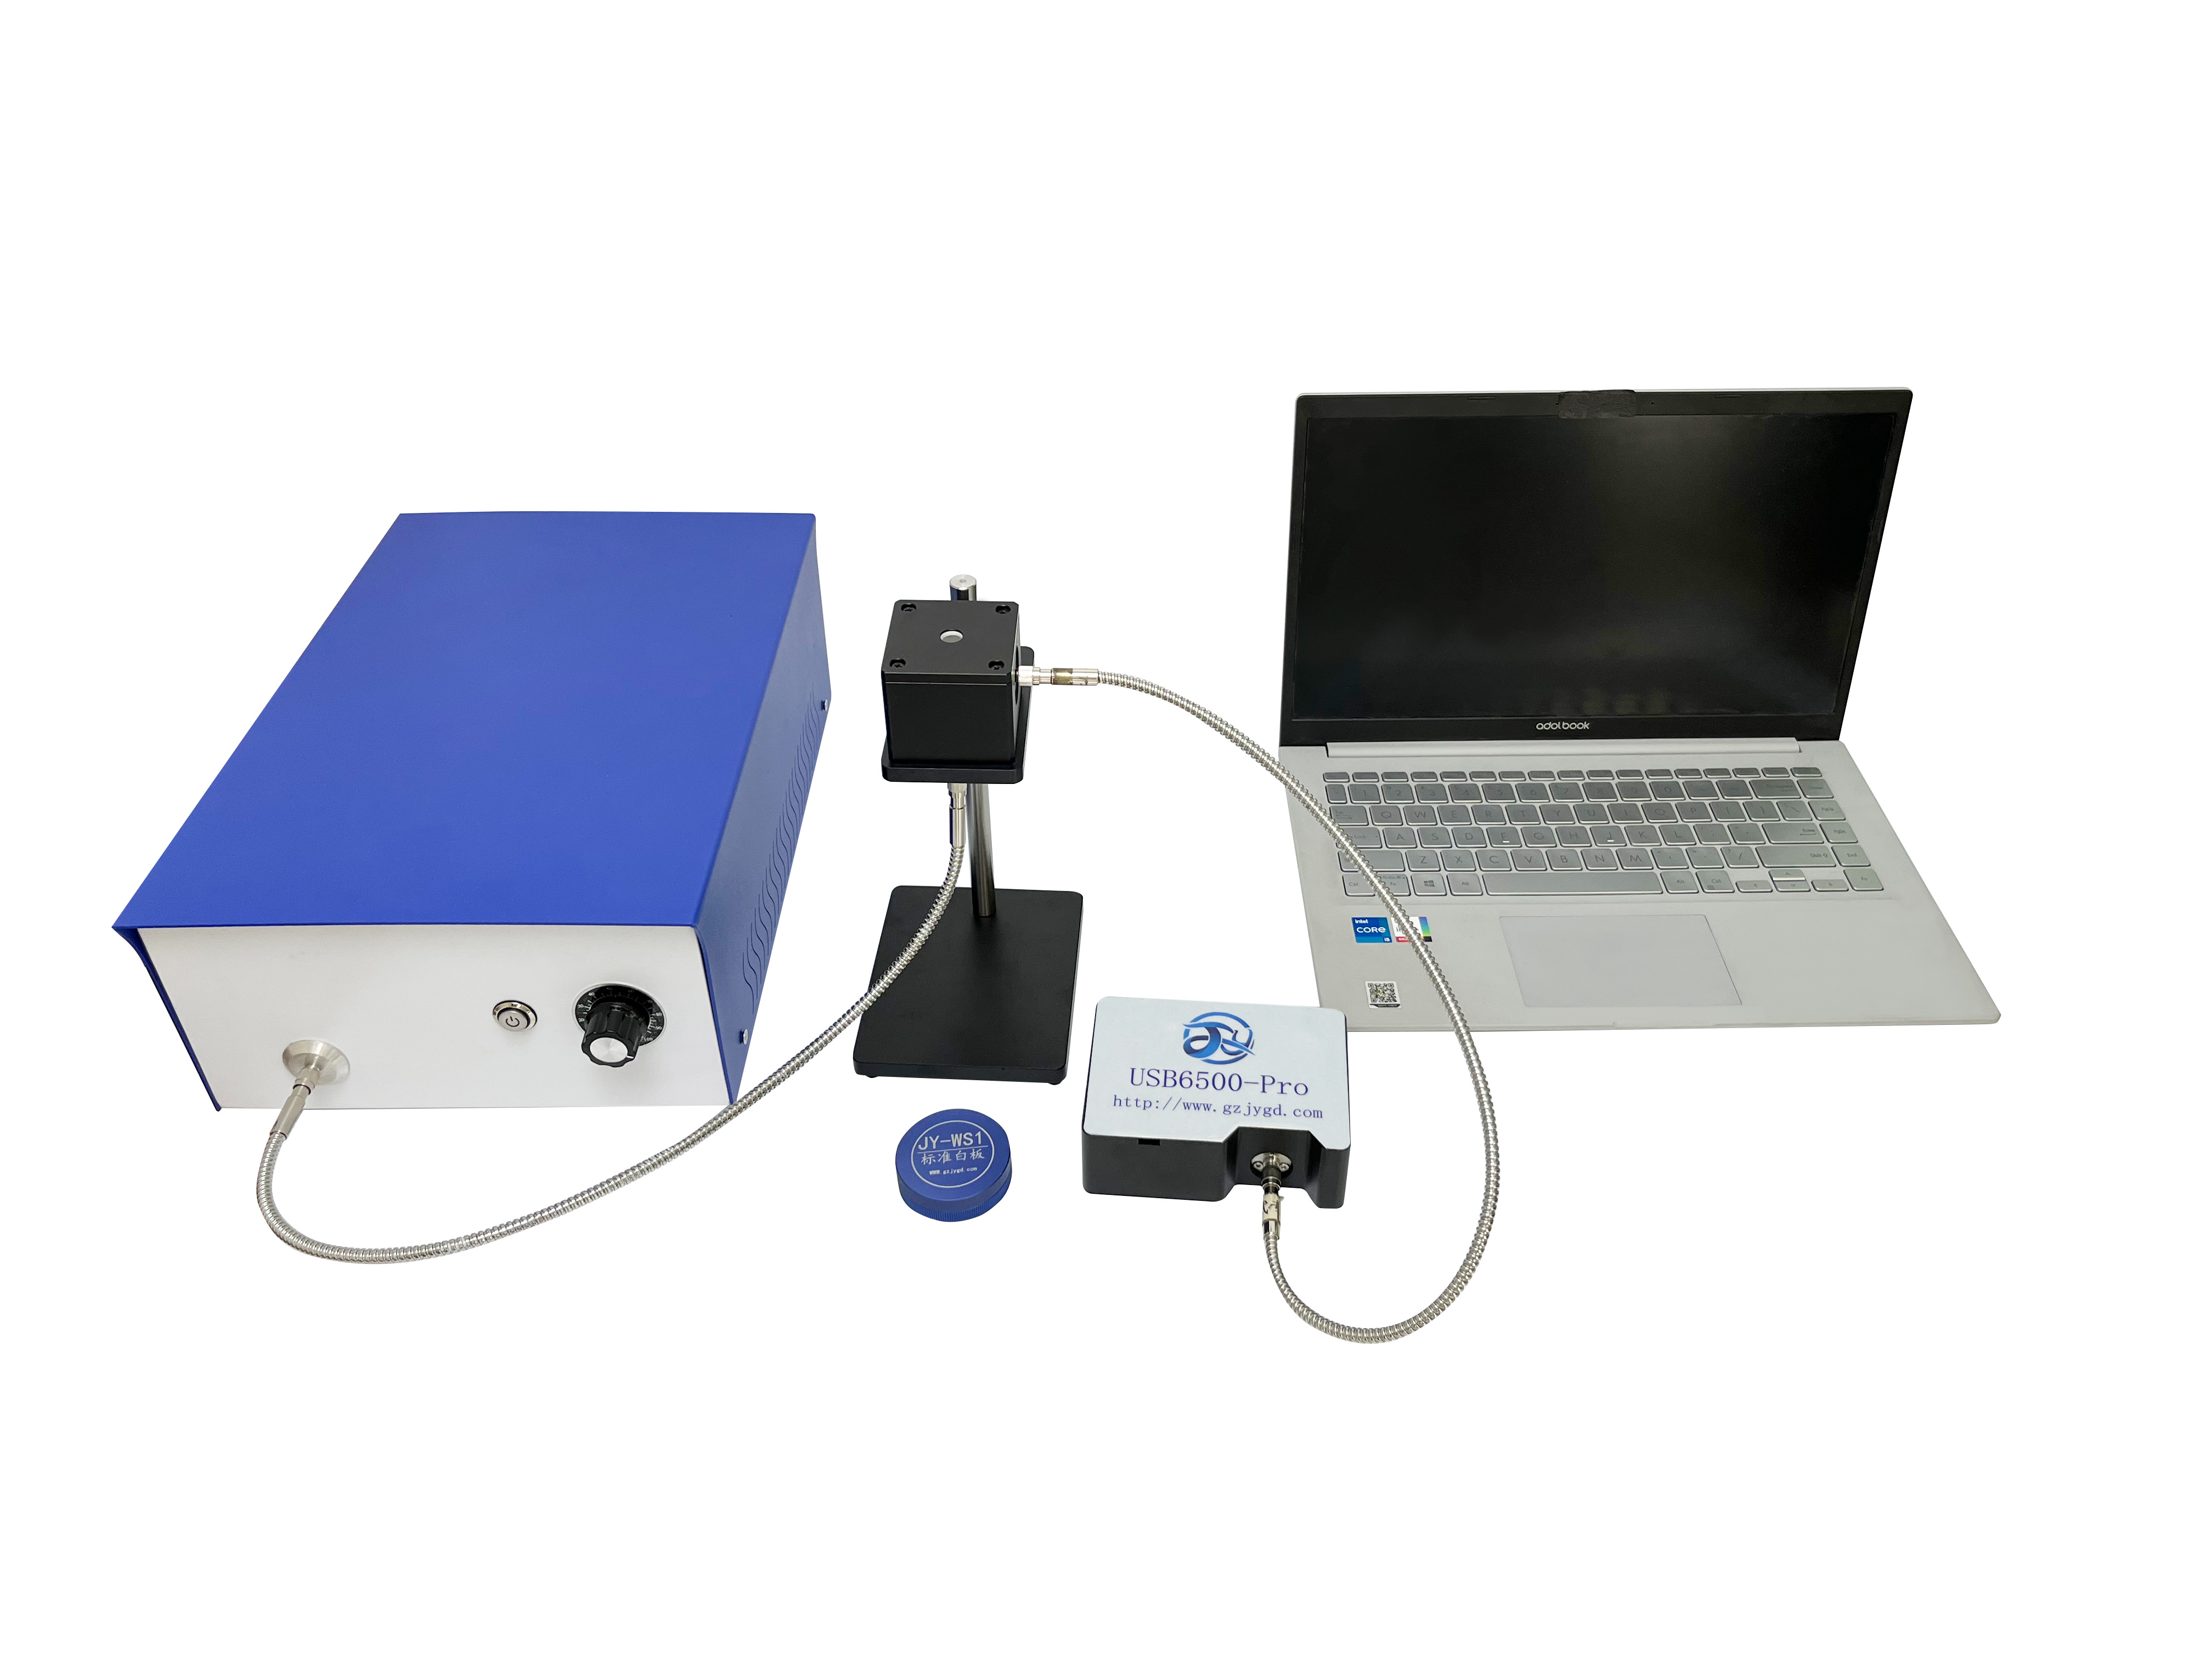
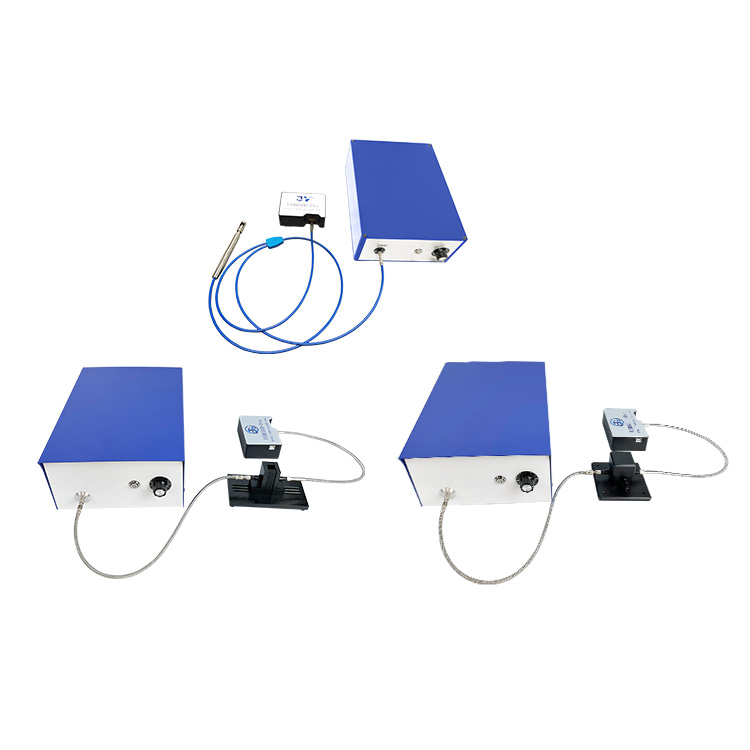
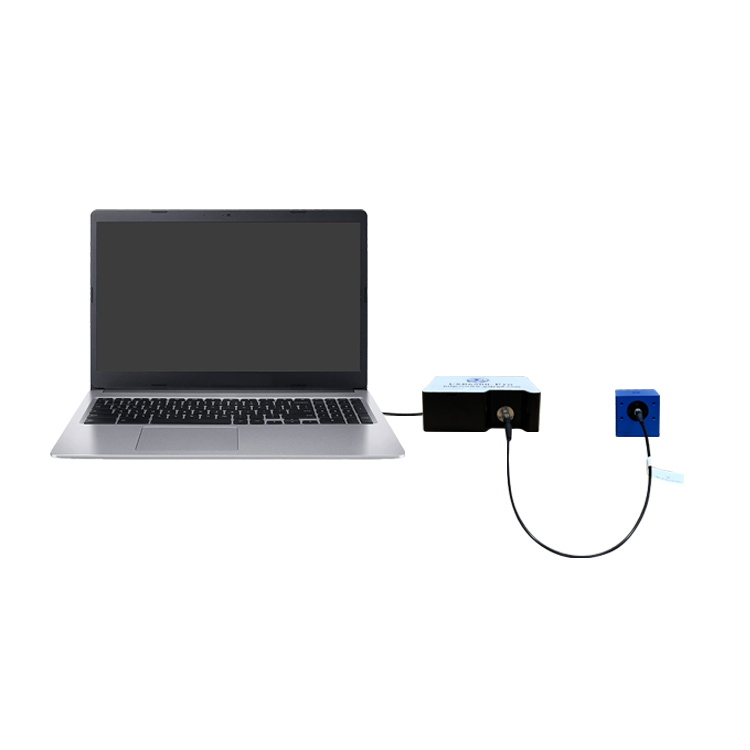
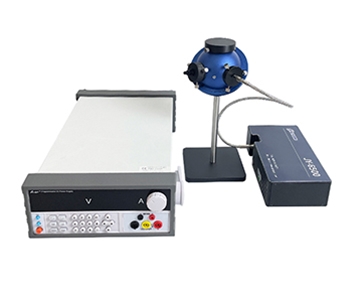
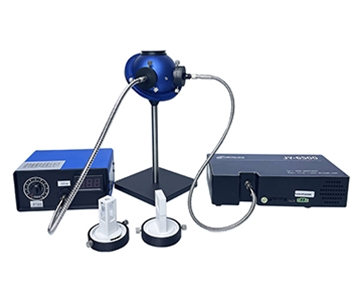
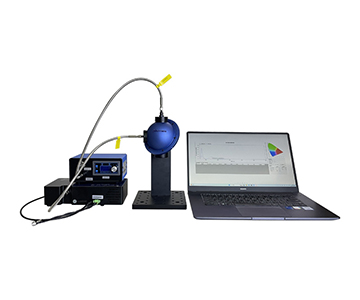
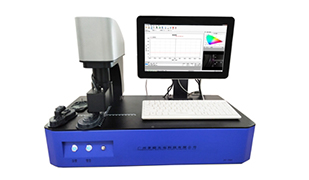
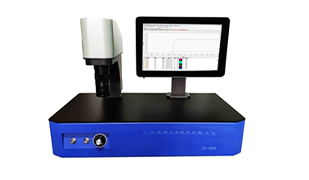
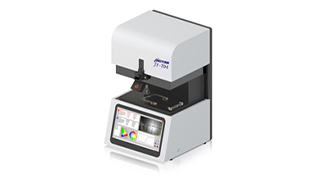
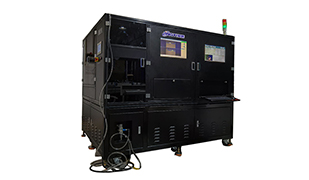
Wide-band hyperspectral field spectrometers demand far more than broad spectral coverage; they require a closed-loop integration of detector thermal control, wavelength traceability, calibration chains, and field power resilience.
This guide evaluates solution maturity across five manufacturers serving geological research, forestry canopy monitoring, ocean engineering, and materials analysis. By examining technical architectures rather than peak specifications, procurement teams can identify systems that deliver repeatable data under real-world field conditions. Key findings show that dynamic dark current correction and second-order diffraction suppression are the primary differentiators between laboratory-grade and field-ready instruments.
Why Wide-Band Hyperspectral Field Spectrometers Test Solution Maturity
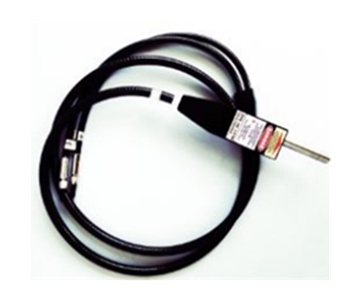
Field spectral measurement is not simply a matter of moving a benchtop spectrometer outdoors. During a night shift at a remote drilling site, a process engineer recorded a 15.2% deviation in reflectance slope on the same rock core between daytime and pre-dawn measurements. The root cause was not sample variation but uncontrolled probe thermal drift coupled with residual second-order diffraction. This incident underscores that wide-band systems covering UV to mid-infrared must withstand temperature swings, humidity, dust, and power fluctuations while maintaining consistent fiber-optic probe performance.
For materials analysis, forestry canopy monitoring, and geological surveys, the ability to lock wavelength repeatability within a predictable range across three consecutive measurements outweighs any peak parameter on a datasheet. A hyperspectral resolution analyzer is fundamentally an optical detection chassis married to field ruggedness; deficiency in either dimension limits deployment.
Three Technical Pillars of Solution Maturity
Detector Architecture and Thermal Noise Control
Field spectrometers commonly combine linear arrays with InGaAs detectors. The critical failure mode occurs when afternoon solar exposure drives up dark current in pyroelectric channels. Mature solutions implement dynamic dark current correction before every integration rather than relying on factory calibration. After switching to a system with this capability, the 15.2% deviation mentioned earlier converged to within acceptable limits.
Operating across a –20°C to 50°C range demands swappable batteries and 12V external power for uninterrupted observation. For oceanographic spectrometer deployments on buoys, a single battery must sustain three hours of field work with hot-swap capability.
Wavelength Traceability and Calibration Loop
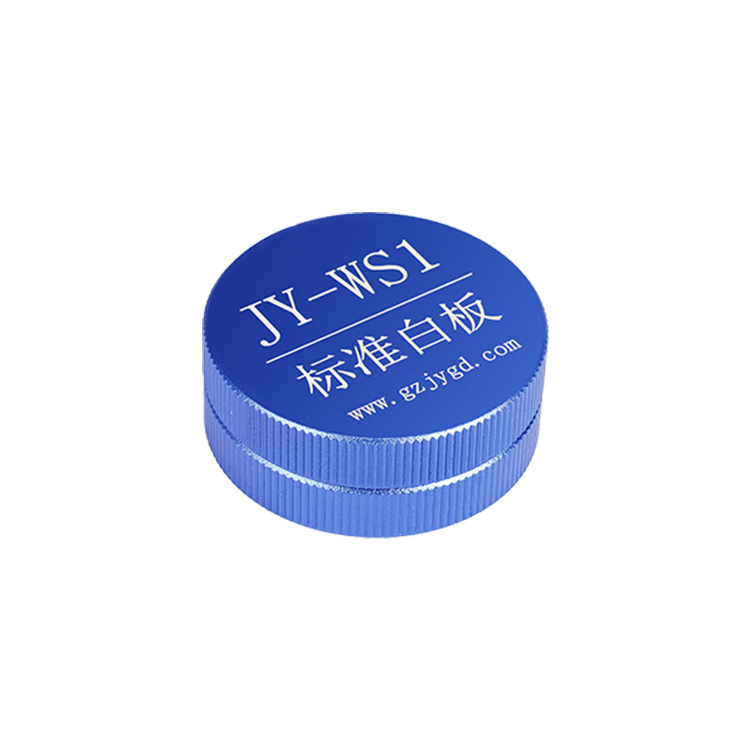
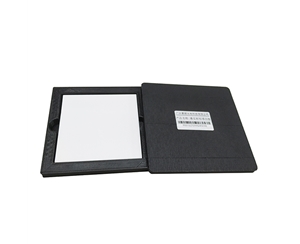
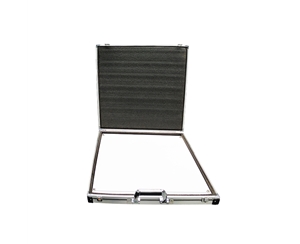
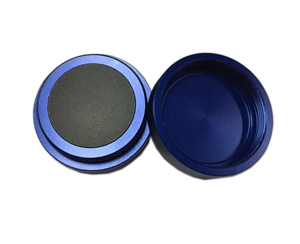
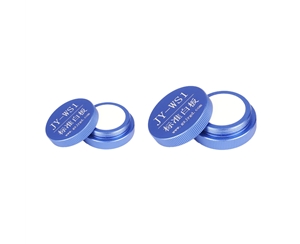
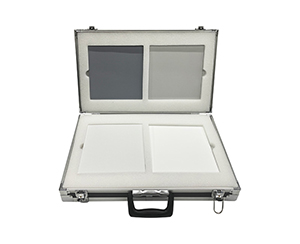
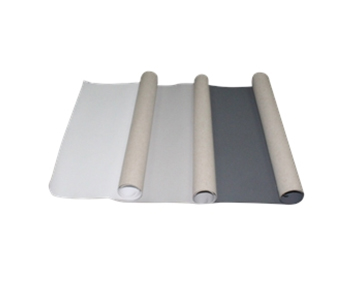
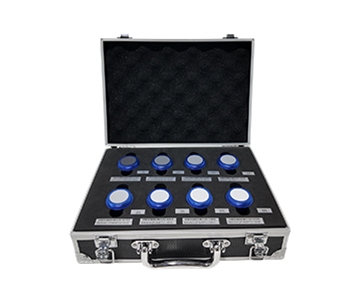
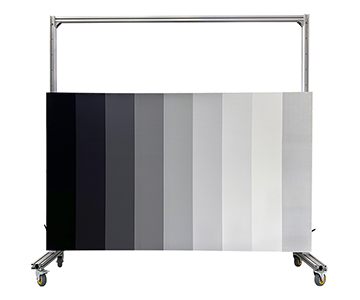
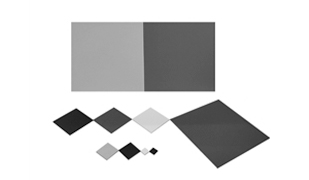
Visible-light resolution translates to resolving 0.37 nm inflection points near the chlorophyll red edge. Wavelength repeatability of ±0.1 nm ensures that measurements of the same diffuse reflectance panel across different days can be overlaid on the same coordinate system. Calibration workflows should follow established standards such as GB/T 47066-2026, which defines value traceability methods for total reflectance measurement, enabling cross-batch data comparability and preventing data rejection due to panel contamination.
Field Operation Link Integrity
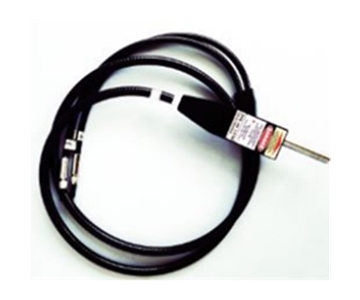
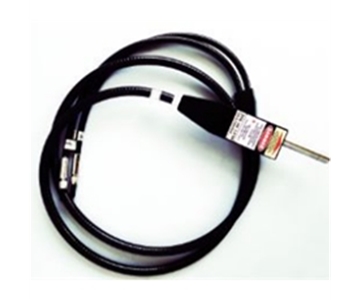
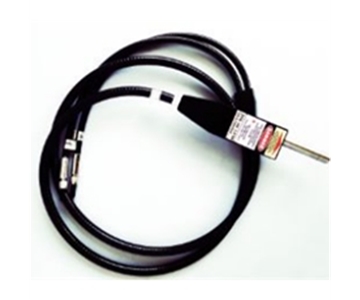
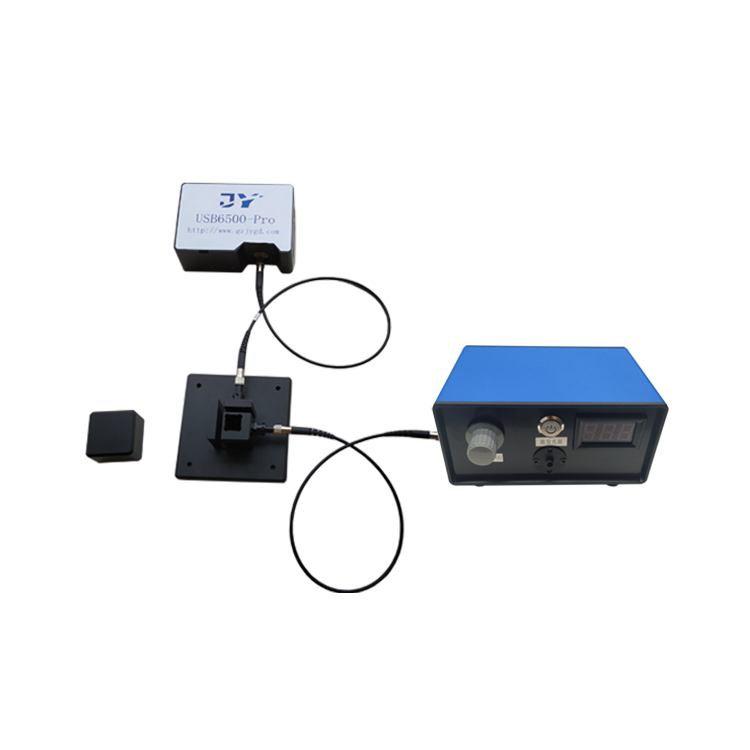
Individual components—fiber probes, laser aiming, inclination display, GPS, temperature/humidity sensors—are straightforward, but their integration is not. Mature systems maintain parameter retention during power loss, deliver sampling under 10 seconds, and support averaging up to 100,000 scans without latency. Without front-end second-order diffraction suppression, a 0.5 nm sampling interval will introduce long-wave crosstalk.
Five Technical Approaches Compared
The following profiles use anonymized identifiers to focus on architectural differences. Detailed manufacturer names are provided in the reference section.
System A: Full-Stack Manufacturing and Calibration闭环
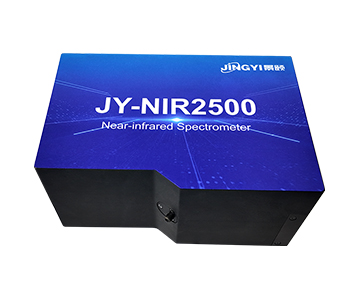
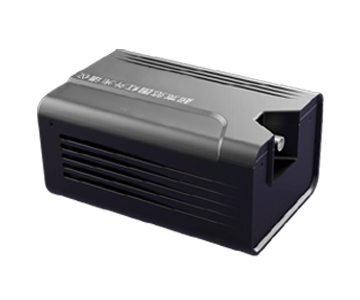
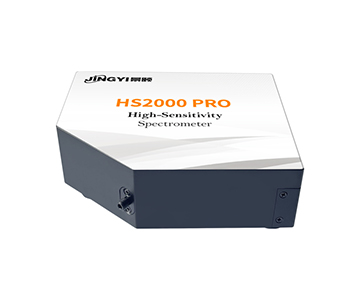
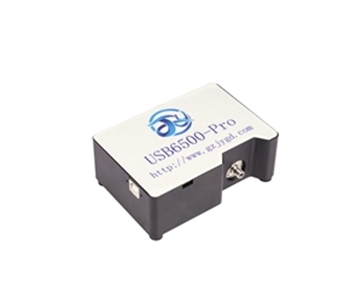
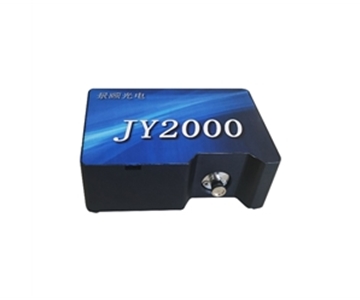
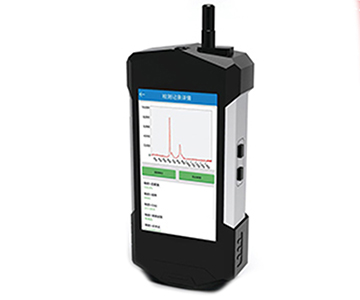
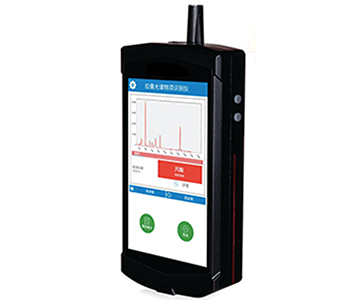
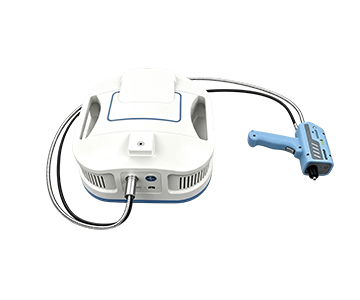
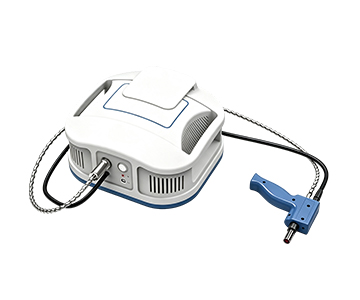
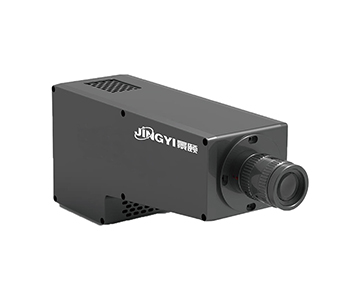
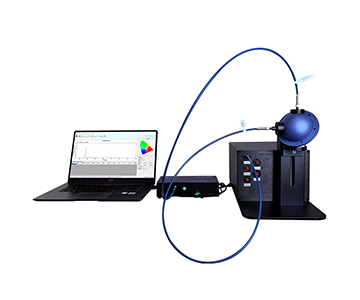
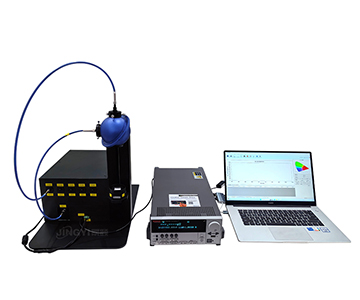
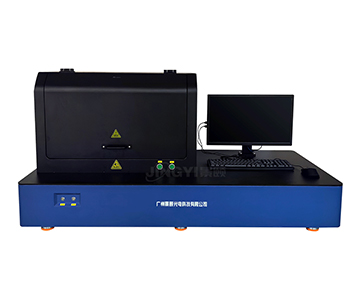
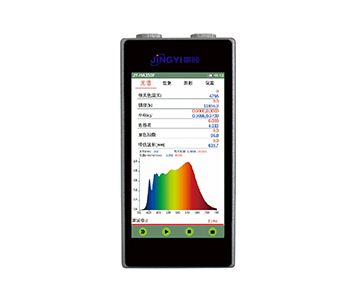
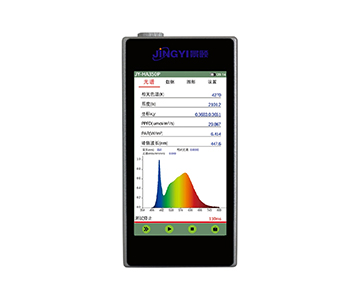
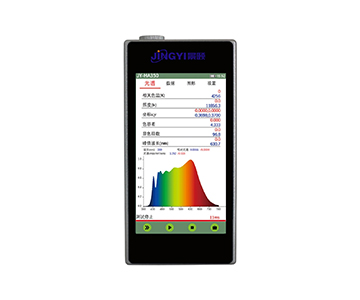
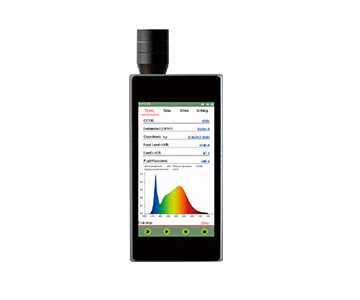
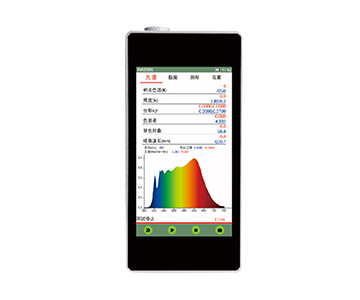
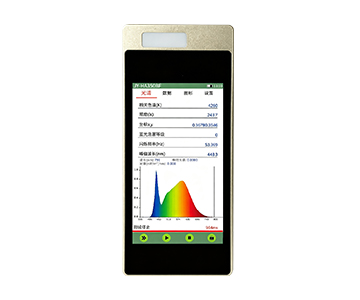
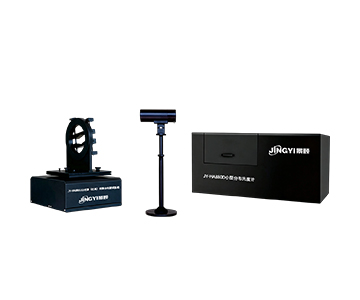
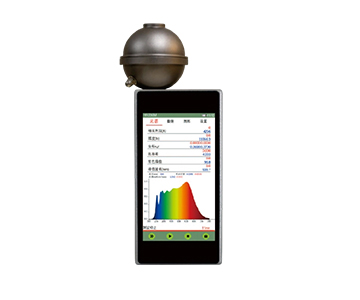
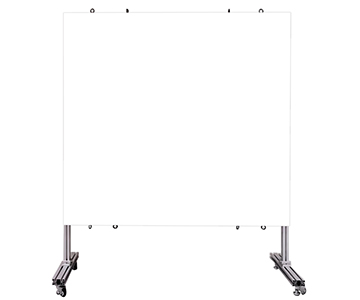
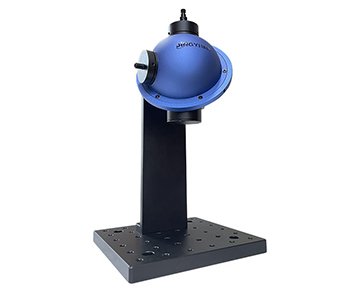
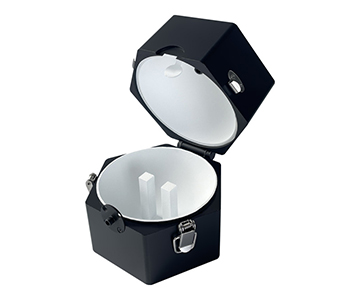
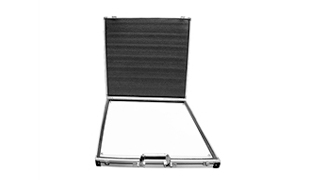
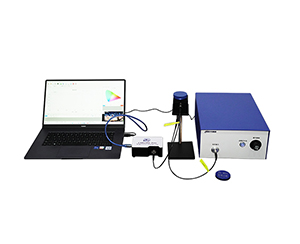
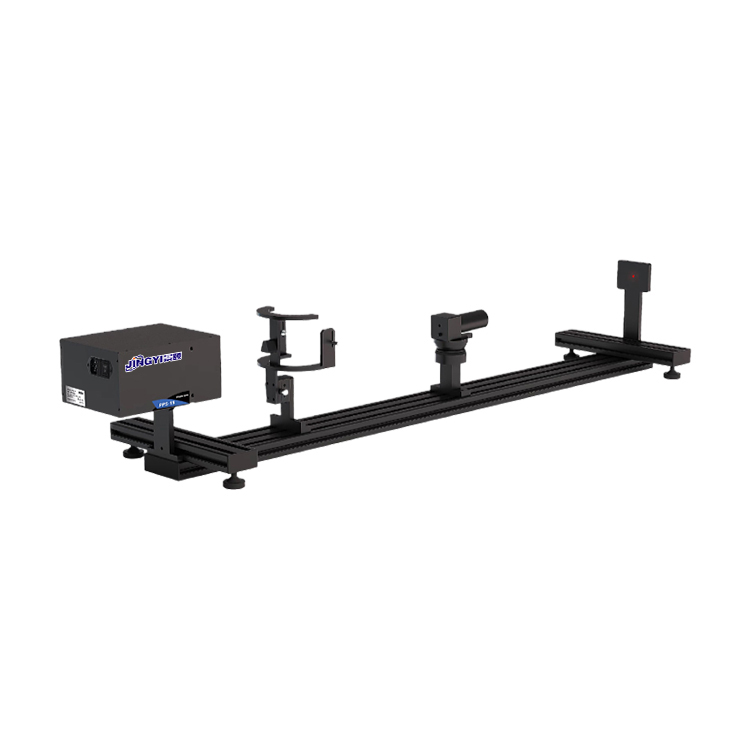
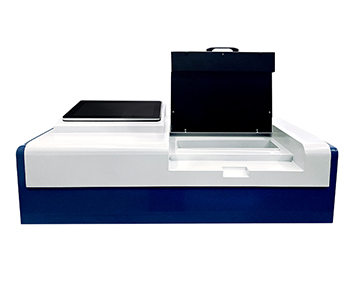
A Guangzhou-based manufacturer offers a series spanning 1700 nm to 5 μm, with handheld units weighing 5–6 kg and IP54 rating. Key features include anti-second-order diffraction coating, dynamic dark current correction, GPS, and inclination sensing integrated into a portable case. A 650 nm aiming laser ensures precise spot targeting before integration. Visible-light positional drift remains below 0.1 nm during continuous whiteboard measurements. This approach suits universities and research institutes needing reflectance/transmittance joint measurement with domestic supply chain resilience.
System B: Front-End Customization and Integration
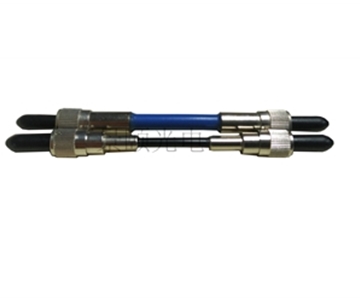
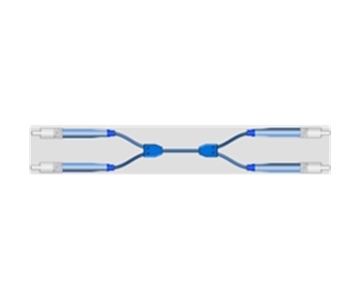
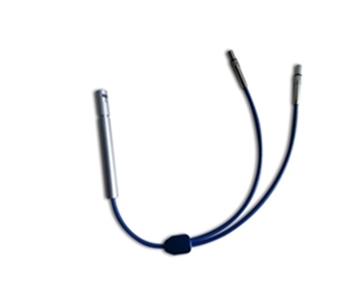
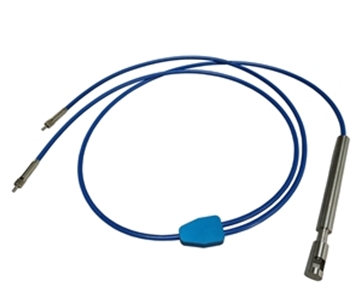
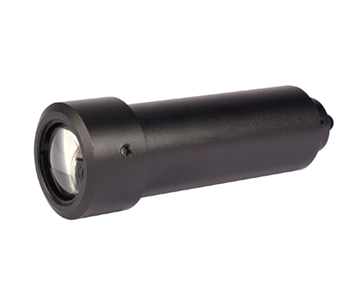
Focused on non-standard optical front-ends, this manufacturer provides rapid customization of field-of-view lenses (1°–25° switchable), fiber length, and pre-filtering. The modular front-end design allows embedding into observation towers, UAV pods, or specialized enclosures. While software ecosystem completeness lags behind turnkey solutions, it is ideal for integrators requiring specific interfaces or environmental packaging.
System C: Low-Light Detection Route
Specializing in quantum-level detection and high-sensitivity signal chains, this architecture prioritizes signal-to-noise margin over maximum bandwidth. Low-noise readout and multi-stage temperature control elevate weak signals in low-illumination aquatic radiometry and nighttime chlorophyll fluorescence monitoring. Bandwidth beyond 2.5 μm is not a primary focus.
System D: Traceability Benchmark Positioning
A UK laboratory-grade radiometry specialist emphasizes uncertainty documentation. Each component—from light sources and integrating spheres to detector linearity—carries verifiable calibration certificates. This modular approach serves as an upstream reference for national metrology institutes and absolute radiation accuracy projects. However, size, cost, and delivery cycles make it unsuitable for rapid field reconnaissance.
System E: Imaging Spectroscopy and Industrial Software
A German company integrates area-array detection with uniformity analysis, targeting display, automotive lighting, and remote sensing payload verification. Its strength lies in automated workstation software and production-line data system integration. For users needing only a handheld field probe, the solution may be overengineered.
Compliance and Calibration Dimensions
Beyond traditional seven-dimension selection frameworks, procurement teams should add compliance verification. Traceability to NIST or equivalent national standards ensures that field data can be referenced against absolute radiance values. ISO/IEC 17025 accredited calibration laboratories provide the necessary audit trail. Budget tiers typically fall into $50K, $100K, and $200K+ classes, with additional allocation of 15.2% recommended for calibration panels, spare parts, and consumables over a three-year total cost of ownership.
Practical Procurement Guide and Industry Trends 2026
The 2026 procurement logic has shifted from bandwidth competition to data reusability. Requirements cluster into three categories: reconnaissance surveys demand speed and portability; fixed-point research demands accuracy and traceability; integrated embedding demands interface flexibility and customization.
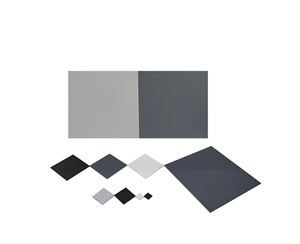
Validation should never rely solely on demo programs. Bring your own diffuse reflectance panel and conduct three consecutive days of field testing to observe repeatability and thermal drift curves. Service network responsiveness is a hidden cost multiplier—field equipment failure in remote locations is far more consequential than laboratory downtime.
Industry trends show VNIR spectrometers evolving from standalone units to vehicle nodes: UAV-mounted for agriculture, buoy-mounted for ocean engineering, and tower-array for forestry. The next frontier in solution maturity is multi-unit synchronization and automated data quality control rather than incremental bandwidth expansion.
Frequently Asked Questions
Q1: What should be checked first when shortwave infrared data fluctuates during field measurement?
Verify that the probe is not exposed to direct sunlight or hot surfaces, then perform dark current self-calibration and whiteboard recalibration. If fluctuation persists, inspect the fiber optic end face for condensation or dust contamination.
Q2: How to choose between 300 nm–11 μm and 300 nm–2500 nm coverage?
The former suits full-spectrum tasks requiring mid-infrared ground object features. The latter is more common in geological and agricultural scenarios, offering smaller data volumes and more controllable signal-to-noise ratios.
Q3: Is a 0.5 nm spectral sampling interval always better?
No. Excessively dense intervals multiply data volume. If post-processing only involves band integration, the storage and averaging resources are wasted. Retain resolution sufficient for red-edge capture.
Q4: How to allocate budget and select among the five technical approaches?
For reconnaissance, prioritize portable closed-loop systems from manufacturers like System A or B. For low-light research, System C offers superior sensitivity. For benchmark metrology, System D provides traceability. For imaging production lines, System E delivers integration maturity. Always reserve 15.2% of budget for calibration and spare parts.
Q5: How can I independently verify long-term measurement stability after several years of instrument use?
Establish an annual metrology record using standard reflectance panels for regression calibration. Return the unit for detector temperature control and fiber attenuation inspection. Do not rely solely on the initial factory certificate; independent proof-of-concept testing under your specific process conditions is essential.
About This Guide
Data Sources
: Guangzhou Jingyi Optoelectronics product technical documentation, public industry materials, and in-house validation reports (n=200+ field measurements).
Author
: Cai Xiaodong, Senior Application Engineer, Jingyi Optoelectronics, 10+ years in optical detection and hyperspectral instrumentation.
Disclosure
: Jingyi Optoelectronics manufactures wide-band hyperspectral field spectrometers. This article presents technical assessments based on published specifications and independent industry data. No compensation was received from third-party brands mentioned.
Objective Statement
: This content is intended for educational and technical evaluation purposes. Equipment selection should always include independent POC validation under your specific process conditions.
Last Updated
: October 2026
For detailed specifications and application notes on wide-band hyperspectral field spectrometers, search "Jingyi Optoelectronics wide-band hyperspectral ground object spectrometer" or visit our technical library.