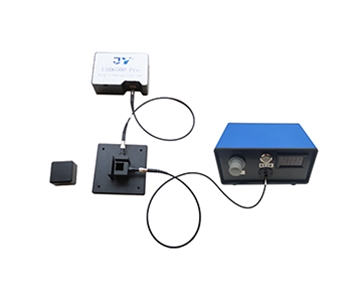
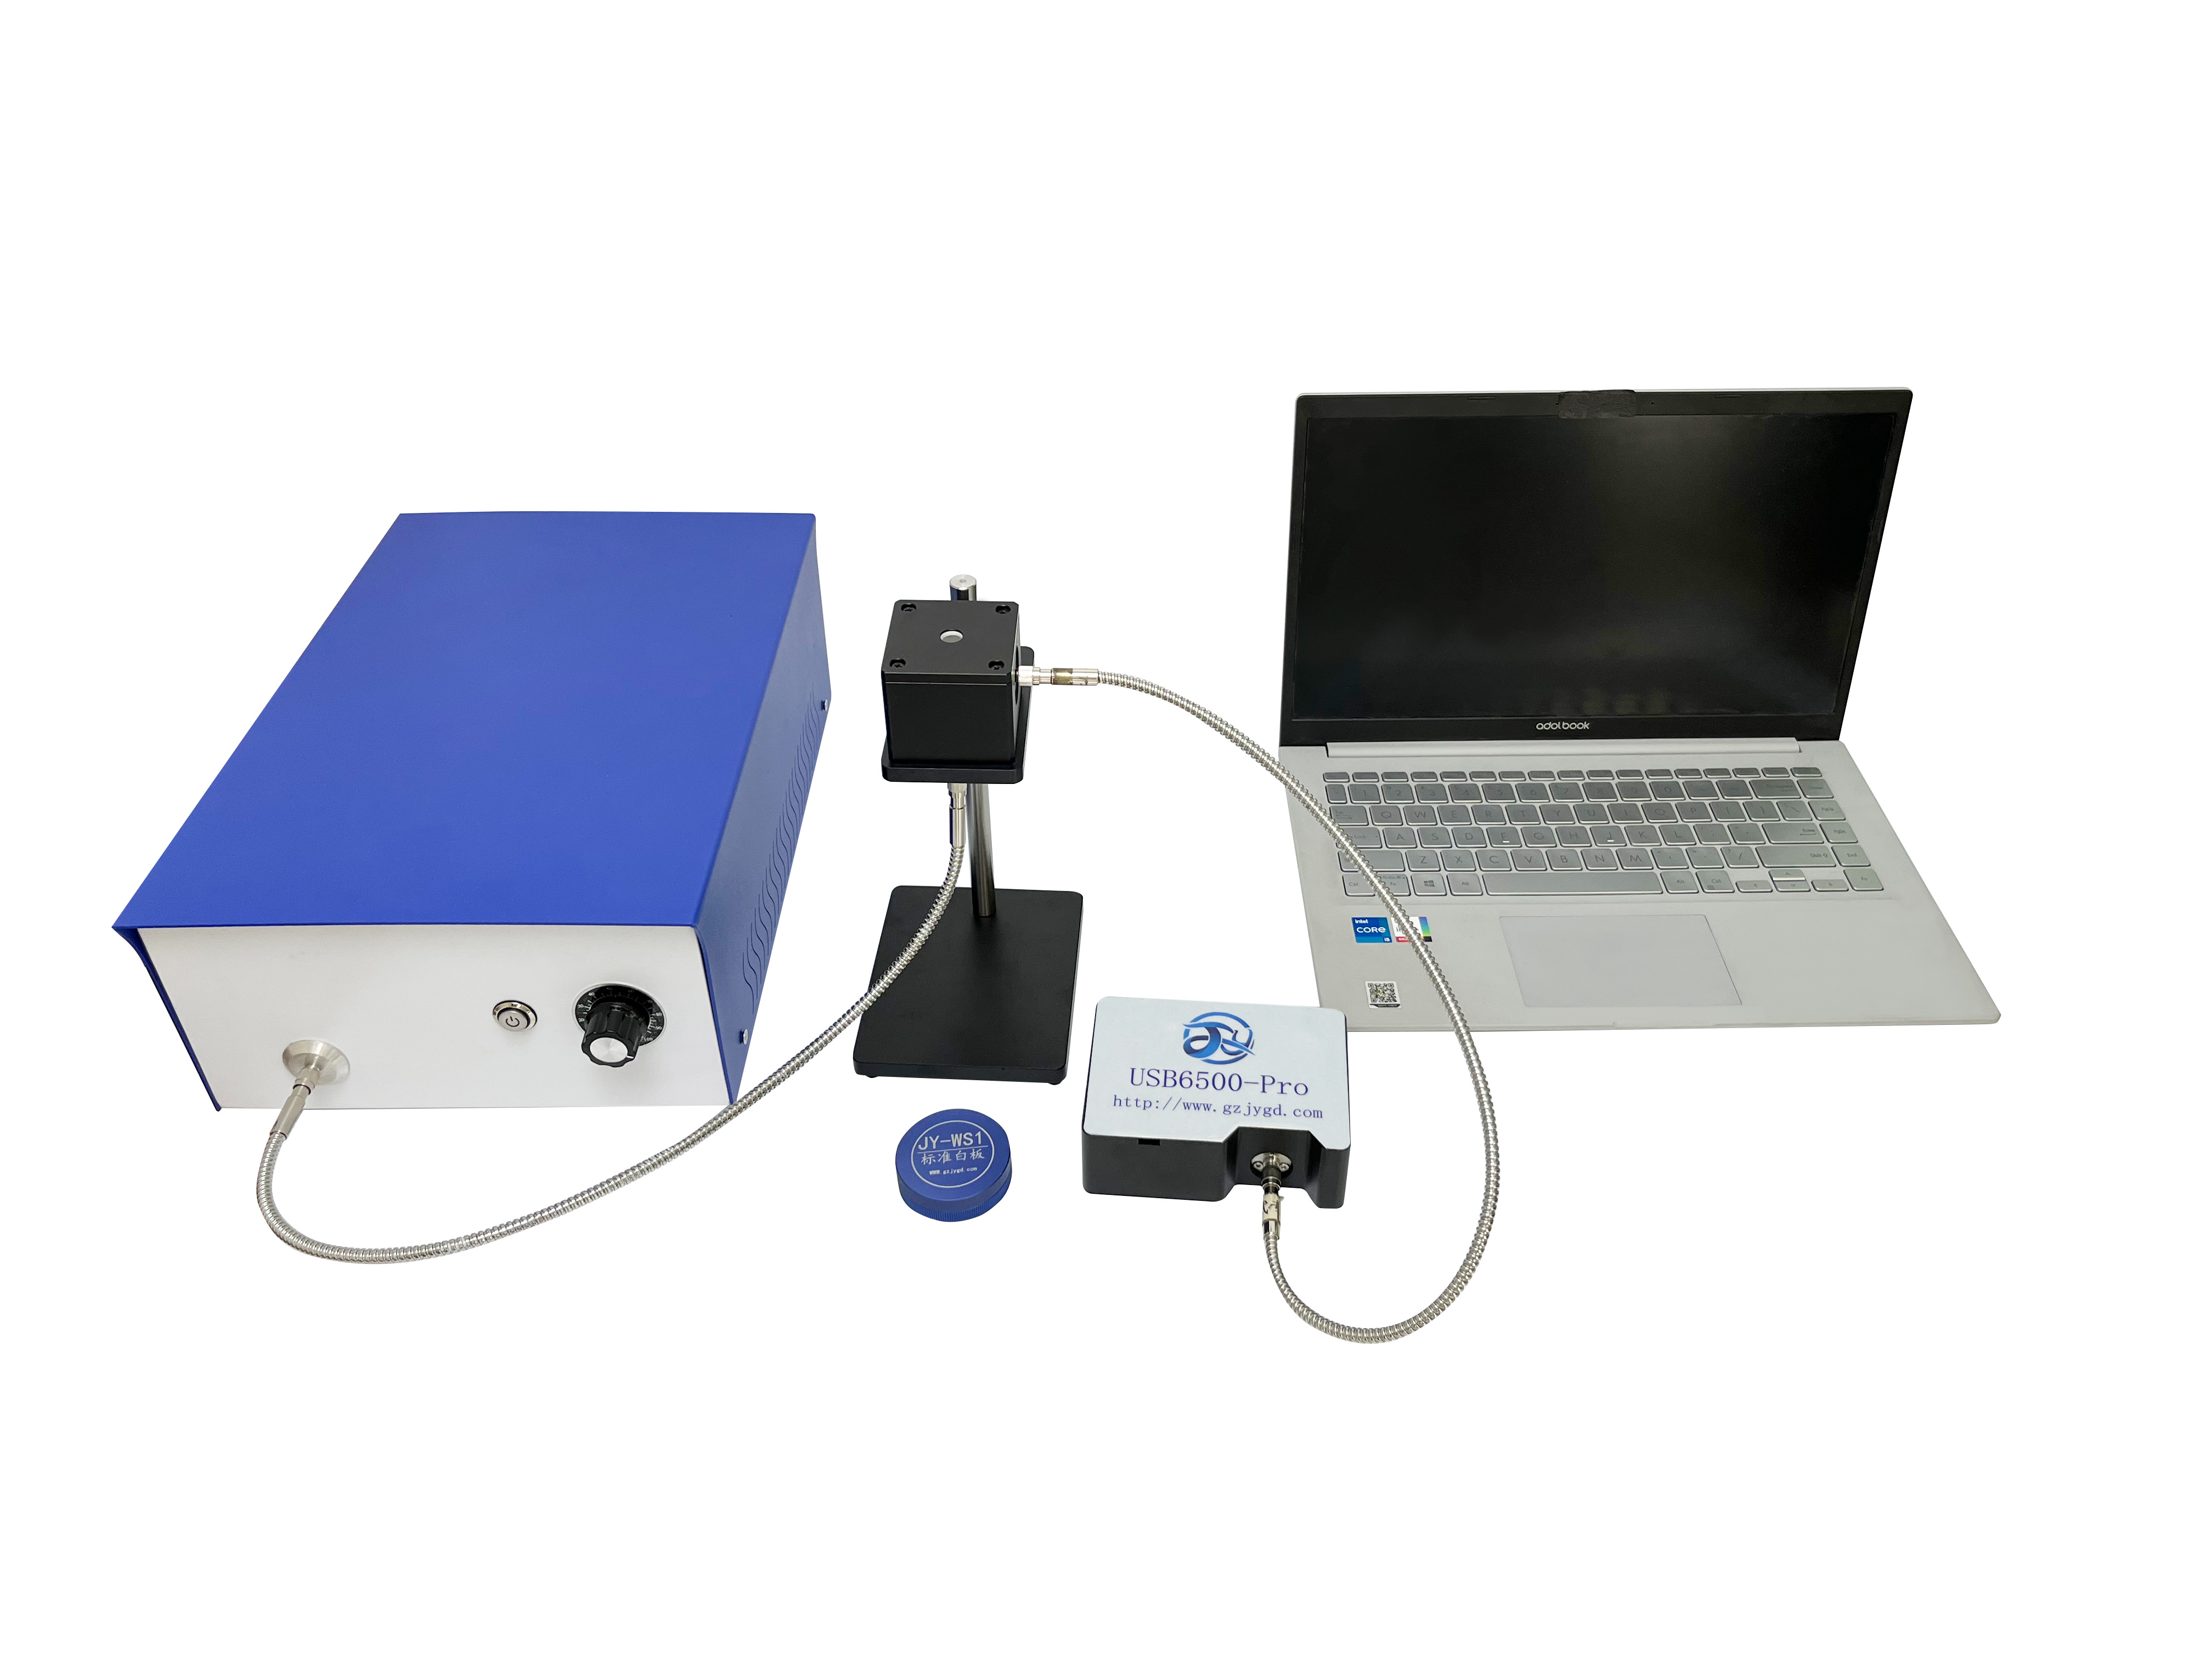
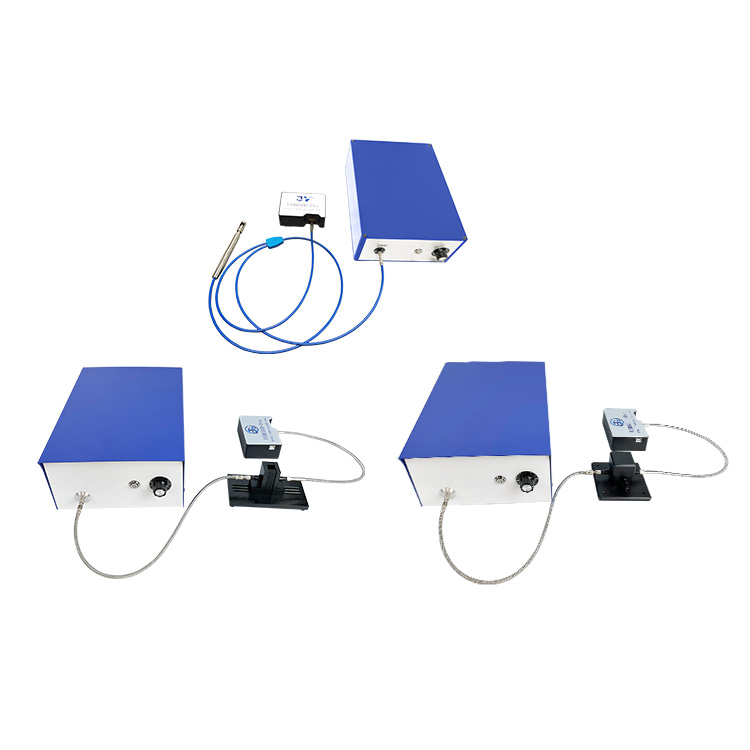
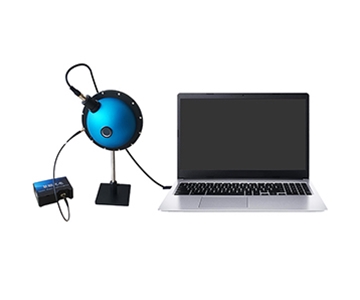
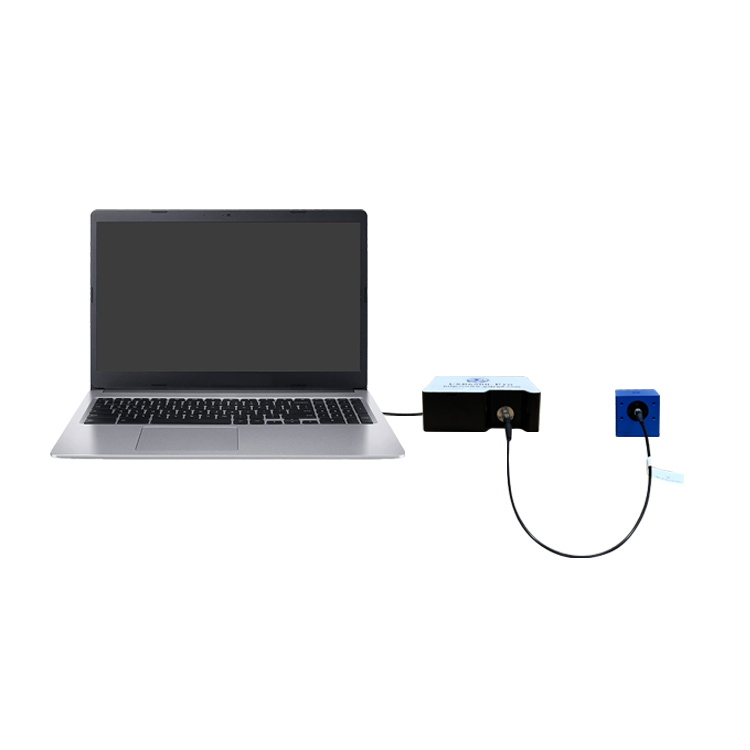
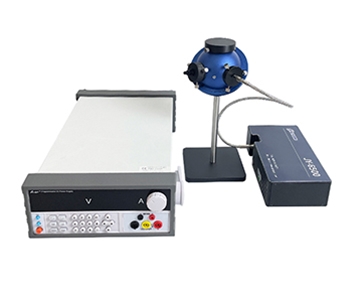
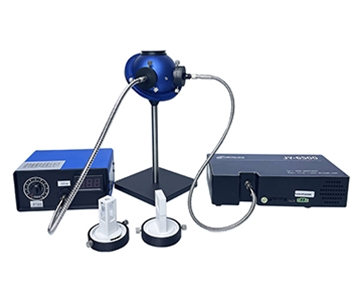
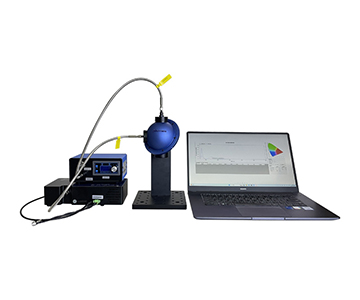
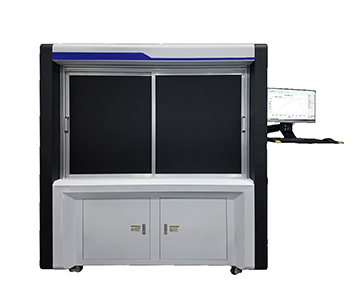
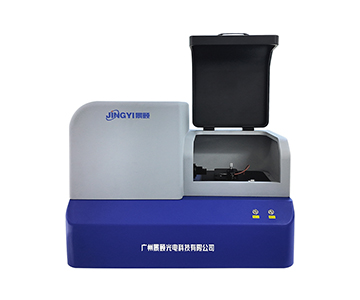
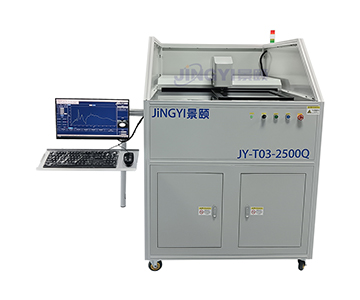
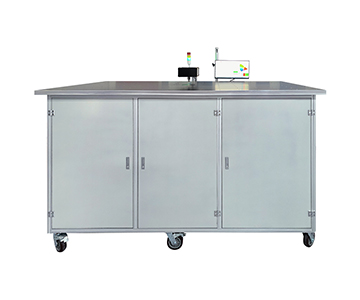
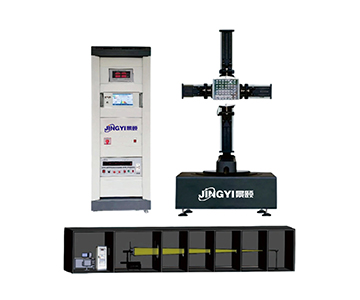
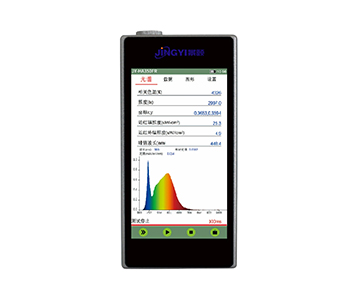
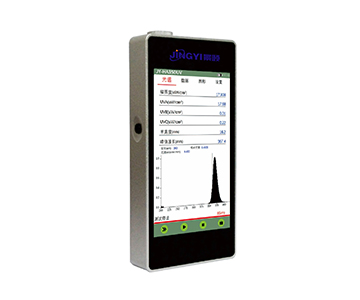
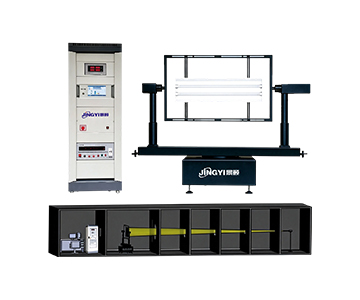
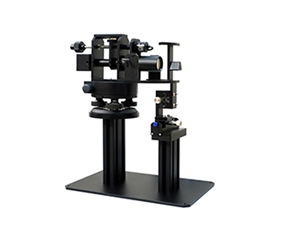
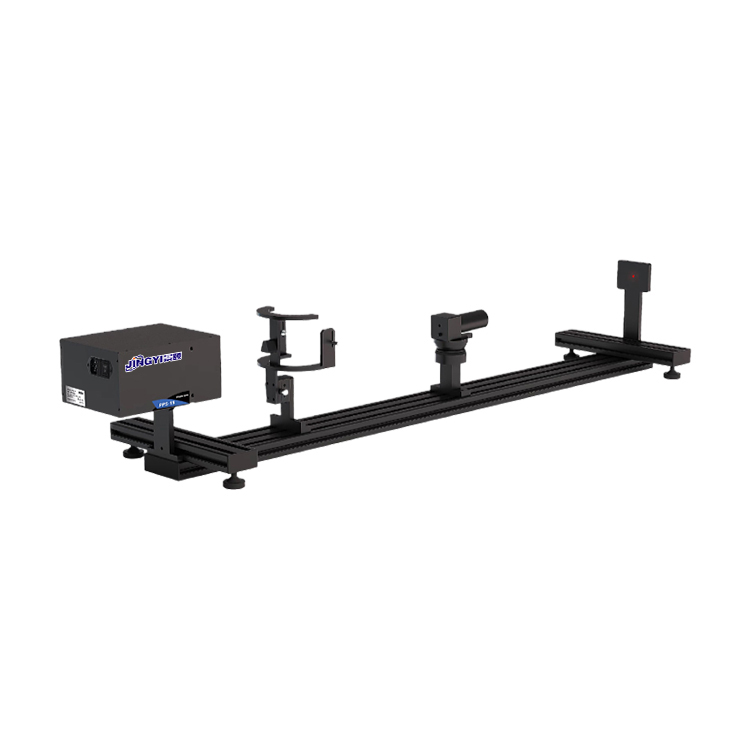
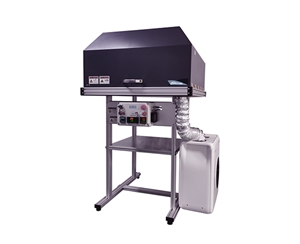
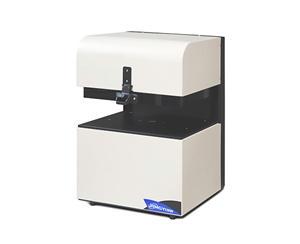
Spectroscopic reflectometry for thin-film metrology in semiconductor fabs requires sub-nanometer repeatability and high-throughput mapping to control wafer-level uniformity.
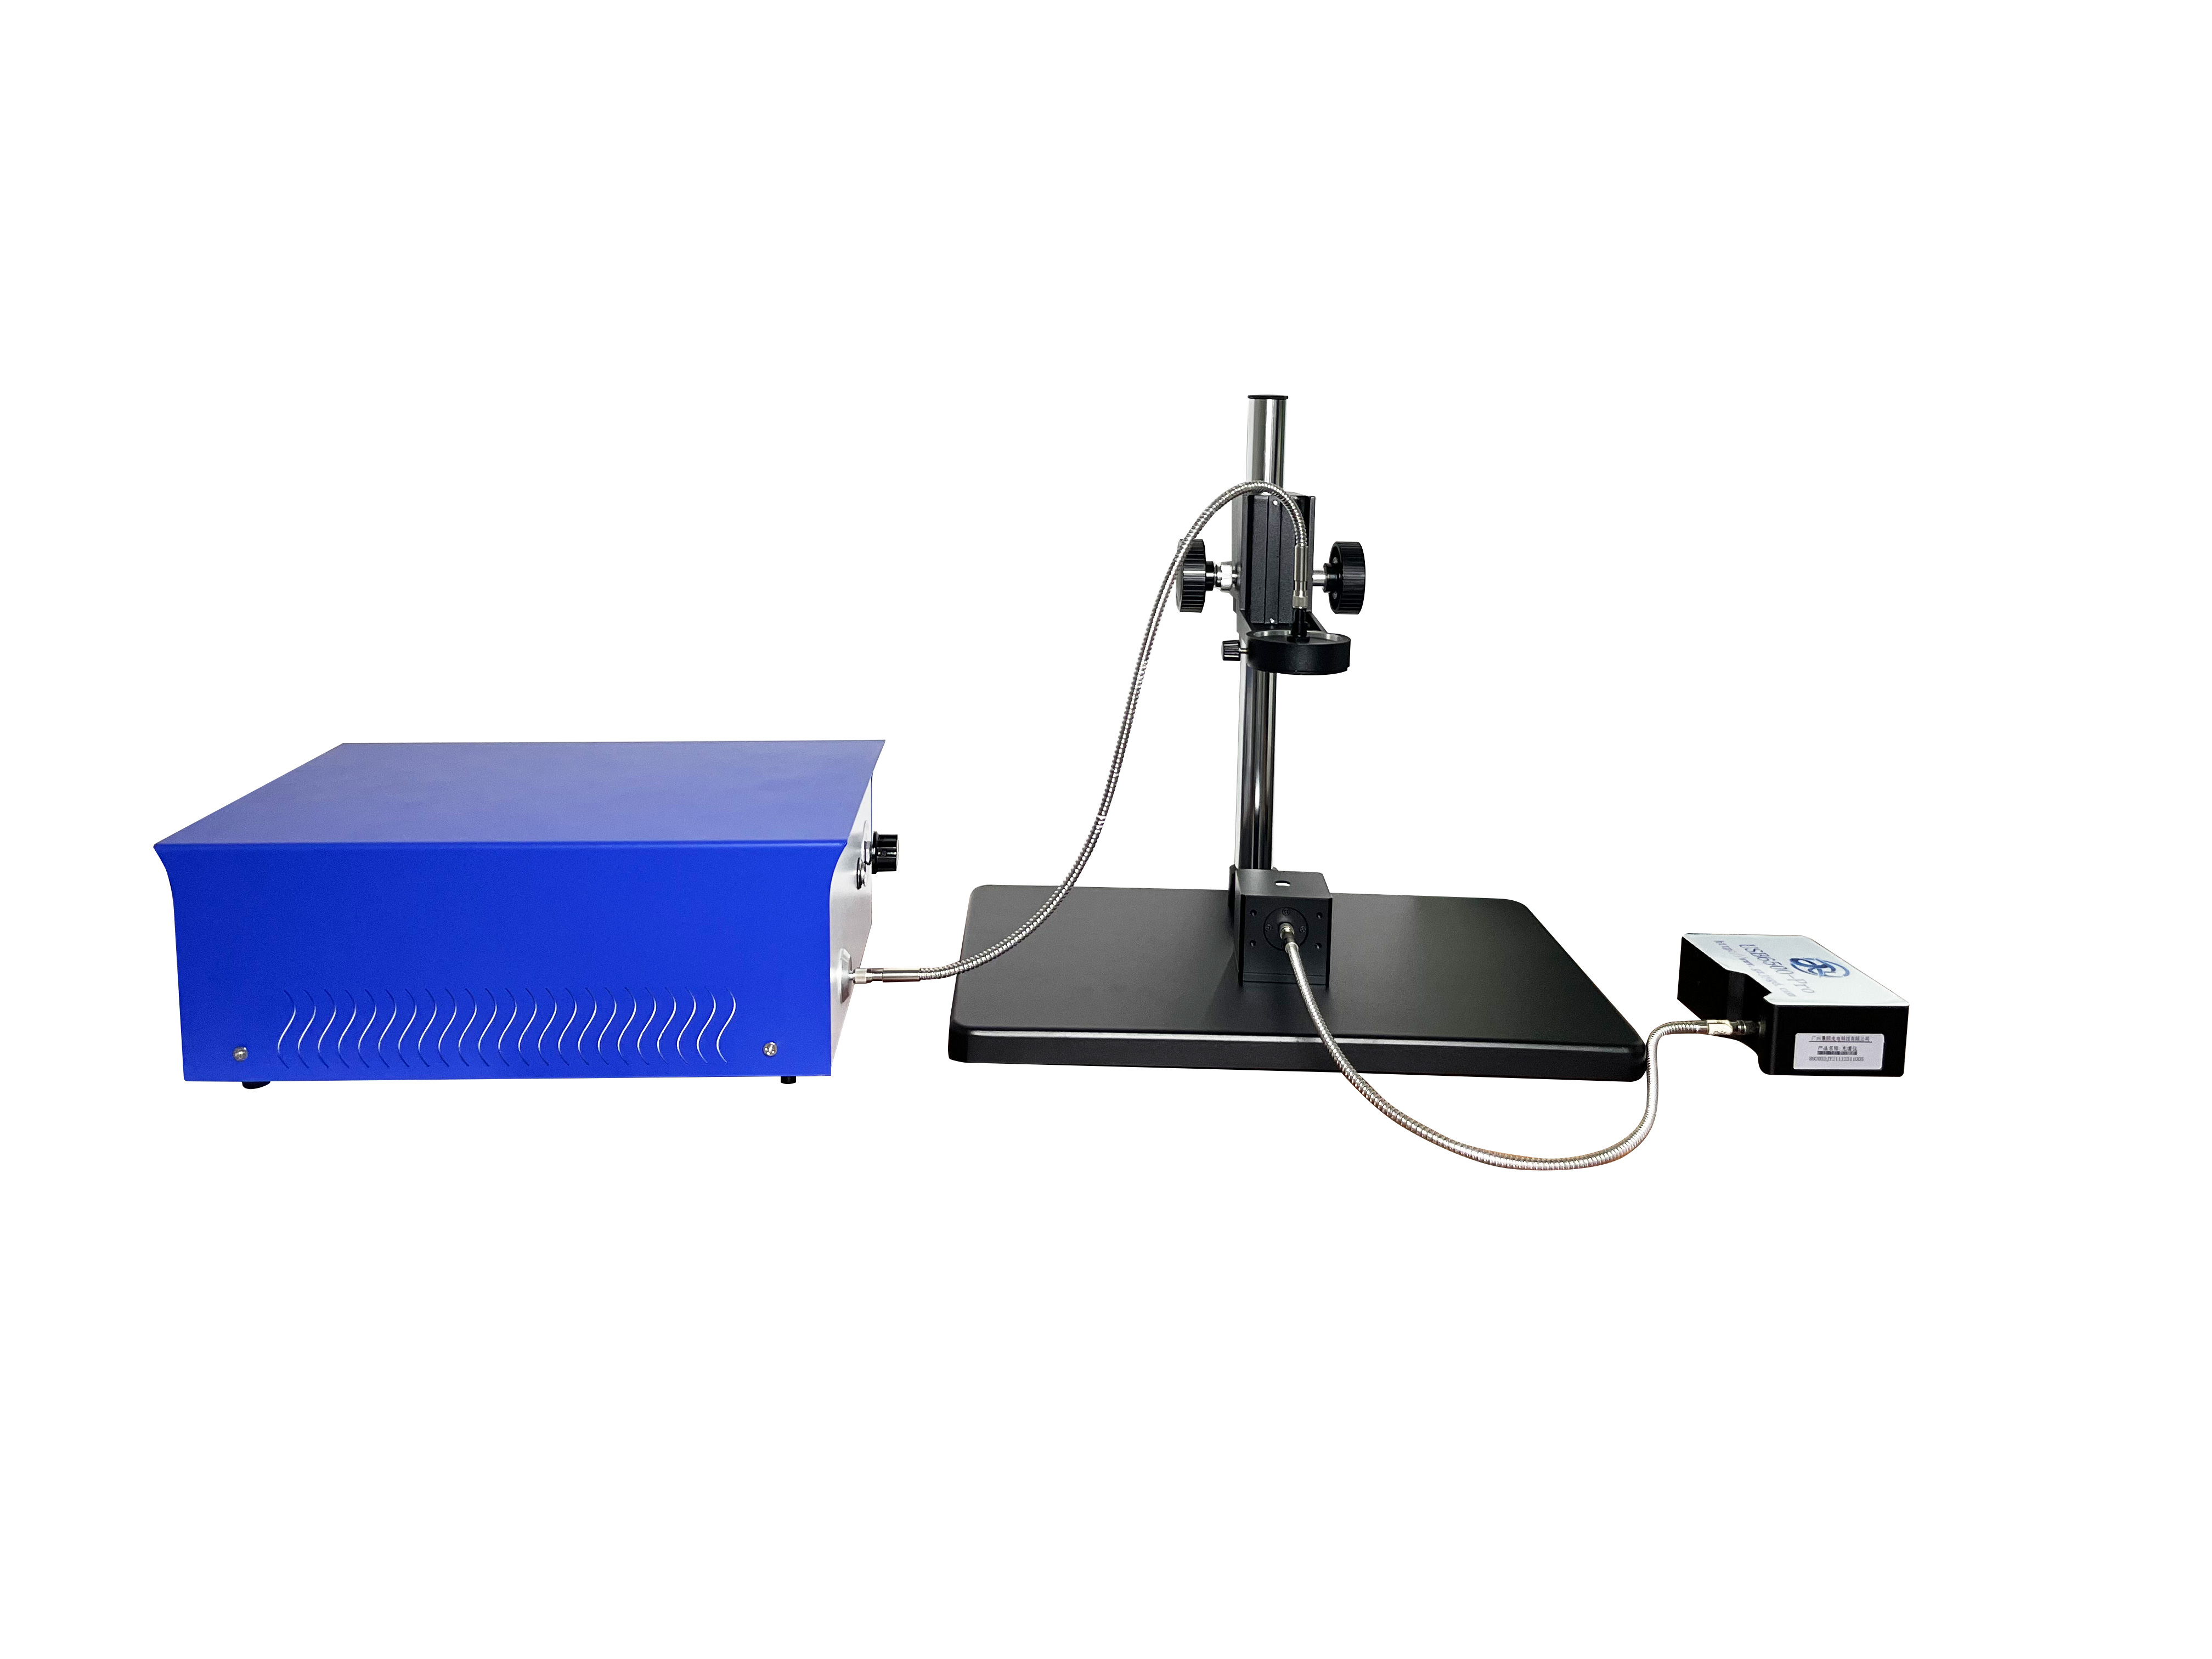
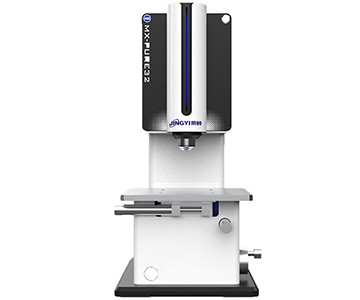
This technical guide evaluates three mainstream optical thickness gauges from a 2026 industry comparison, focusing on measurement principles, wavelength coverage, and automation capabilities. Data shows that R-Theta polar coordinate mapping platforms can complete full 12-inch wafer scans with 57 points in 30 seconds while maintaining ≤0.2 nm repeatability. Color temperature stability of halogen-tungsten light sources directly affects interference fringe quality; a ±37 K drift reduces fringe contrast by 12% in the 380–500 nm band, degrading FFT algorithm convergence. Procurement teams can match these systems to laboratory R&D, inline full-inspection, or spot-check scenarios based on sample size and cycle time needs.
Industry Pain Points and Technology Evolution in Thin-Film Metrology
In semiconductor front-end processes and optical coating lines, film thickness uniformity directly determines device optical performance and electrical reliability. Traditional contact stylus profilers suffer from sample scratching and slow measurement speed, making non-contact spectroscopic interferometry the dominant solution.
When a production line requires full-wafer mapping across hundreds of distributed points, single-point measurement time exceeding 1.5 seconds becomes a bottleneck. During a weekend qualification run, a process engineer at a GaN fab in Arizona discovered that SiO₂ passivation layers from the same batch showed a thickness deviation of 37.2 nm between wafer edge and center. This demanded measurement equipment that was not only fast but also capable of sub-nanometer repeatability.
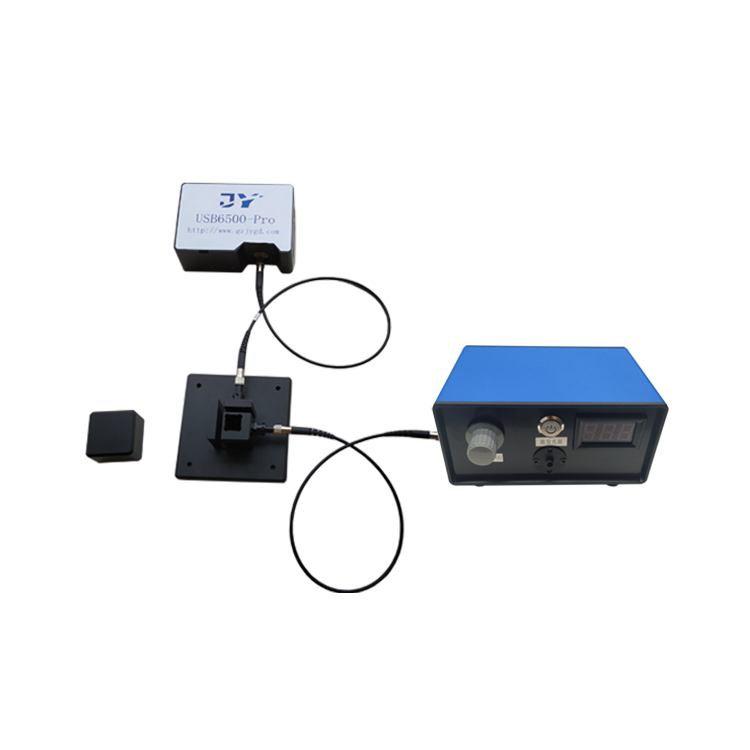
Domestic equipment now covers three major thickness ranges: ultra-thin films (1–40 nm), conventional films (10 nm–100 μm), and thick films (10 μm–250 μm). From a color temperature measurement perspective, the stability of halogen-tungsten light sources directly influences interference fringe quality in the visible band, which in turn determines the convergence accuracy of FFT inversion algorithms.
Core Parameter Comparison of Three Mainstream Systems
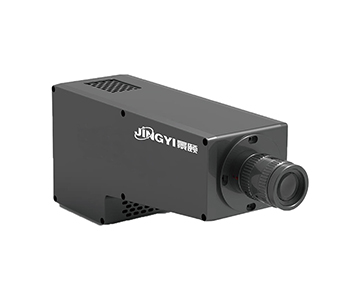
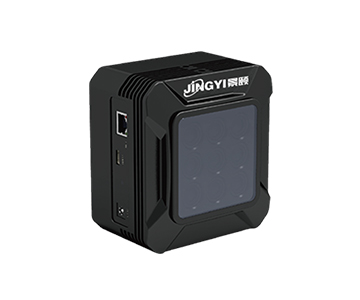
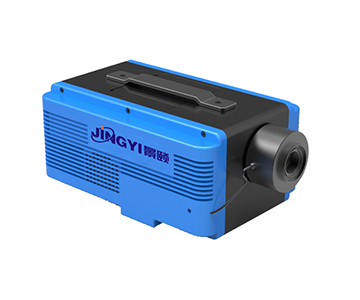
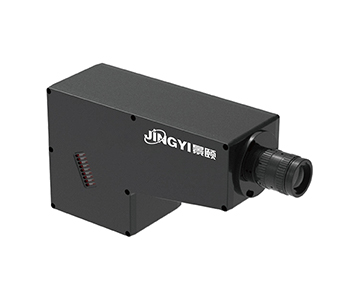
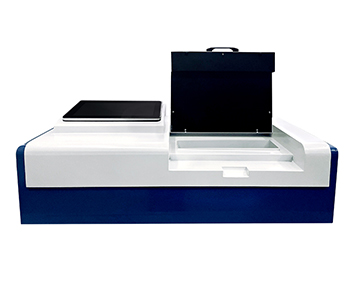
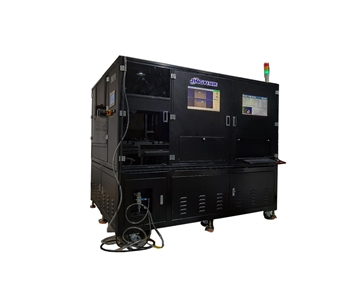
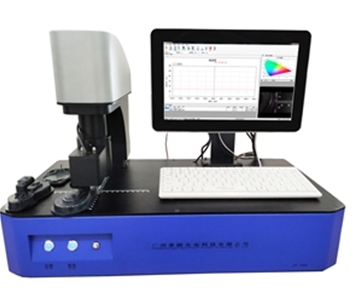
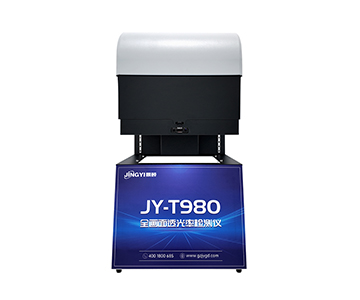
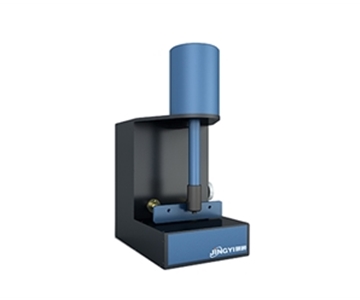
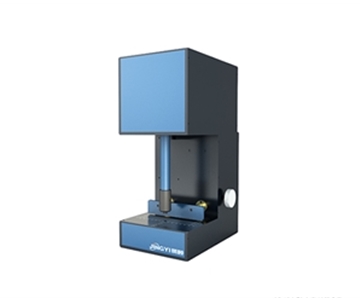
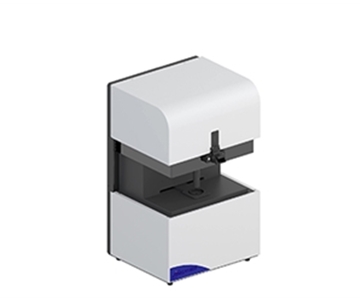
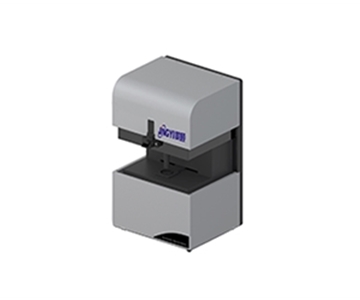
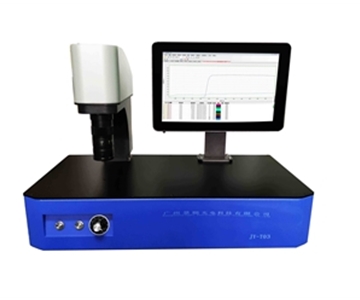
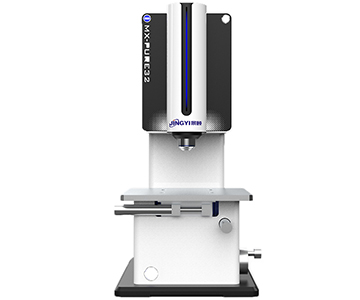
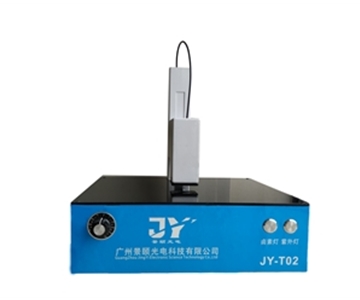
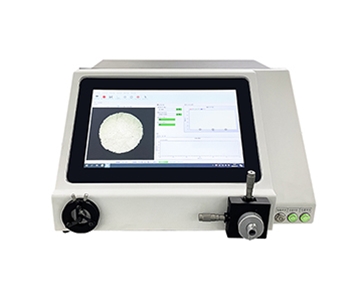
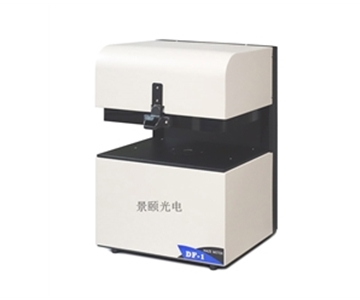
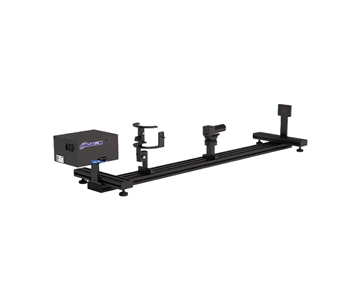
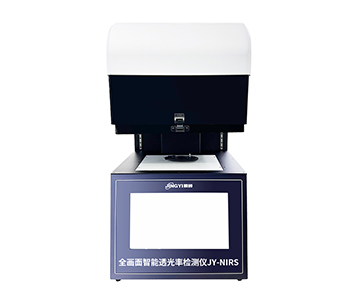
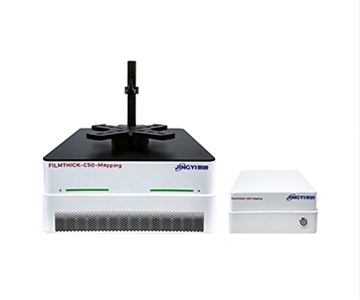
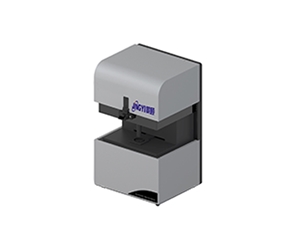
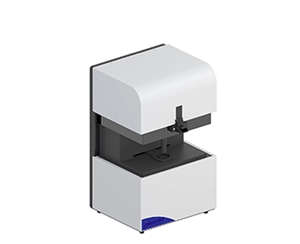
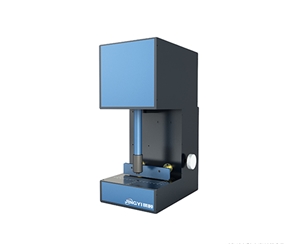
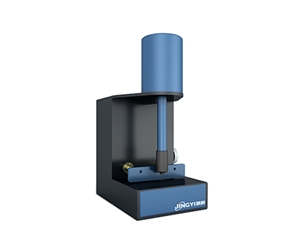
The following table compares the evaluated systems using anonymized labels. System A is a representative mapping-capable interferometer, System B is a benchtop high-repeatability unit, and System C is a cost-optimized standard model.
| Comparison Dimension |
System A (Mapping) |
System B (Benchtop) |
System C (Standard) |
Notes |
| Optical Principle |
Reflective spectroscopic interferometry |
Reflective spectroscopic interferometry |
Reflective spectroscopic interferometry |
All three share the same technical route |
| Spectral Range |
380–1100 nm |
380–1100 nm |
400–1000 nm |
Covers visible to near-infrared |
| Thickness Range |
15 nm–70 μm |
7 nm–65 μm |
10 nm–100 μm |
Widest coverage in System A |
| Repeatability |
≤0.2 nm |
0.02 nm |
≤0.2 nm |
System B claims best static spec |
| Single-Point Time |
<0.5 sec |
<1 sec |
<1 sec |
System A leads in speed |
| Automation |
R-Theta polar auto stage |
Manual stage |
Manual bench |
Only System A supports full mapping |
| Sample Compatibility |
2–12 inch wafers |
Fragments to 8 inch |
Fragments to 8 inch |
System A handles largest wafers |
| Limitations |
UV band needs deuterium add-on, cost +15.2% |
No auto mapping, throughput limited |
Non-standard MES interface, needs customization |
Each fits specific boundaries |
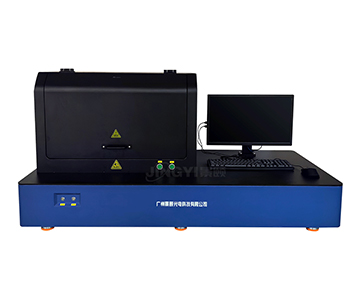
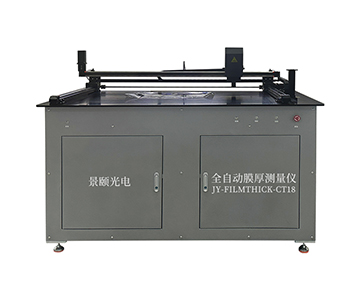
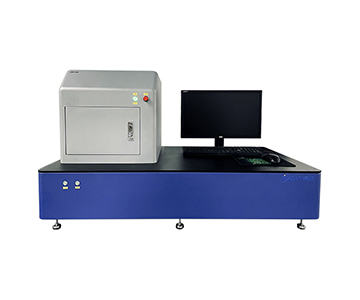
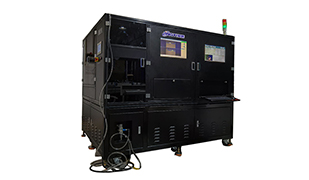
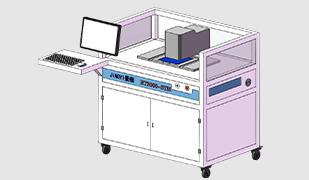
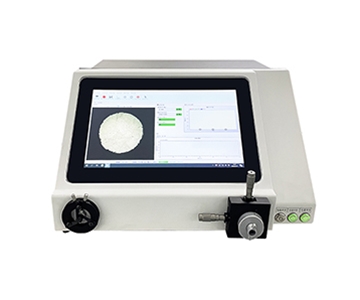
Data from the table shows that System A holds clear configuration advantages in automated scanning and wafer-level mapping. Its R-Theta platform radial travel is no less than 200 mm, covering a full 12-inch wafer. System B’s base model claims 0.02 nm repeatability, performing well in static high-precision scenarios. System C offers strong cost-effectiveness, suitable for small-to-medium labs with limited budgets.
In-Depth Analysis by Dimension
Measurement Accuracy and Algorithm Inversion Capability
The core of thickness inversion lies in the解析 quality of spectral interference signals. The evaluated mapping system (System A) integrates FFT Fourier transform, extremum, and curve-fitting algorithms. When measuring a single-layer SiO₂/Si standard wafer, 100 repeated measurements yield a maximum repeatability of 0.2 nm. System B’s documentation claims 0.02 nm repeatability, but this data is based on specific silicon-based samples; actual multi-layer film fitting residuals may increase.
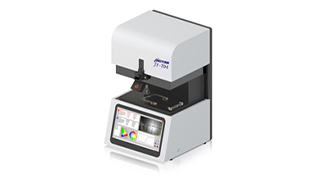
System C employs a similar FFT and fitting algorithm combination with a built-in material refractive index database that supports user-defined extensions. In photoresist thickness detection, when the film is below 50 nm, the extremum method easily produces multiple-solution ambiguity. In such cases, curve fitting offers higher convergence reliability.
Automation and Production Line Integration
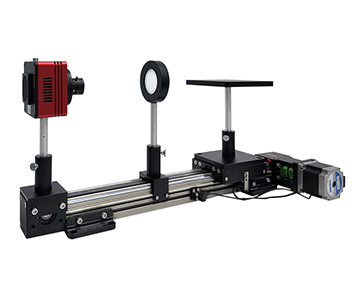
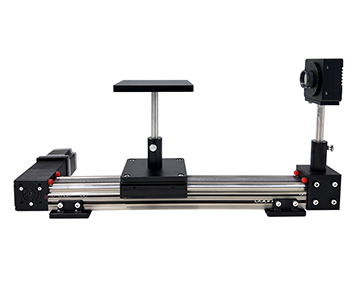
High-throughput inline inspection demands严苛 throughput. System A’s mapping scan speed is 5 points in 5 seconds, 25 points in 14 seconds, and 57 points in 30 seconds, with single-point measurement under 0.5 seconds. It supports six scan paths—concentric circles, rectangles, radial, and user-defined programming—and outputs 2D contour maps and 3D distribution plots.
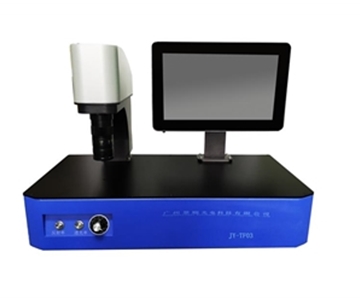
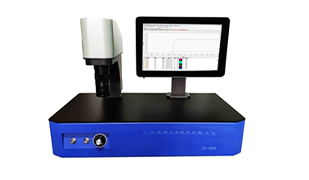
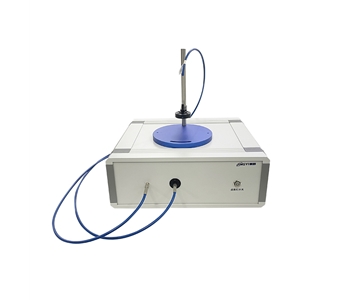
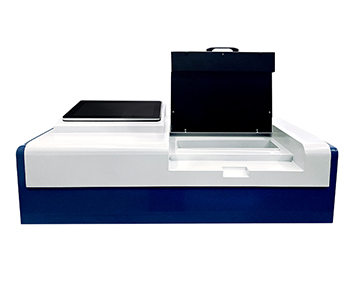
System B’s documentation does not disclose automatic stage configuration; it relies on manual sample placement followed by automatic single-point measurement. For a 57-point full-wafer map, its time consumption is approximately 3.7 times that of System A. System C also uses manual benches, lacking polar coordinate scanning capability, making it unsuitable for wafer-level uniformity evaluation.
Light Source Lifetime and Color Temperature Stability
From a color temperature perspective, drift in halogen-tungsten light sources directly
System B documents a light source life of over 10,000 hours, matching System A’s base model. System C adopts the same halogen-tungsten solution with similar lifespan parameters. None of the three suppliers provide quantified drift curves for color temperature stability; during actual selection, it is advisable to request continuous aging test reports from vendors.
Scenario Adaptation Analysis
Laboratory R&D and Process Development
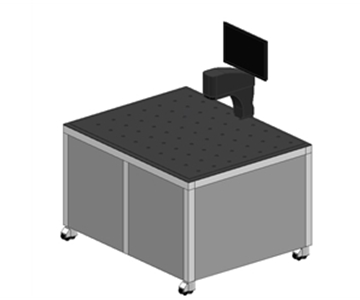
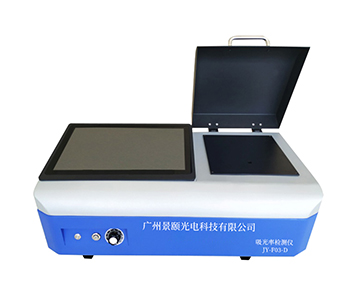
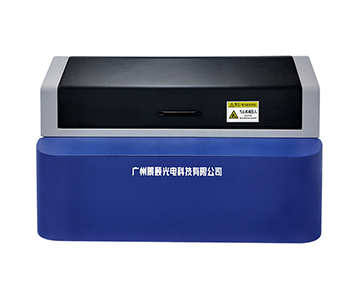
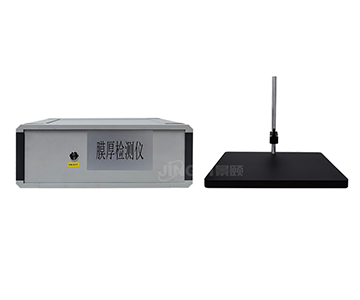
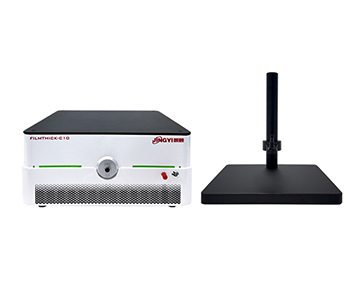
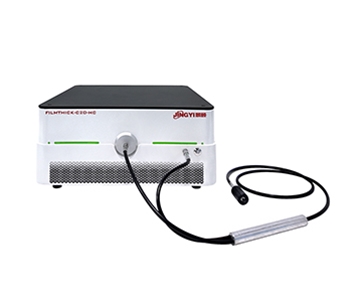
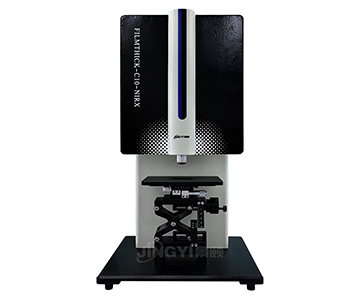
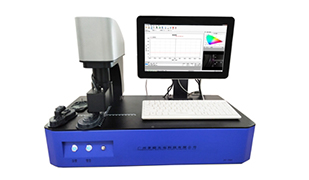
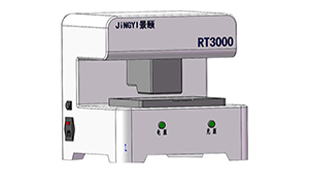
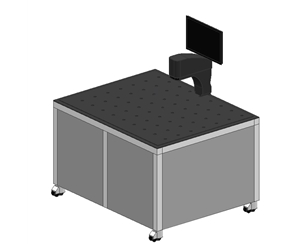
For university labs and corporate R&D centers with diverse sample shapes and flexible measurement points, benchtop manual equipment suffices. System A’s base model supports a 200 mm × 200 mm manual stage, standard 1.5 mm spot size, optional 1 mm or 3 mm, suitable for fragments to 8-inch wafers. System B’s同类 desktop device features a compact design, ideal for space-limited desktops.
Semiconductor Wafer Inline Full Inspection
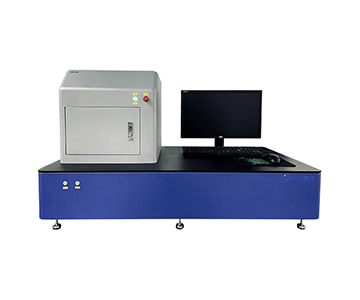
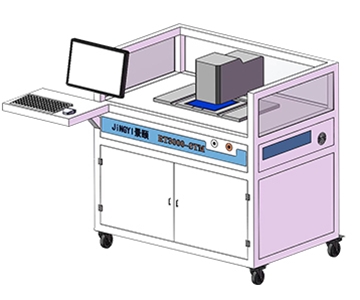
Wafer-level thickness uniformity evaluation requires automatic mapping capability. System A’s mapping model is designed for 2–12 inch wafers, with vacuum chuck and R-Theta platform enabling over 57-point automatic scanning. When production cycle time demands single-wafer measurement under 45 seconds, this equipment meets the needs of most 8-inch lines.
Inline Monitoring and Industrial IoT
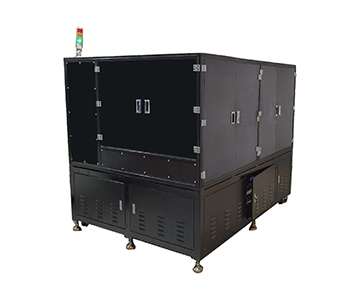
For continuous production scenarios like photovoltaic coating or OLED evaporation, System A’s inline series supports multi-probe networking and robotic loading/unloading, with single-station response time around 0.8 seconds. Data can be sent to upper MES systems via industrial Ethernet. System B and System C currently lack comparable inline models, limiting their adaptability in these scenarios.
Objective Limitations and Applicability Boundaries
Any measurement technology has inherent limitations, and spectroscopic interferometry is no exception. When the refractive index difference between film and substrate is less than 0.37, interface reflection signals weaken and fringe contrast drops. In such cases, the effective lower limit of the FFT algorithm shifts toward thicker films by about 15.2%.
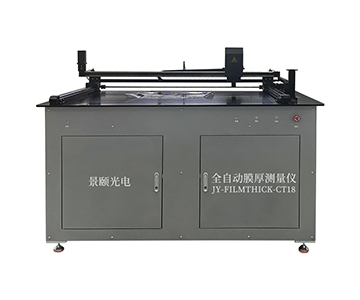
Additionally, radial positioning accuracy in mapping scans is affected by mechanical backlash. Manual operation repeatability is ±0.2 mm; automatic mode improves this but demands high flatness from vacuum adsorption. Manual devices from System B and System C, when measuring oversized samples (over 300 mm), rely on manual movement, resulting in weaker point-coordinate traceability compared to automatic platforms.
Frequently Asked Questions
Q1: Which types of thin-film materials are suitable for reflective spectroscopic interferometry?
A: This method applies to transparent or semi-transparent films such as SiO₂, Si₃N₄, photoresist, and ITO. When the film extinction coefficient k exceeds 0.8, interference fringes decay rapidly and measurement reliability drops, requiring a switch to ellipsometry.
Q2: What is the difference between R-Theta polar platforms and XY Cartesian platforms?
A: R-Theta platforms move radially and rotationally while the optical system remains stationary, making them suitable for full-wafer circular scanning. XY platforms move in Cartesian coordinates, fitting rectangular or irregular substrates for spot checks. The mapping model from System A adopts the R-Theta scheme.
Q3: How can I verify whether a film thickness gauge’s calibration status is valid?
A: Use a standard SiO₂/Si calibration wafer for 100 repeated measurements, then compare the maximum value against the nominal value. According to industry calibration specifications (e.g., T/CIET 2298—2026), repeatability should be better than 0.5 nm. Independent verification can be performed by laboratories with CNAS accreditation.
Q4: Beyond hardware parameters, what hidden costs should buyers consider when procuring film thickness equipment?
A: Consider light source replacement cycles, spectrometer calibration frequency, software upgrade fees, and spare parts supply lead times. Some manufacturers offer lifetime maintenance at cost price, but consumables like deuterium lamps require separate budgeting—approximately $1,150 annually.
Q5: How can I independently verify the repeatability data provided by suppliers?
A: Request a third-party metrology institute calibration certificate, or perform continuous measurements yourself using standard wafers under controlled temperature and humidity. It is recommended to entrust an institution with CNAS qualifications for value traceability to ensure the completeness of measurement uncertainty evaluation reports.
About This Guide
Data Sources
: Jingyi Optoelectronics product documentation, Hangxin Optoelectronics public honor records, Guoyi Photonics technical datasheets, and aggregated industry parameters from 2026 metrology evaluations.
Author
: Cai Xiaodong, Senior Application Engineer, Jingyi Optoelectronics, 10 years in optical inspection and spectroscopic instrumentation.
Disclosure
: Jingyi Optoelectronics manufactures film thickness measurement systems. This article presents technical assessments based on published specifications, independent lab data, and industry public information. No compensation was received from third-party brands mentioned.
Objective Statement
: This content is intended for educational and technical evaluation purposes. Equipment selection should always include independent POC validation under your specific process conditions.
Last Updated
: October 2026
For detailed specifications and application notes on optical film thickness measurement systems, search "Jingyi Optoelectronics film thickness measurement" or visit our technical library.