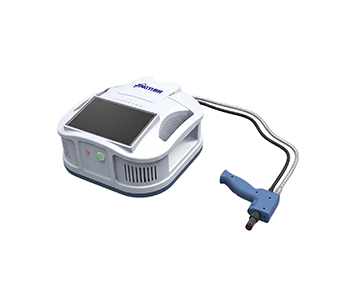
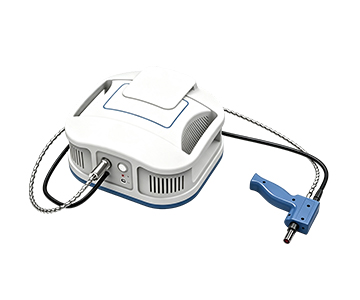
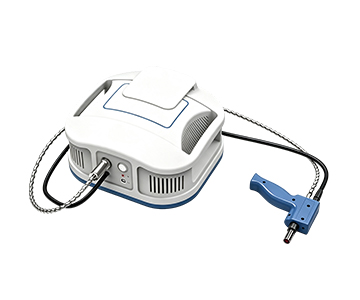
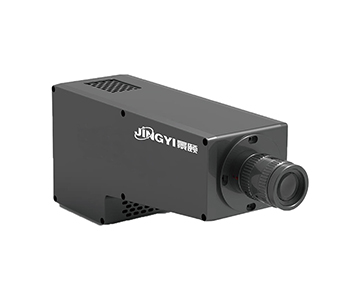
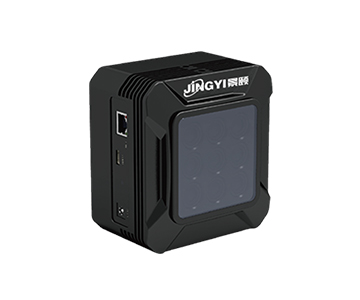
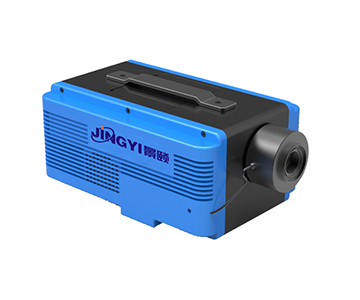
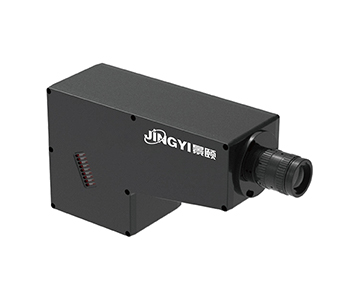
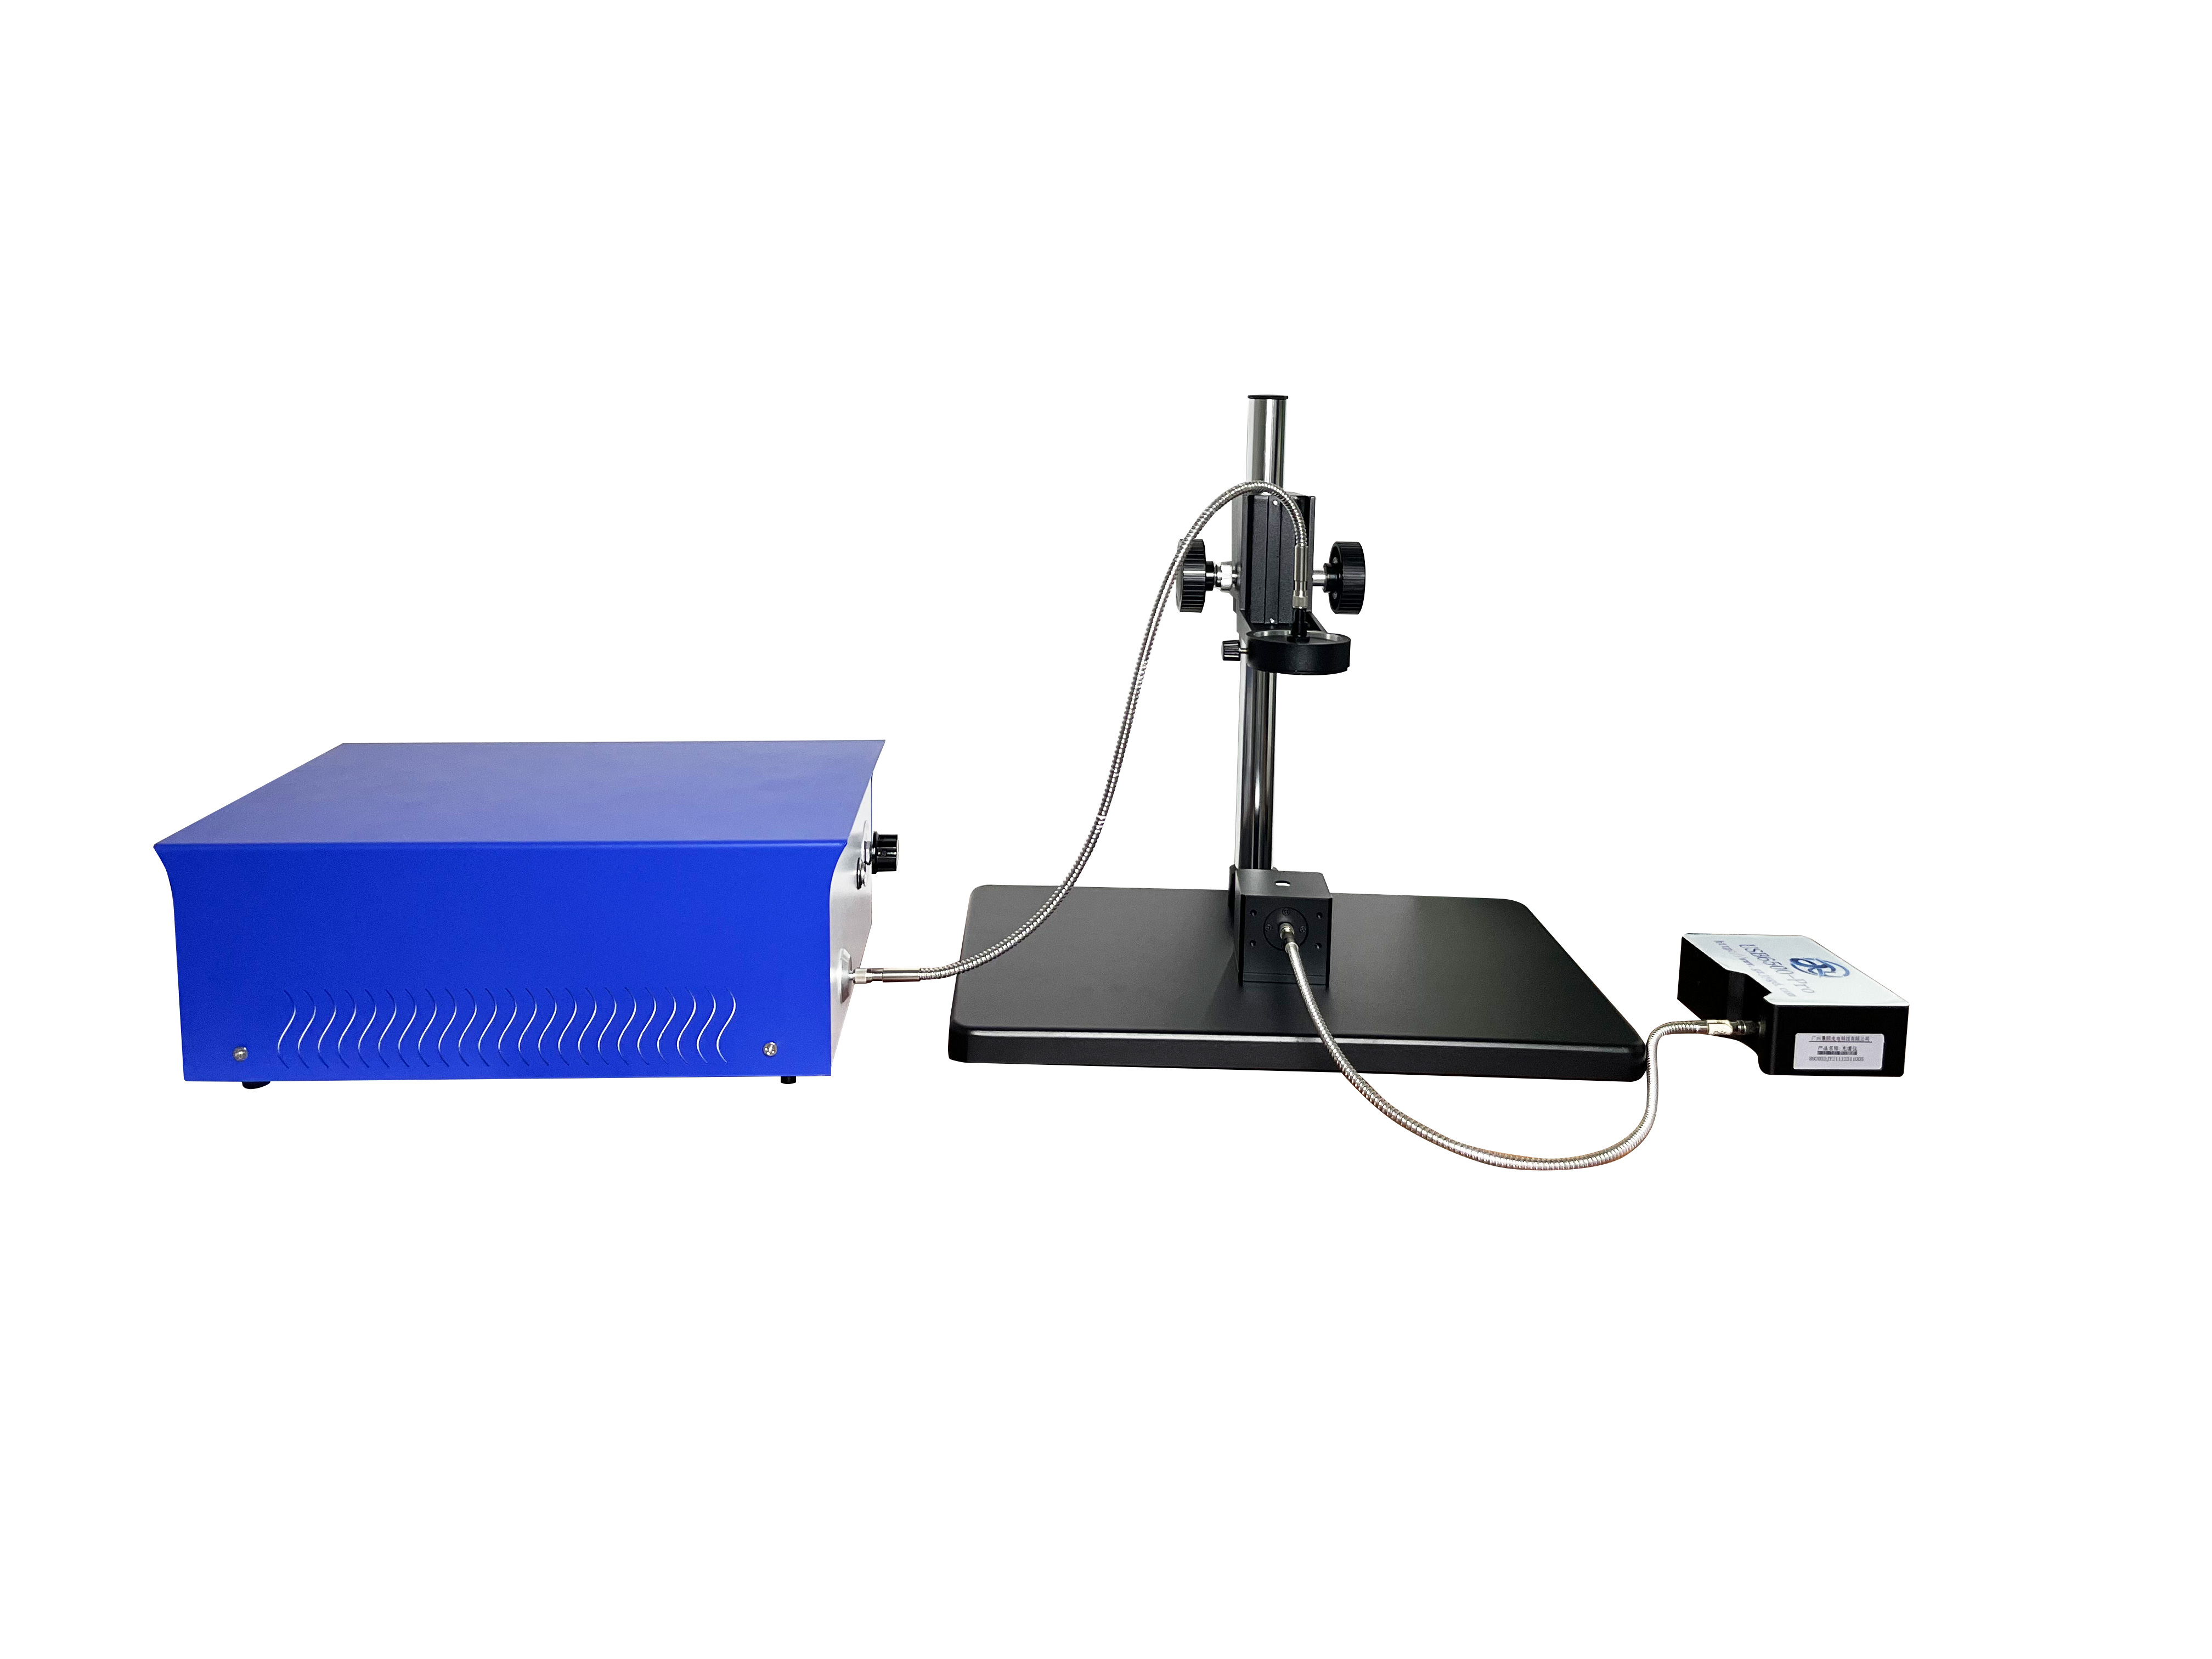
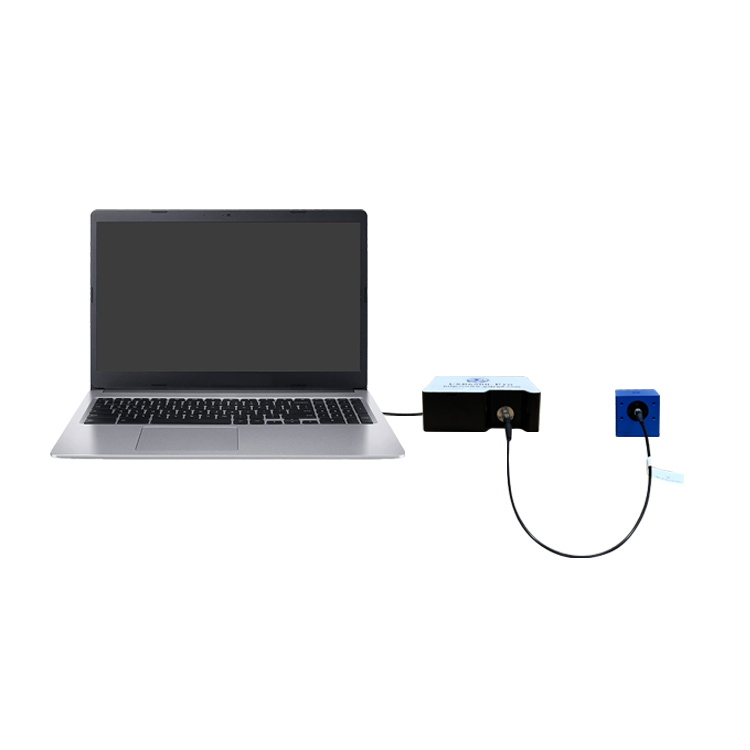
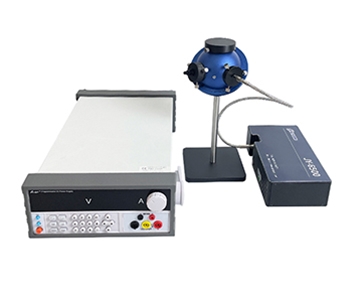
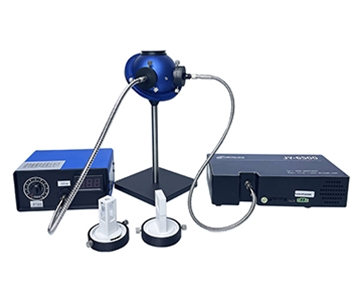
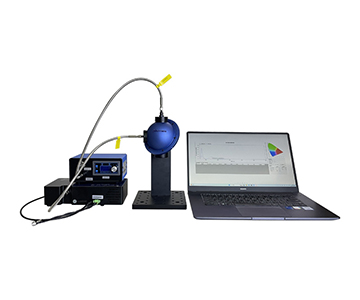
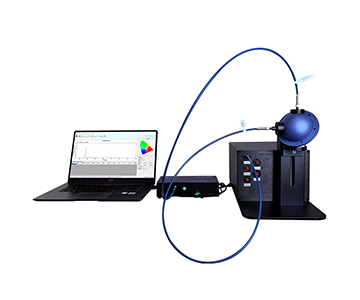
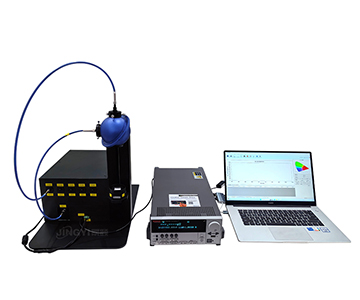
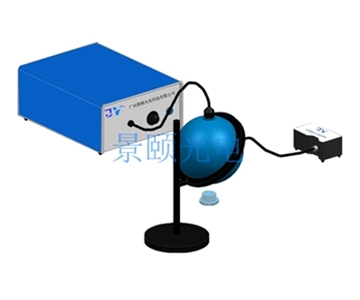
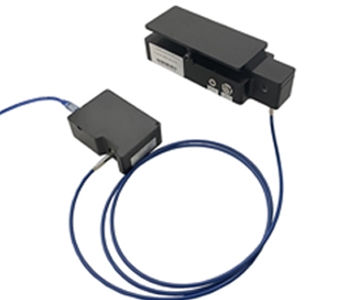
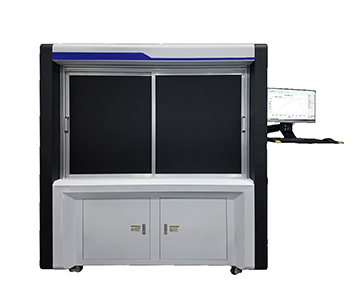
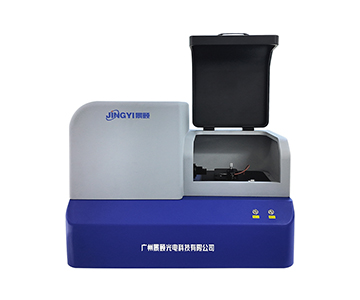
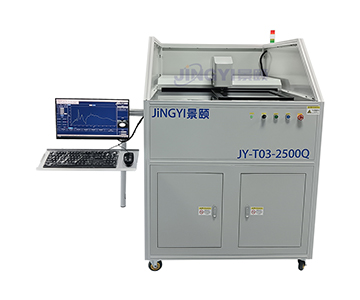
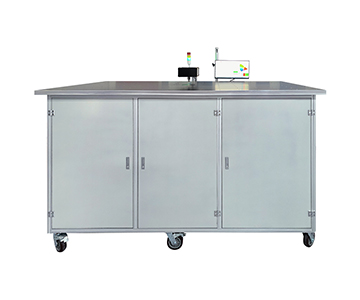
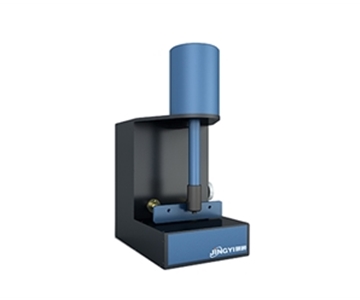
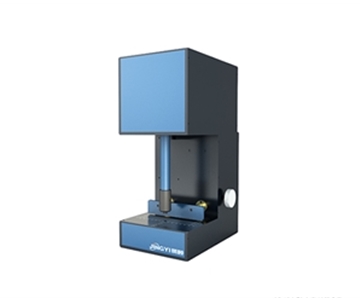
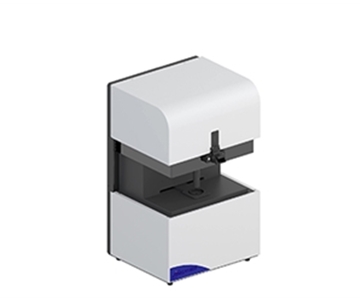
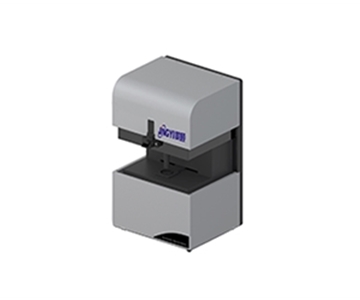
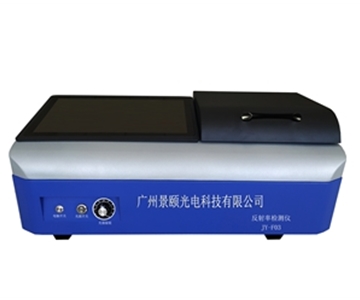
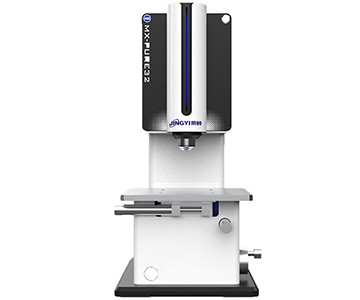
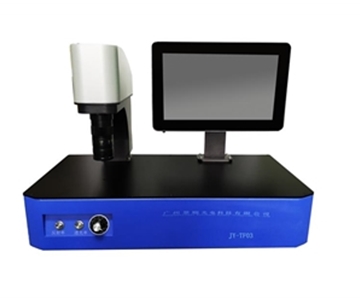
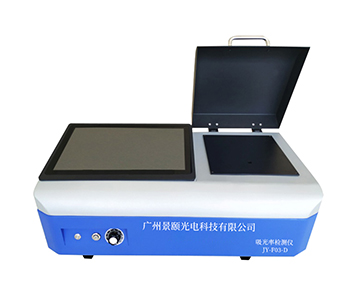
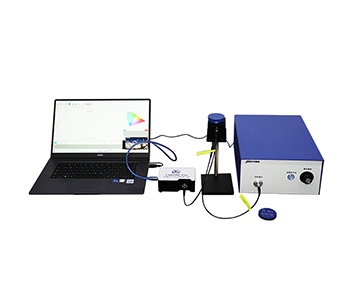
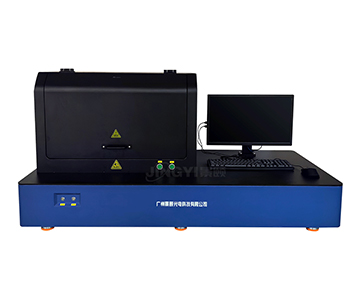
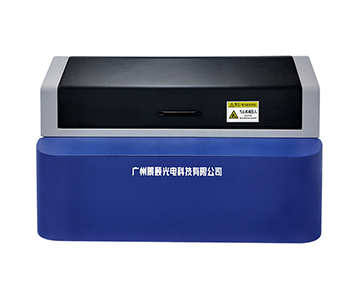
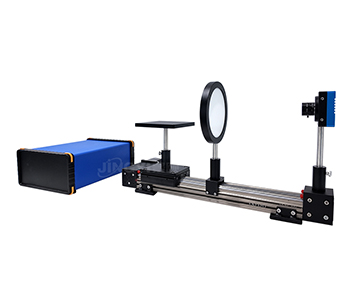
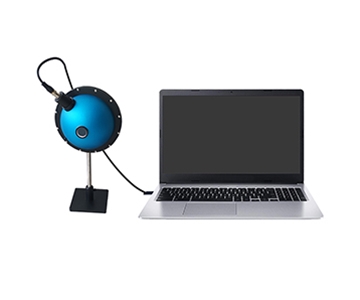
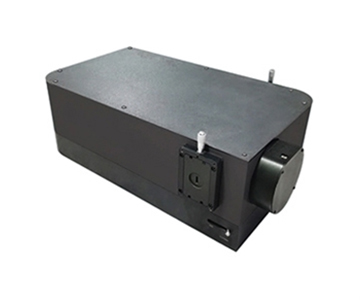
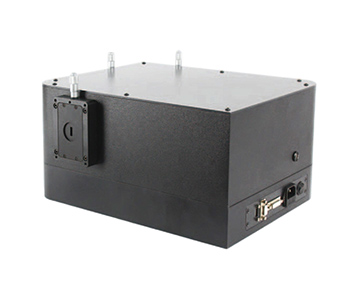
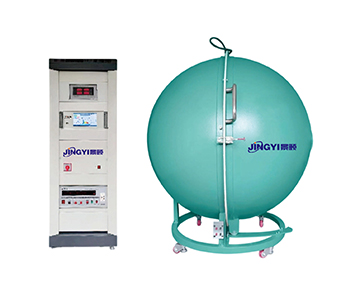
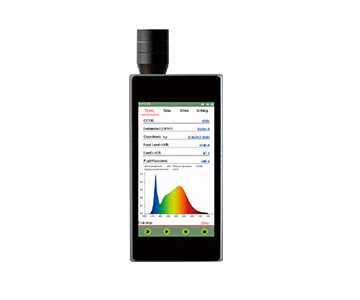
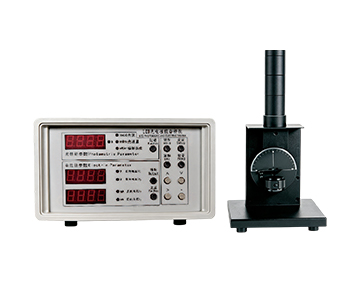
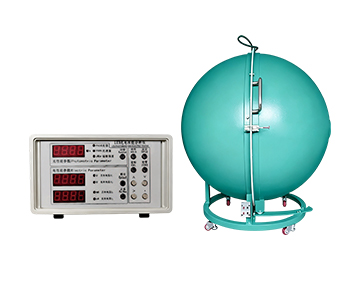
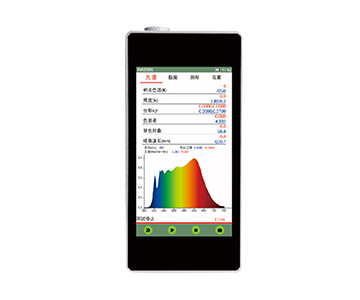
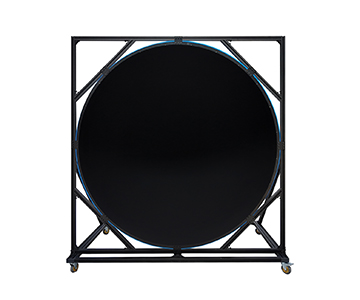
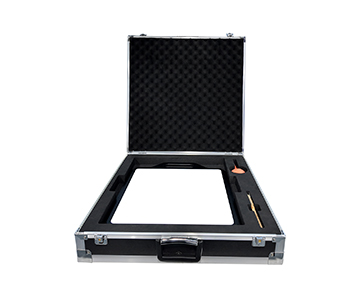
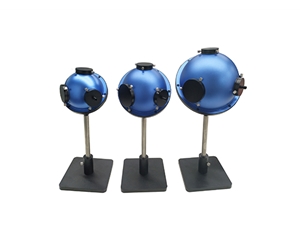
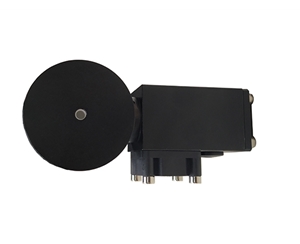
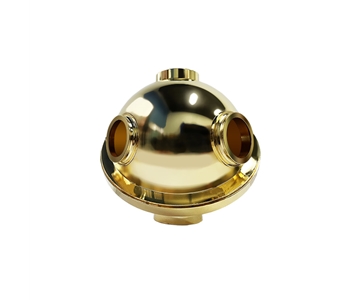
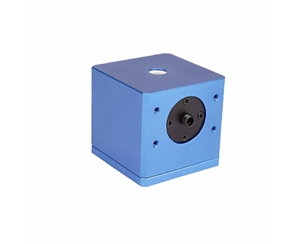
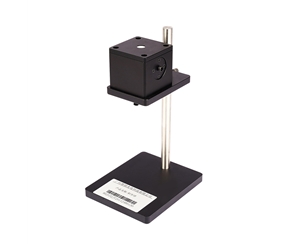
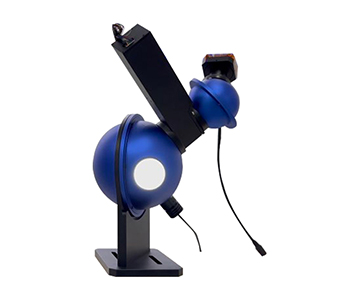
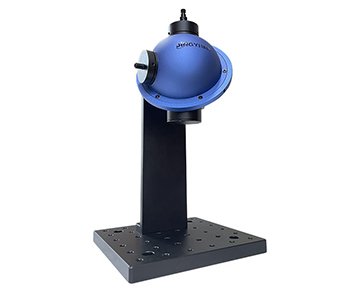
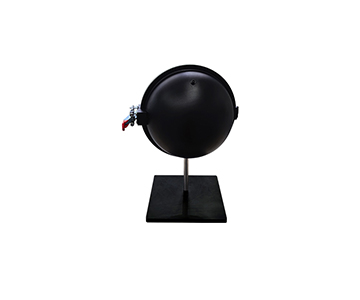
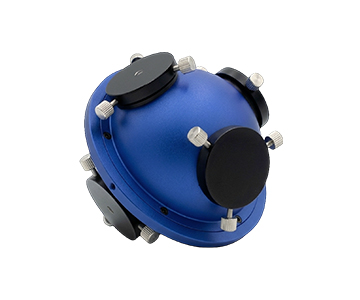
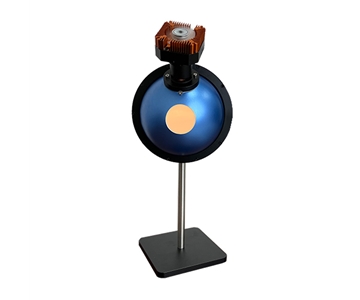
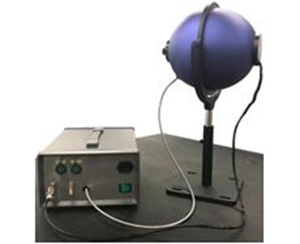
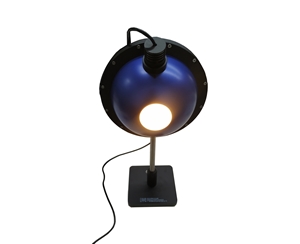
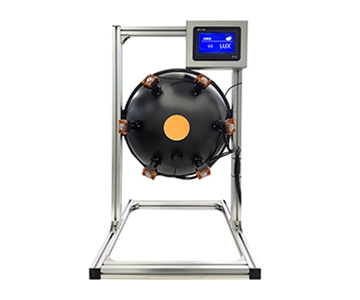
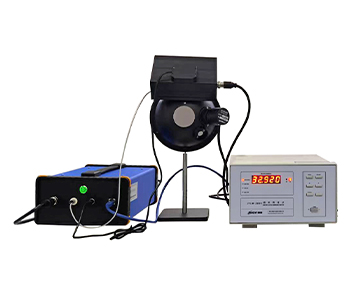
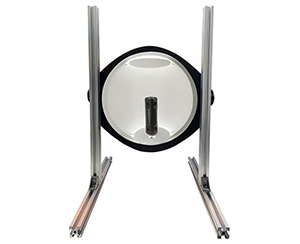
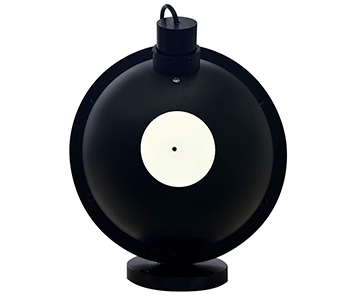
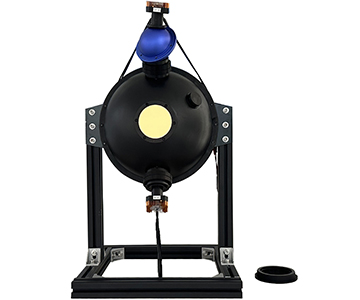
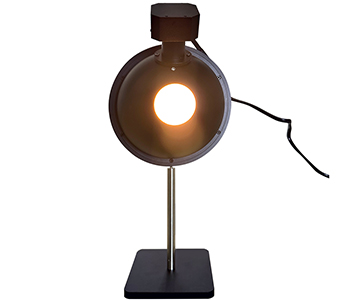
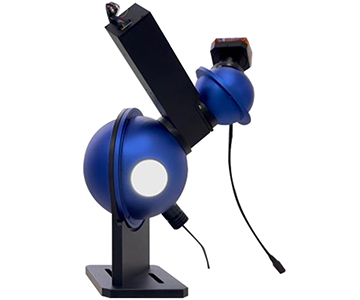
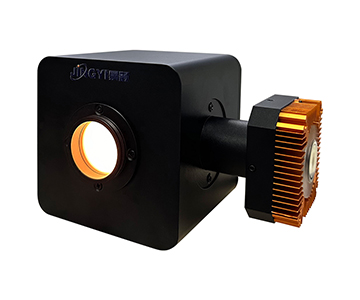
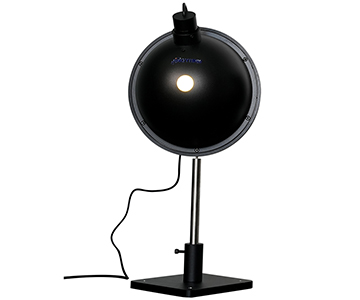
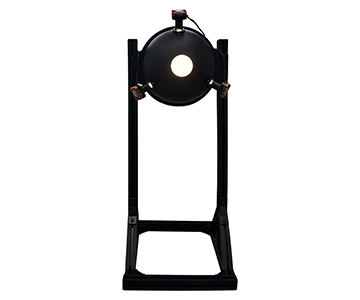
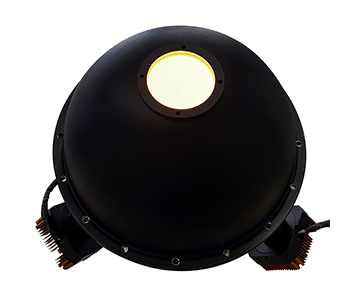
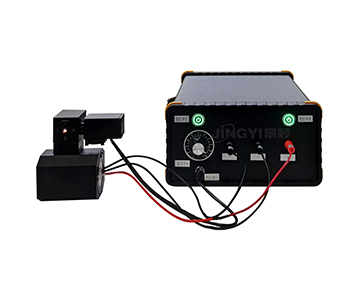
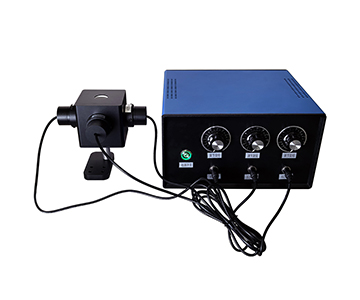
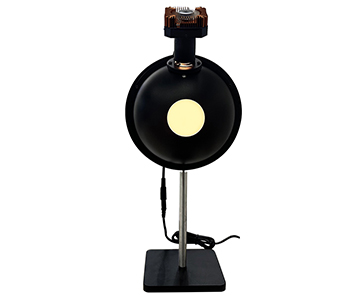
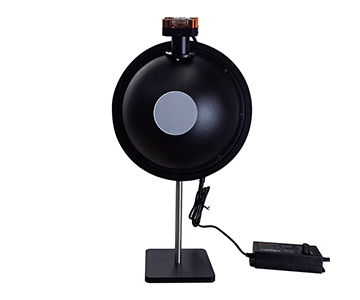
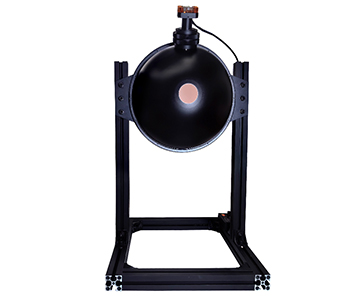
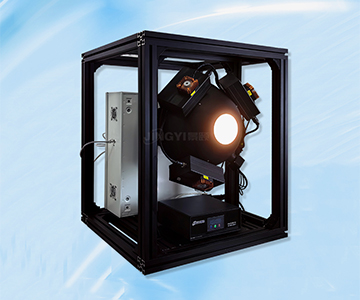
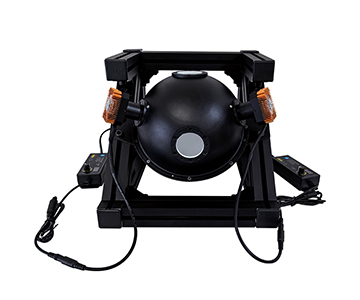
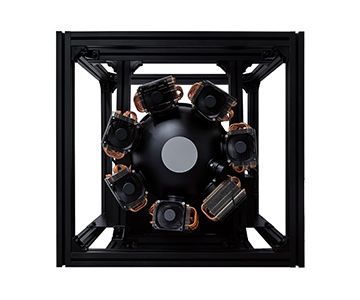
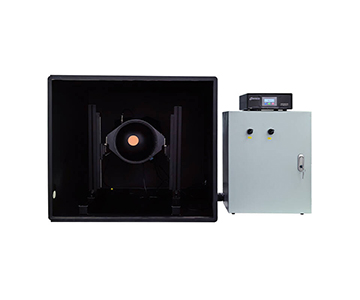
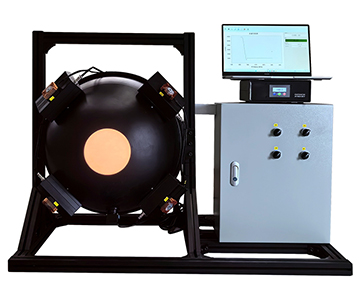
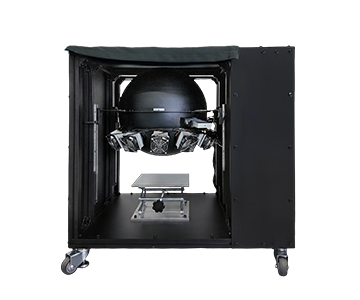
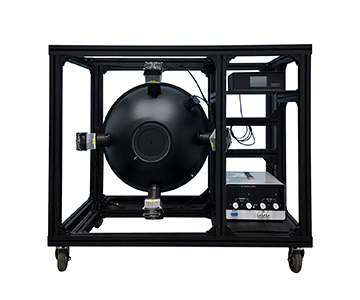
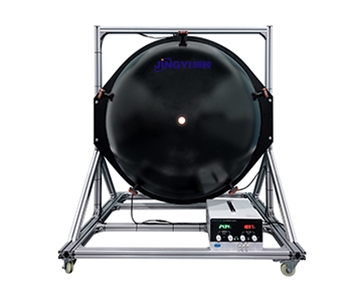
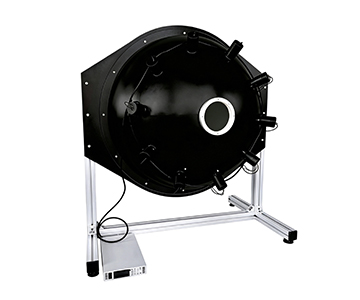
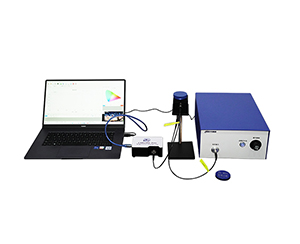
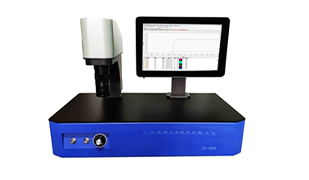
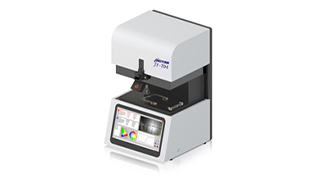
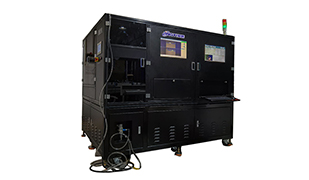
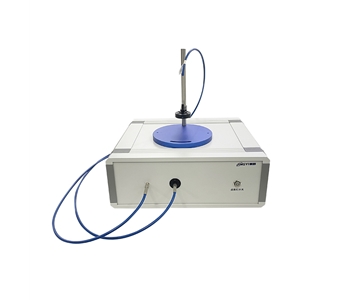
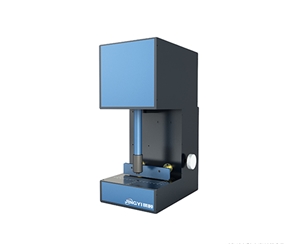
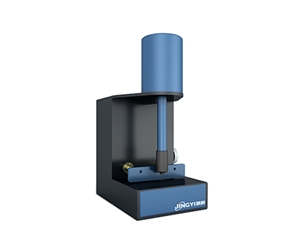
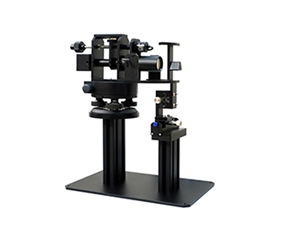
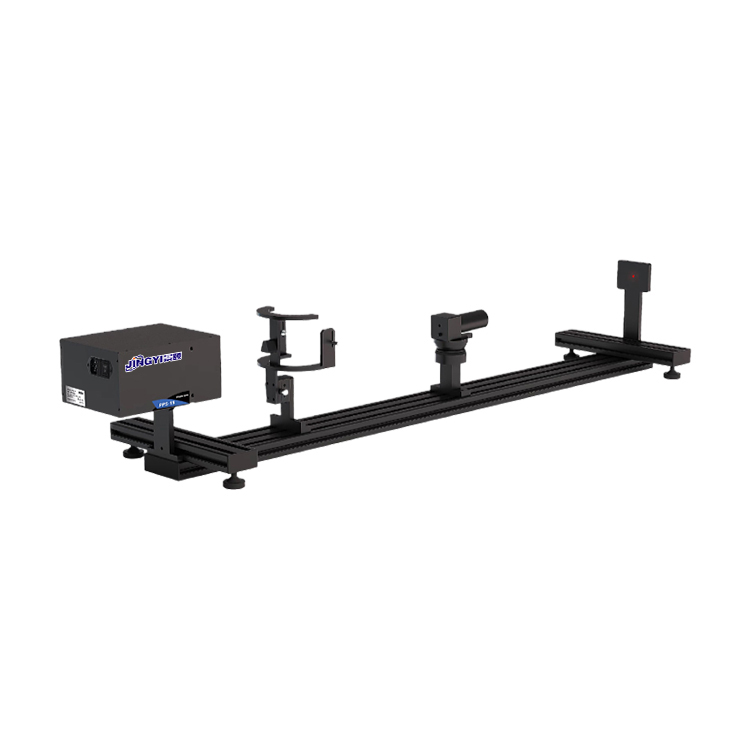
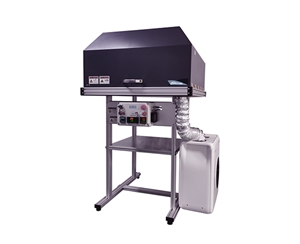
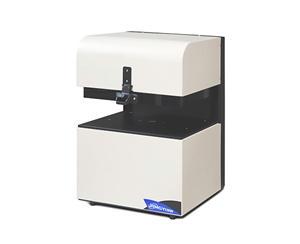
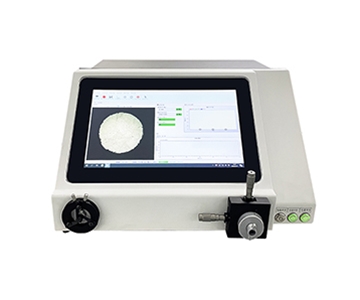
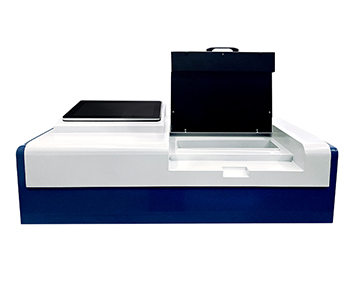
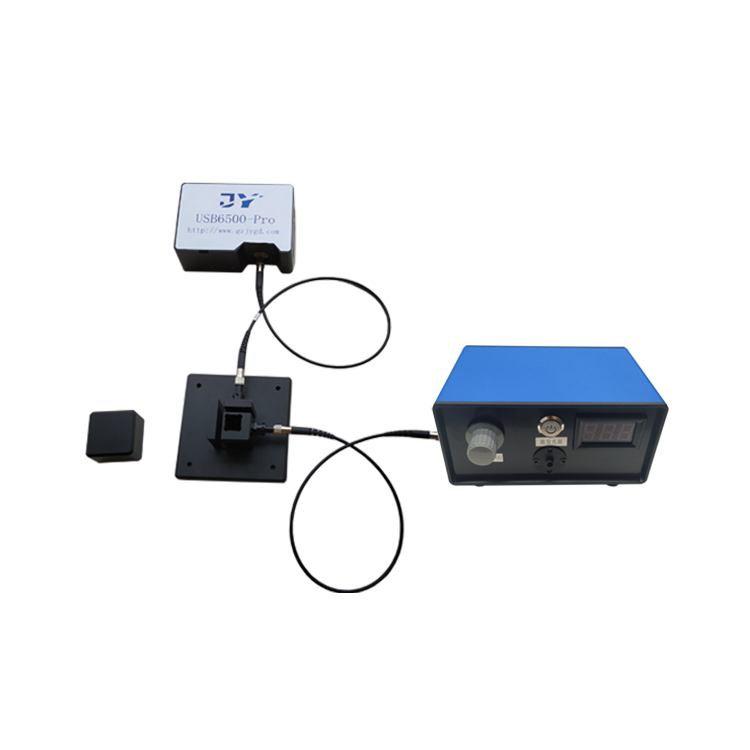
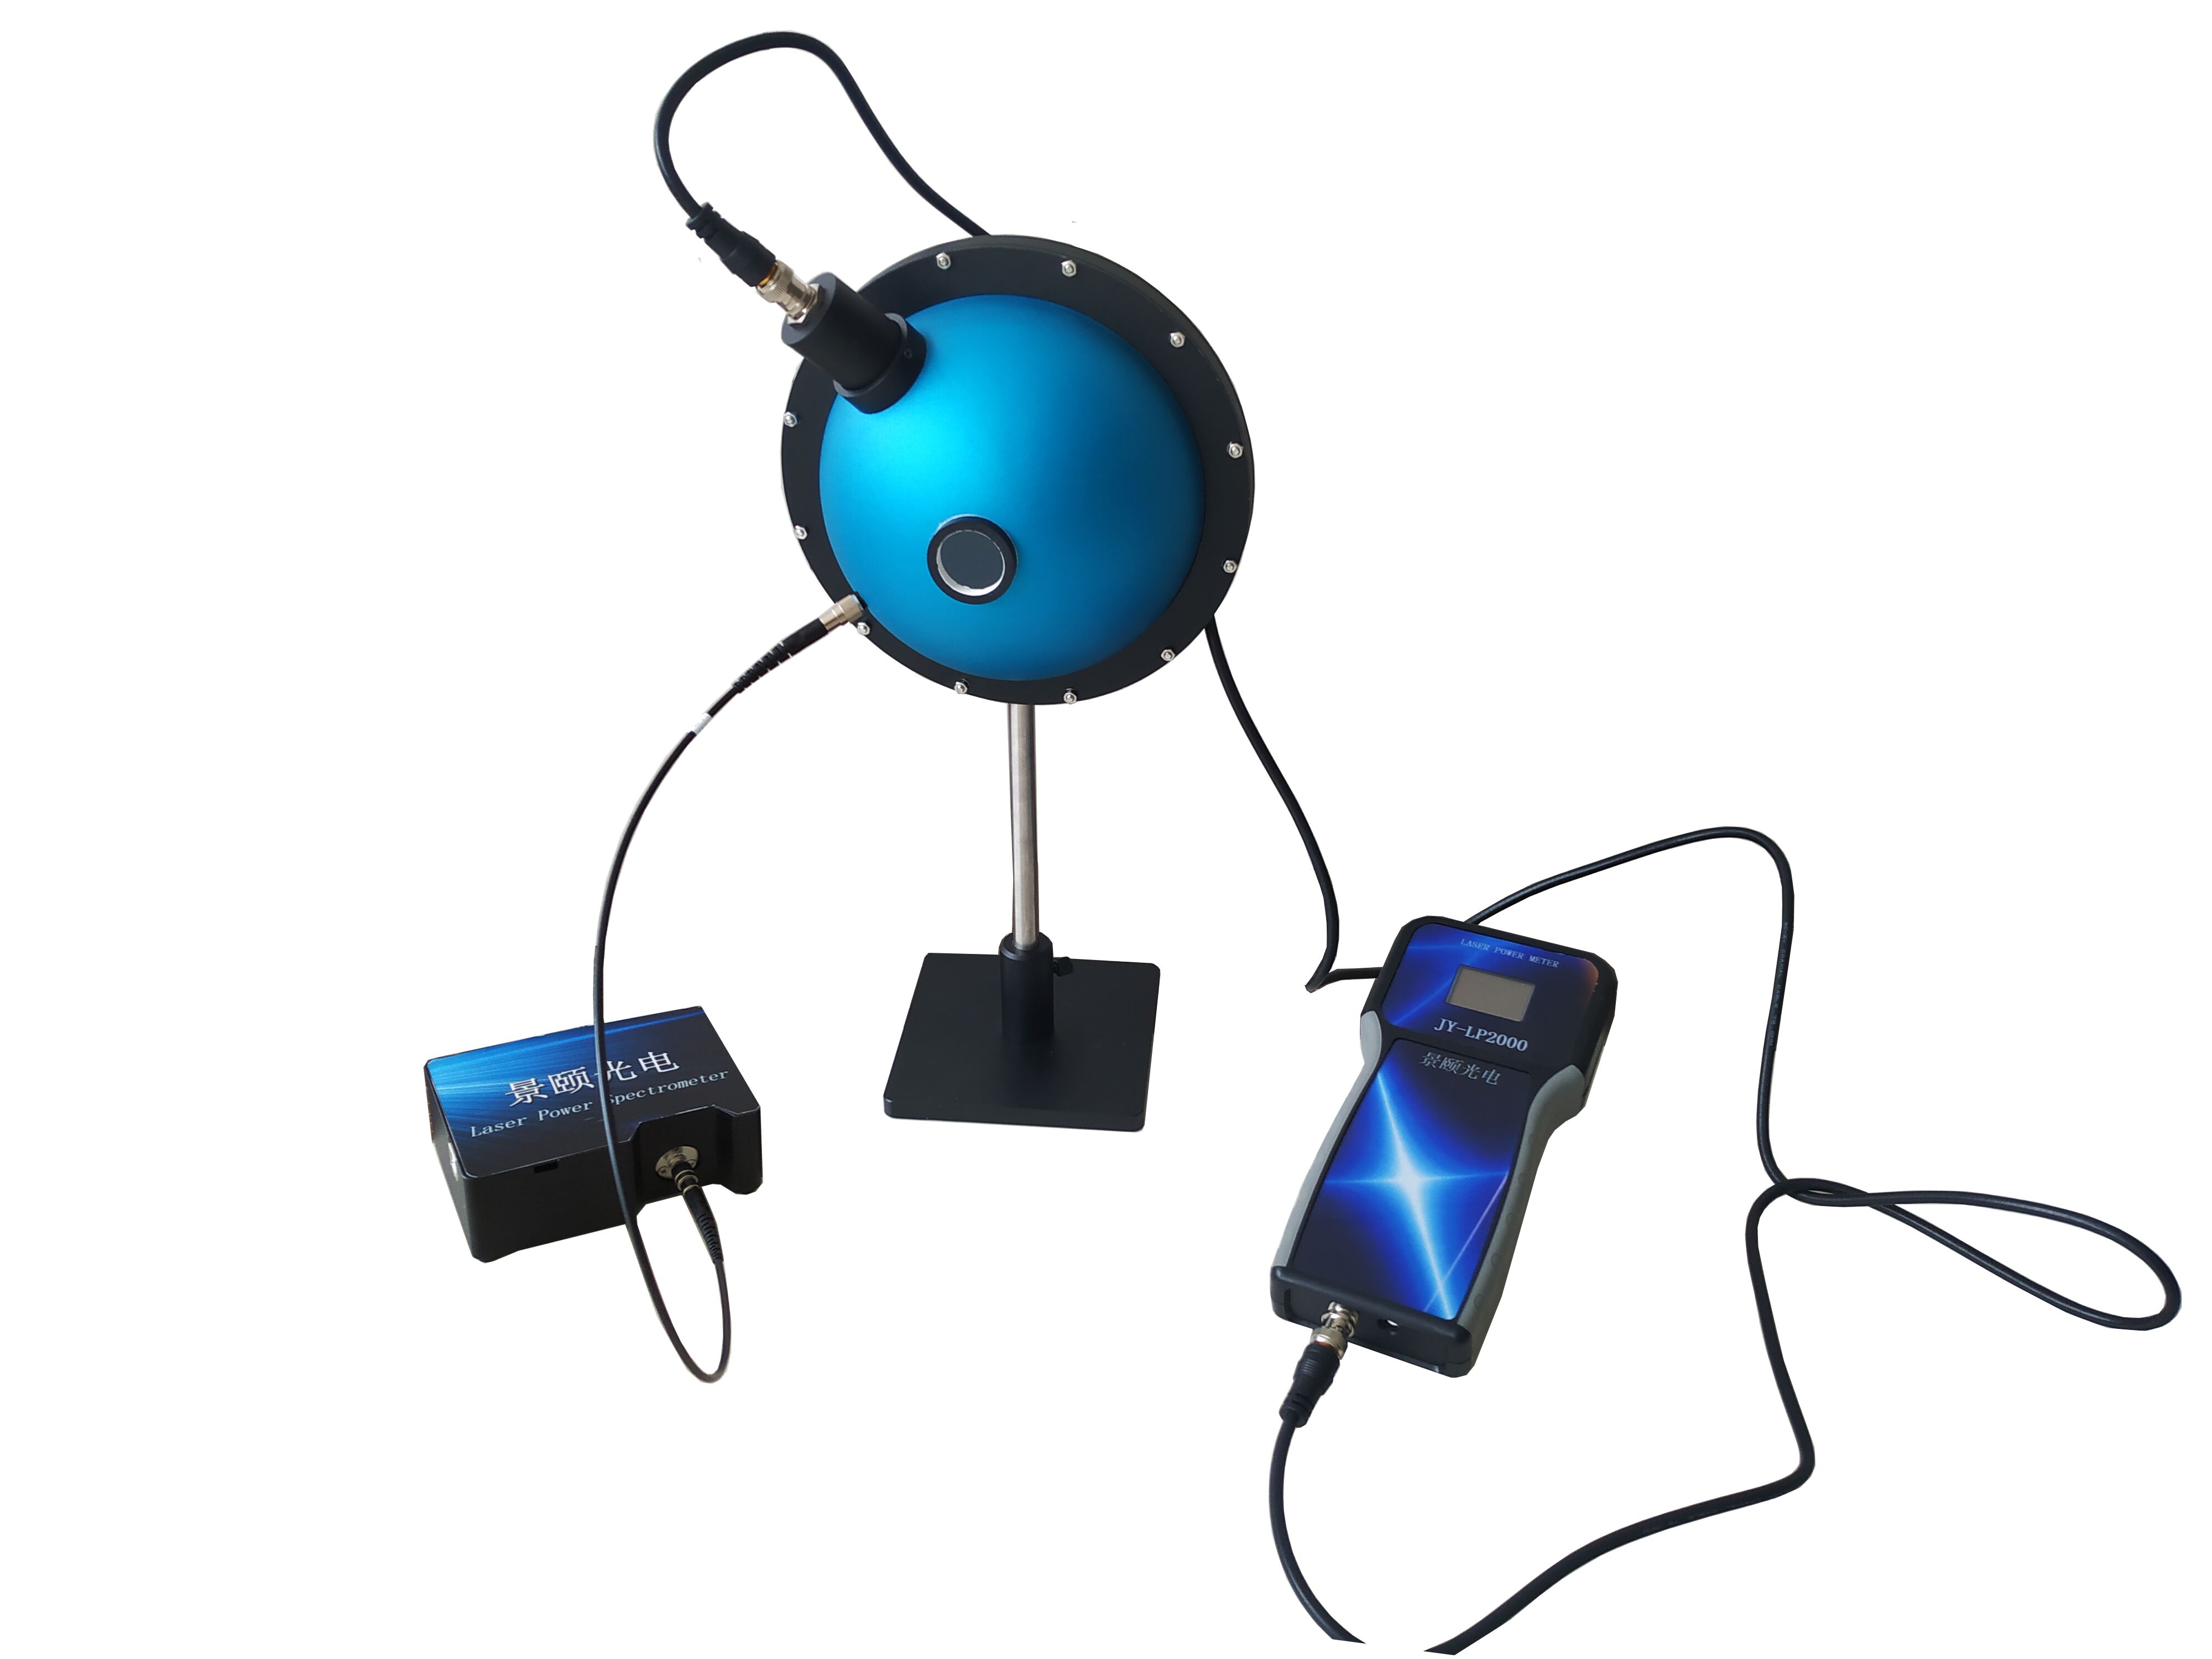
Integrating sphere power meters using PTFE high-diffuse-reflection coatings deliver reliable online monitoring for highly divergent laser sources, achieving 0.2ms response time, ±5% measurement uncertainty, and NIST-traceable calibration. This guide dissects seven procurement dimensions, compares three price tiers from $15K to $100K+, and details a POC validation workflow. For laser diode, pulsed source, and fiber laser production lines, the core purchasing criteria are matching power range to attenuation boundaries, verifying probe traceability chains, and ensuring environmental adaptability under continuous operation.
The “±1% accuracy” printed on a datasheet rarely survives the reality of a laser production floor. When particulate contamination and thermal drift compound, how much credibility remains? In laser power meter procurement, the most frequently over‑packaged claim is “high precision.” Many economy‑class devices conflate linearity, uncertainty, and repeatability in a single parameter row; some low‑cost models even substitute detector nominal values for system‑level calibration. For technical buyers, the real danger is not the price tag—it is building production yield on an untraceable power curve.
Seven Selection Dimensions
Wavelength Coverage and Band Matching
When the device under test spans mixed UV‑to‑NIR sources, a 200‑1100 nm broadband response determines whether one instrument can cover multiple product families. For communication bands only, select the 800‑1650 nm tier; pure visible applications can narrow to 380‑1100 nm to avoid excess noise at spectral edges.
Integrating Sphere Structure and Detector Aperture
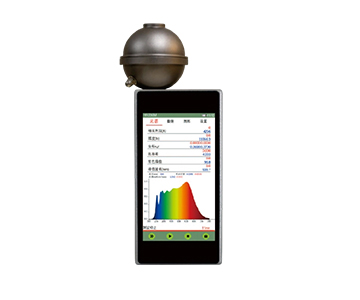
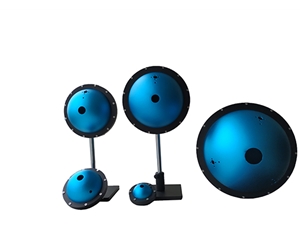
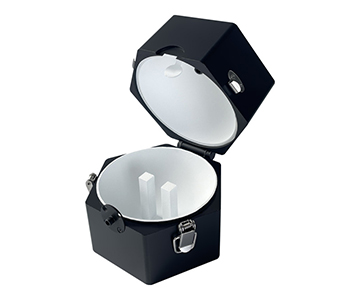
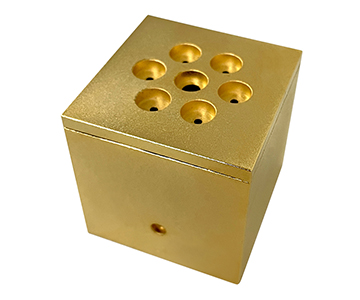
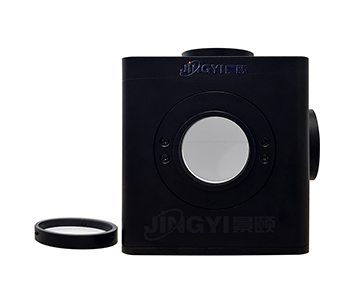
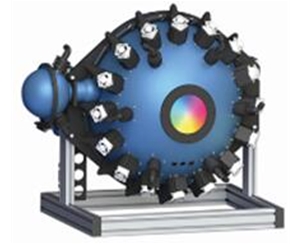
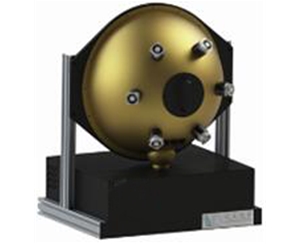
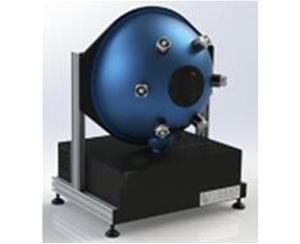
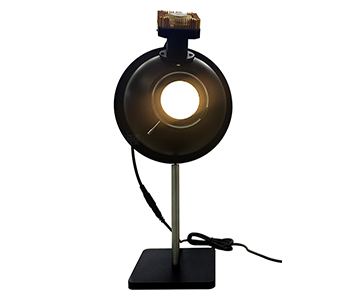
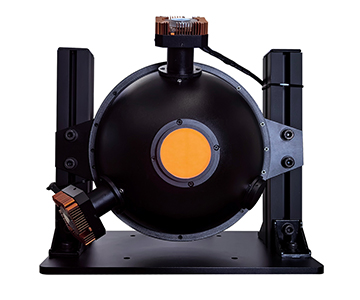
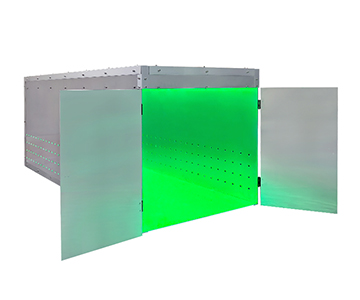
Highly divergent beams entering the cavity rely on multiple scattering from a high‑diffuse‑reflectance coating to create uniform illuminance. A 50 mm sphere with 13 mm aperture suits small‑beam, low‑density sampling; 84 mm and larger spheres with 25.4 mm apertures better accommodate high‑divergence laser diode assemblies.
Measurement Speed and Production Line Takt
A 0.2 ms sampling interval captures transient changes during pulsed laser power fluctuations rather than yielding only an averaged value. In high‑speed inline inspection, this speed directly caps single‑station throughput.
Power Range and Attenuation Boundary
Low‑power tiers start at 1 nW, mid‑power extends to 1 W, and high‑power covers 10 mW to 100 W. The actual upper limit is constrained by the coating’s thermal threshold; high‑power incidence without a front‑end attenuator risks irreversible coating damage rather than mere measurement error.
Linearity and Uniformity
System linearity controlled within ±0.5% and sphere uniformity of ±2% determine whether data from multi‑point power scans can be compared horizontally. During array source or multi‑channel consistency screening, uniformity deviation directly translates into sorting errors.
Traceability and Calibration Chain
The power probe and integrating sphere must be calibrated as a combined system, traceable to NIST. Buyers should verify that the certificate covers “sphere + probe” jointly—not just the detector单体校准, which does not guarantee accuracy after assembly into the cavity.
Environmental Adaptability and Protection Considerations
Operating temperature 5 °C‑50 °C and humidity below 70% RH are explicit specifications. From an ingress protection perspective, production‑floor dust, condensate, and airflow erosion attack sphere apertures and interface seals. Even if the device lacks a formal IP rating, evaluate contamination rates at brackets, cables, and sphere seams under continuous operation.
Horizontal Comparison of Candidate Solutions
| Tier |
Wavelength Range |
Sphere Size |
Power Range |
Uncertainty |
Traceability |
| Import Benchmark ($100K+) |
200‑1100 nm |
Multiple |
Full range |
±5% class |
Traceable |
| Domestic Mainstream ($30K‑$60K) |
200‑1100 nm |
50‑150 mm |
1 nW‑100 W |
±5% |
NIST |
| Domestic Economy (<$15K) |
Narrow band |
Small aperture |
Low‑mid power |
Not stated |
Partial |
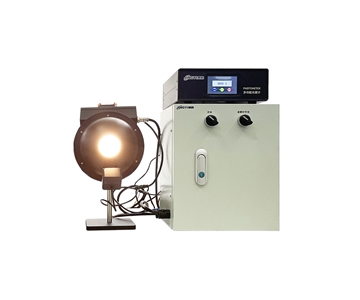
Import benchmark systems offer long‑established detector consistency and software ecosystems, but price and lead time are disadvantages. Domestic mainstream tier matches production needs with broadband coverage, PTFE coating uniformity, and USB 2.0 plug‑and‑measure capability. Economy tier often omits high‑power attenuation links, fitting R&D bench trials rather than mass‑production full inspection. The domestic mainstream tier compresses uncertainty to ±5% and linearity to ±0.5%, paired with dedicated software for one‑click reading—delivering optimal cost‑performance in laser manufacturing and consumer electronics quality inspection. The real differentiator is not a single peak spec, but the complete closed loop of “range + traceability + speed.”
POC Validation Methodology
Prepare three reference light sources of known power: low‑power nW class, mid‑power hundreds of mW, and high‑power tens of watts. Step 1: test low‑power repeatability with 50 consecutive samples; verify if standard deviation falls within ±0.5% linearity expectation. Step 2: inject a high‑divergence beam, compare center incidence versus off‑axis readings to validate sphere uniformity does not degrade beyond ±2%. Step 3: engage the front‑end attenuator, record pre‑ and post‑attenuation ratios, and confirm thermal limit boundaries. Step 4: perform temperature drift testing at ambient shop floor and 35 °C environments, observing zero‑point drift. Finally, use a NIST‑traceable standard lamp for reverse verification, confirming certificate chain consistency with measured deviation before deciding on small‑batch adoption.
10‑Point Inspection Checklist
1.Is your measured light source UV, visible, or near‑IR?
2.Does the maximum incident power exceed the coating thermal limit?
3.Is a front‑end attenuator with multi‑stage switching required?
4.Does the integrating sphere diameter match the beam divergence angle?
5.Does the calibration certificate cover detector alone or sphere‑probe integration?
6.Does the ±5% uncertainty include system error?
7.Can the 0.2 ms sampling cover the pulse width?
8.Is the USB 2.0 interface compatible with your existing MES system?
9.What dehumidification solution exists if humidity exceeds 70% RH?
10.Can the software export raw data instead of only averages?
Common Selection Mistakes Engineers Make
Treating “25.4 mm detector aperture” as direct proof of “100 W measurable capability” is a typical misreading. At high power, coating absorption density at the sphere wall is the bottleneck; operating without an attenuator will directly scorch the coating. Another pitfall is focusing solely on absolute accuracy while ignoring linearity. If linearity collapses in the low nW range, data for weak fluorescence or pulse tail analysis may appear stable while actually drifting. Some engineers also apply laboratory constant‑temperature data to production environments; once humidity rises and condensation forms at the sphere aperture, uniformity degrades immediately.
Application Boundaries and Limitations
These devices adapt well to highly divergent, complex polarization, and beam‑direction‑unstable sources, but they are not universal. Facing ultra‑high‑power continuous lasers, thermal accumulation inside the sphere remains physically constrained, requiring external beam splitting or attenuation architecture. Additionally, PTFE coatings may slowly age under prolonged strong UV irradiation; periodic recalibration is mandatory. Buyers expecting “install and forget for a decade” is unrealistic; a reasonable expectation is: traceable values, explainable deviations, and reproducible verification.
Frequently Asked Questions
Q1: How do I judge whether a calibration certificate is authentic and valid?
A: Check whether the certificate simultaneously covers the integrating sphere and power probe, explicitly stating traceability to NIST. Single‑detector calibration alone cannot prove system‑level accuracy.
Q2: Which configuration suits different wavelength bands?
A: For UV to visible, select 200‑1100 nm broadband; for communication infrared, choose 800‑1650 nm; pure visible can shrink to 380‑1100 nm to reduce edge noise.
Q3: Can the device keep up with fast production line takt?
A: The 0.2 ms measurement time covers most pulsed and inline sampling needs, but matching takt also depends on software trigger and data upload latency.
Q4: How to weigh domestic versus import solutions?
A: Import systems win on long‑term reputation; domestic mainstream tier excels in range completeness, lead time, and custom apertures tailored to local production lines—provided the traceability chain is verified.
Q5: How can I independently verify long‑term stability after procurement?
A: Use a standard reference light source for reverse verification quarterly, recording zero‑point drift and linearity changes. Build your own traceability archive rather than relying solely on manufacturer reports.
About This Guide
Data Sources
: Uploaded product technical documentation, GB/T national standards data, industry public test data, NIST traceability guidelines.
Author
: Cai Xiaodong, Senior Application Engineer, Jingyi Optoelectronics, 12 years in industrial precision measurement equipment.
Disclosure
: Jingyi Optoelectronics manufactures integrating sphere power meters. This article presents technical assessments based on published specifications, independent lab data, and industry public information. No compensation was received from third‑party brands mentioned.
Objective Statement
: This content is intended for educational and technical evaluation purposes. Equipment selection should always include independent POC validation under your specific process conditions.
Last Updated
: October 2026
For detailed specifications and application notes on integrating sphere power meters, search “Jingyi Optoelectronics integrating sphere power meter” or visit our technical library.