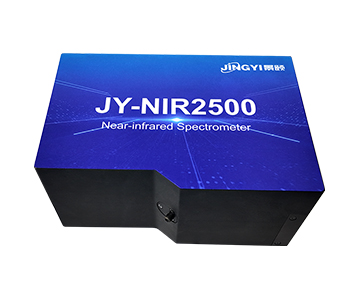
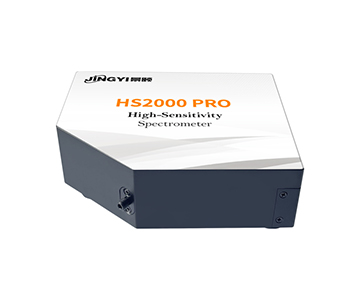
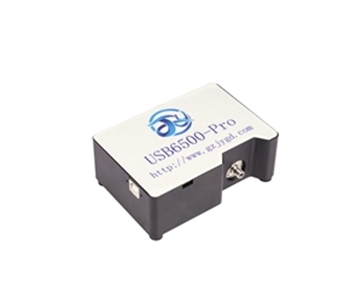
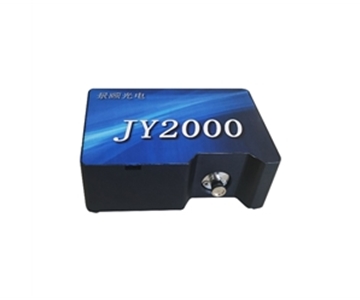
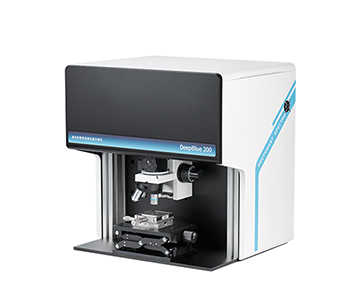
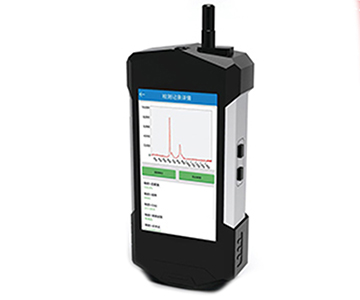
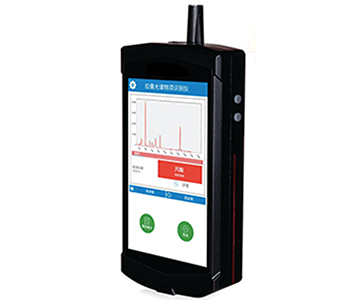
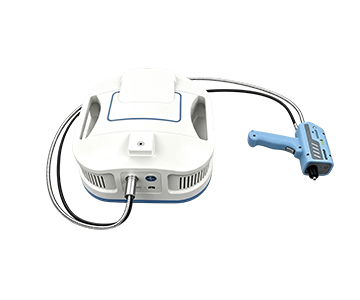
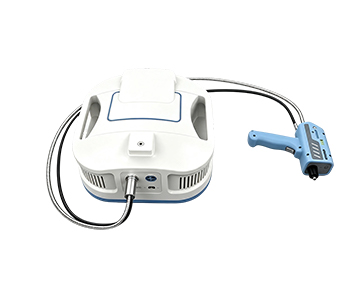
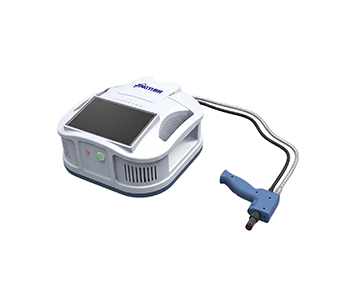
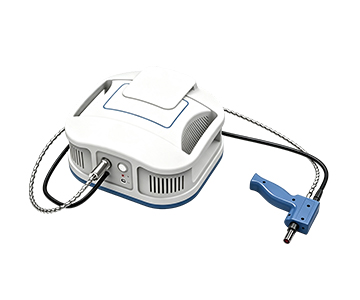
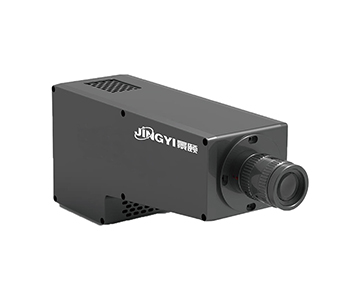
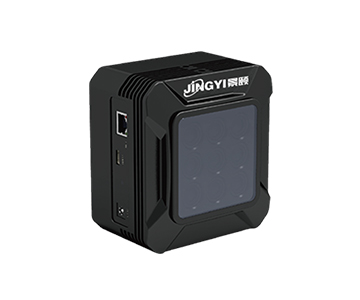
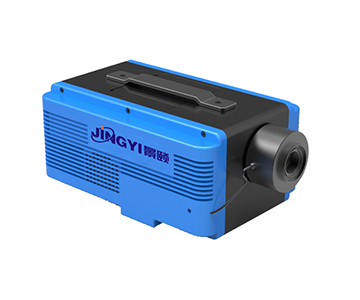
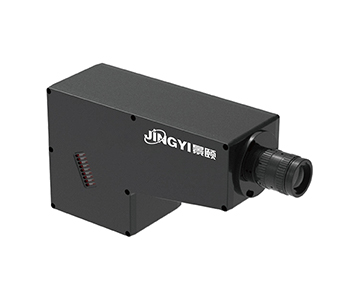
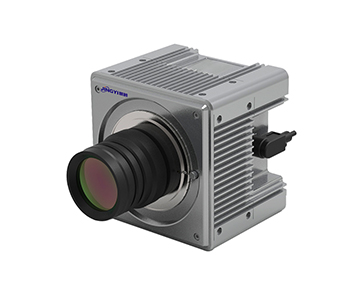
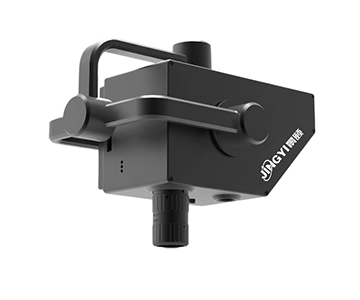
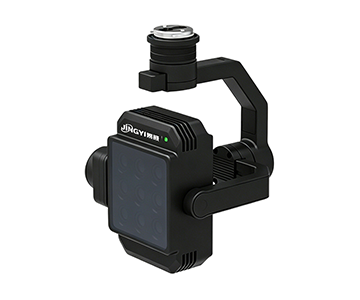
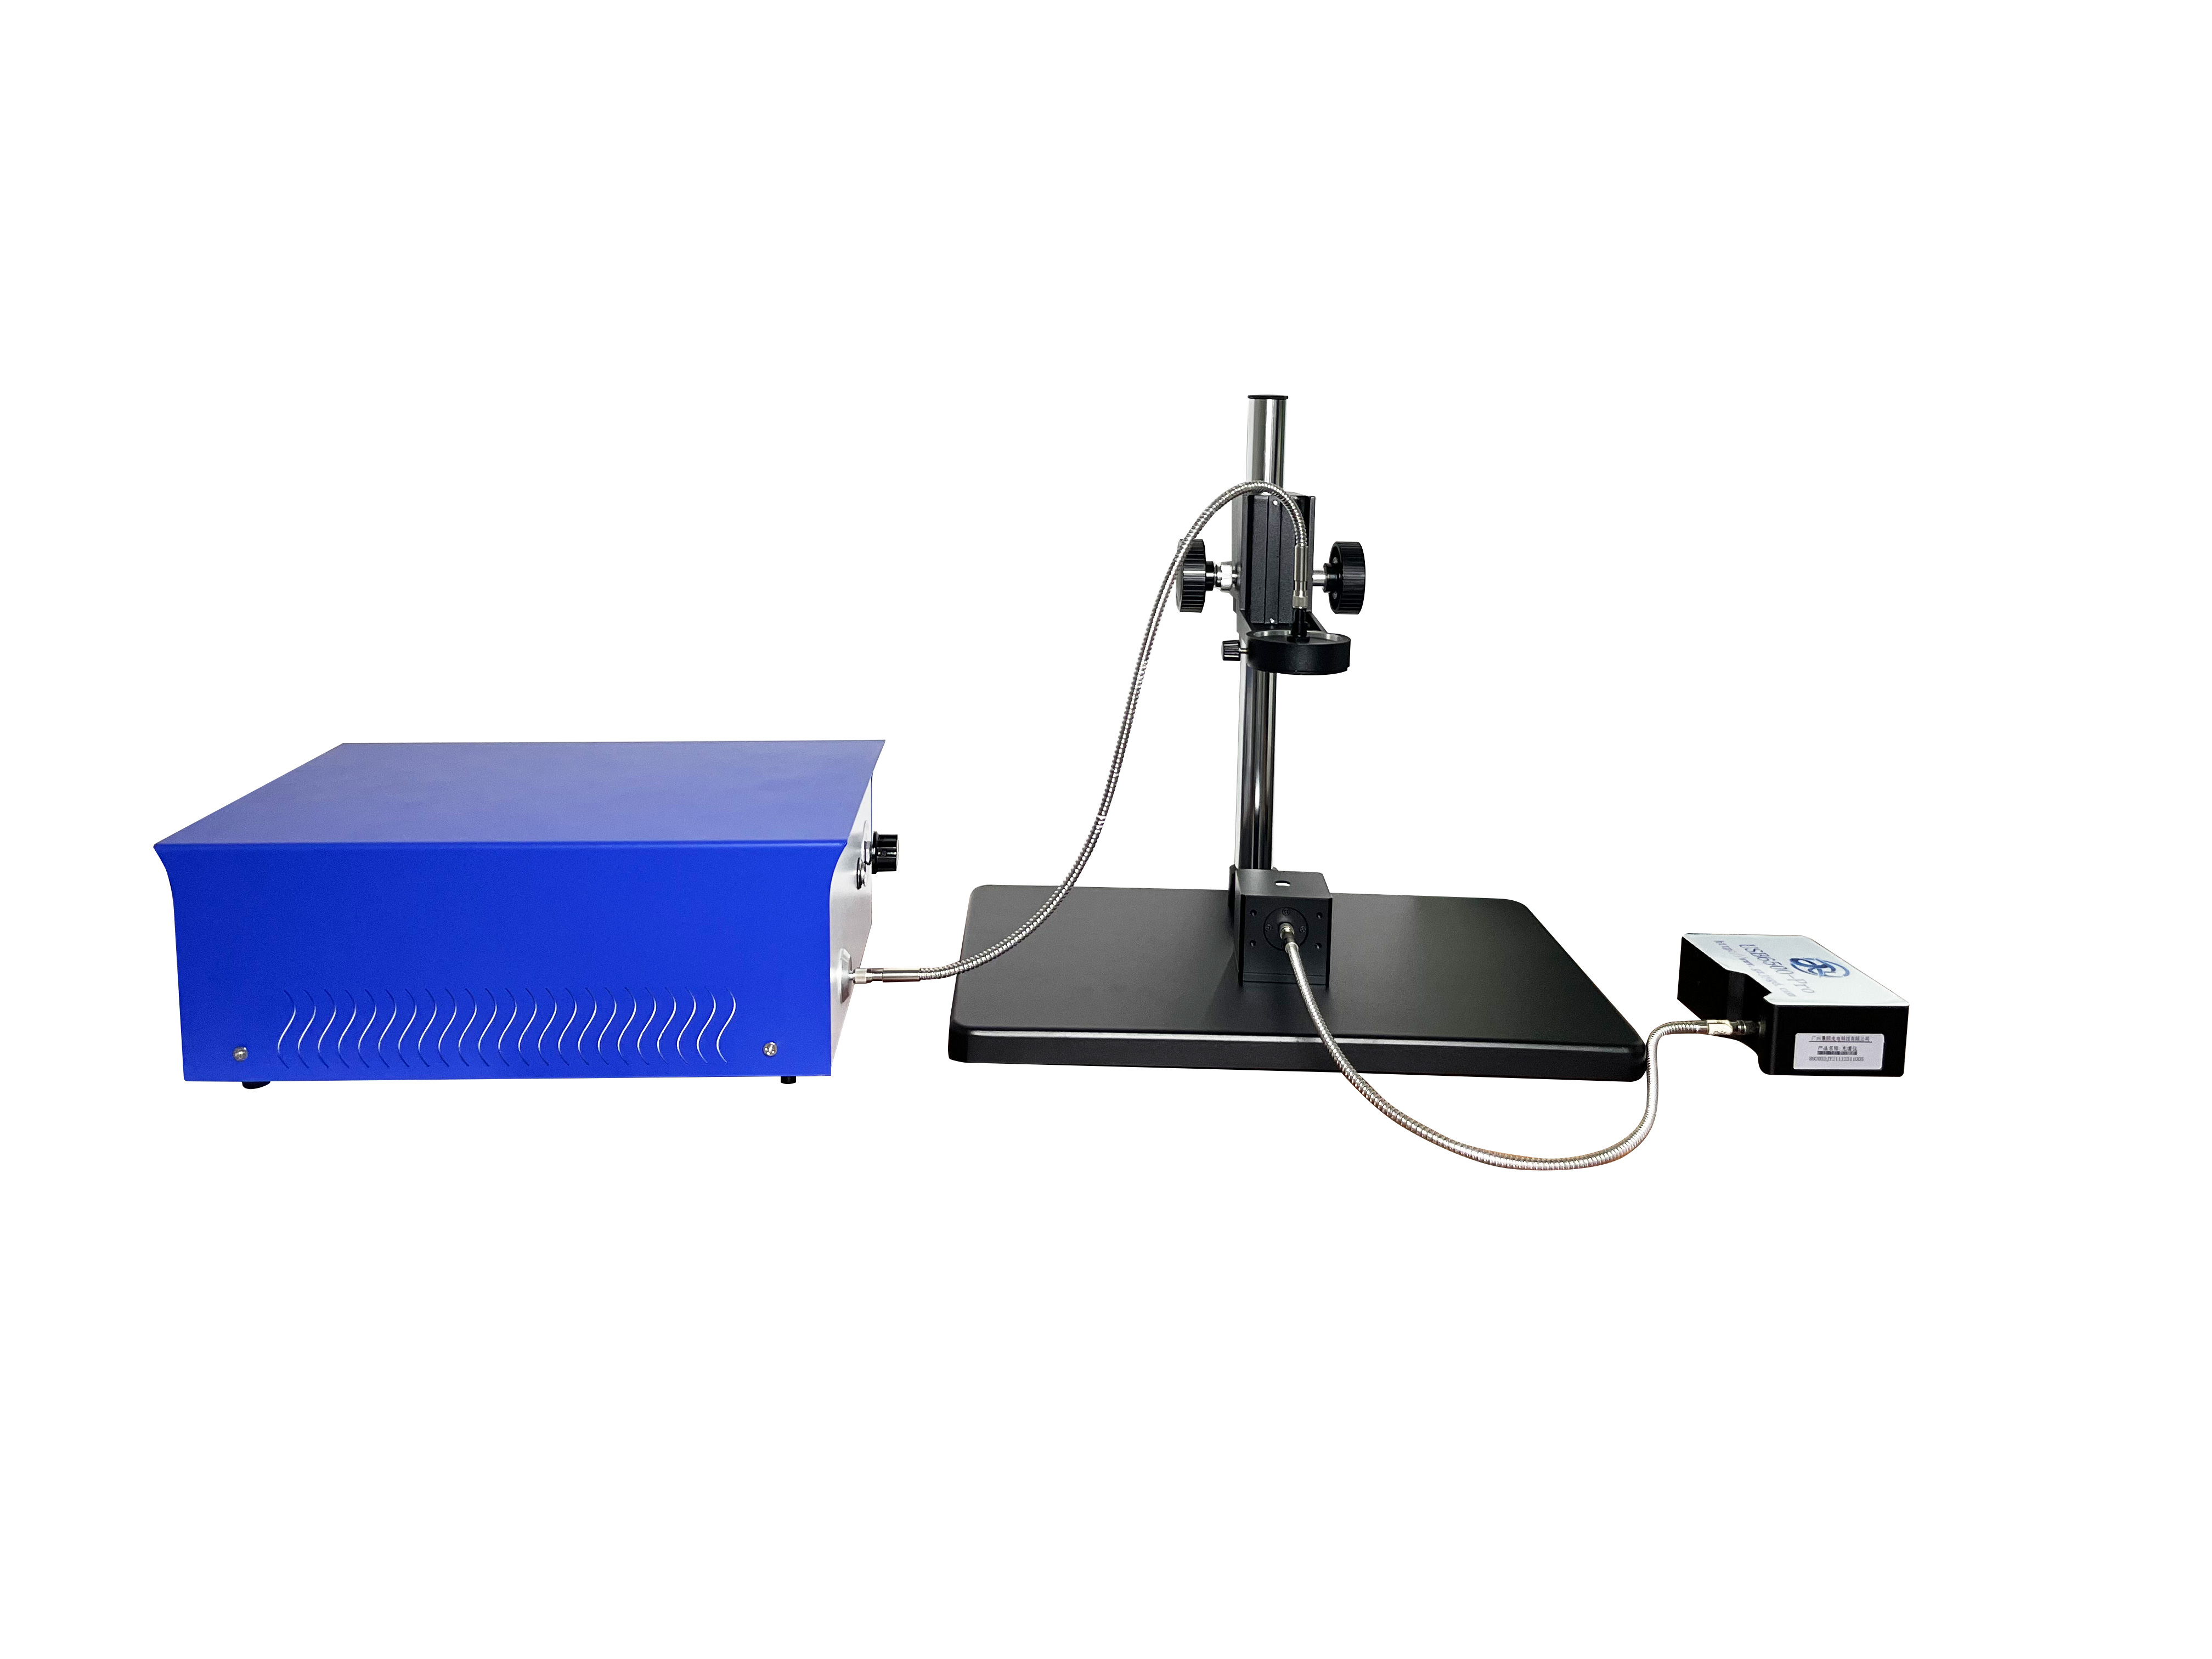
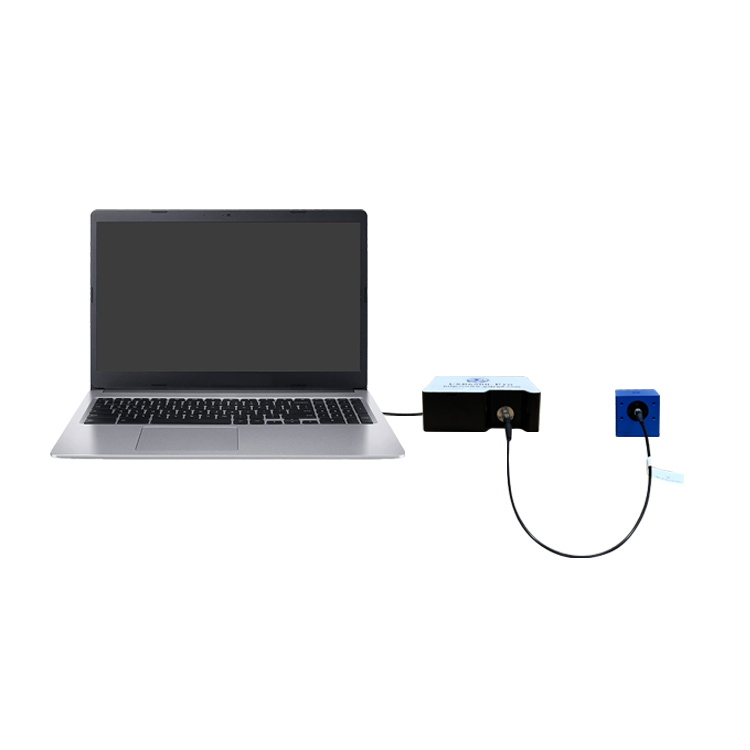
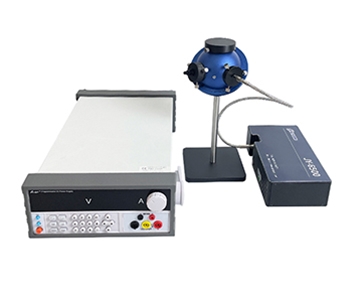
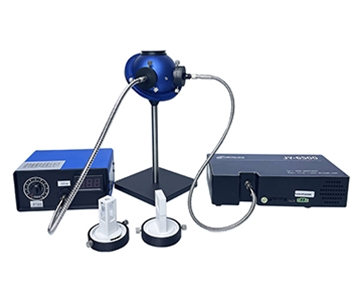
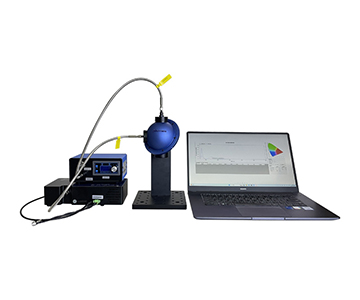
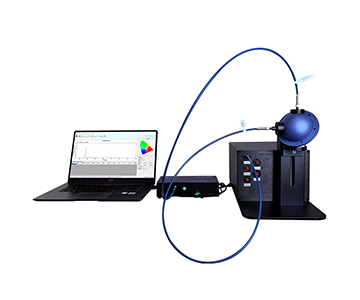
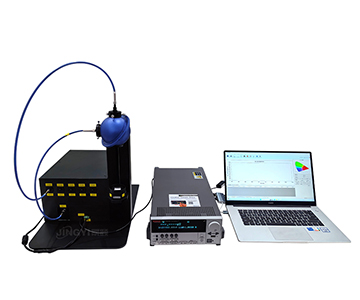
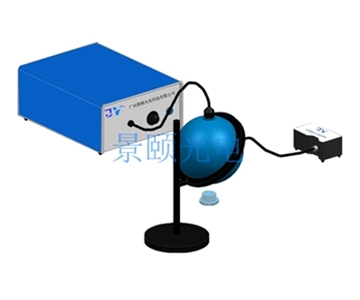
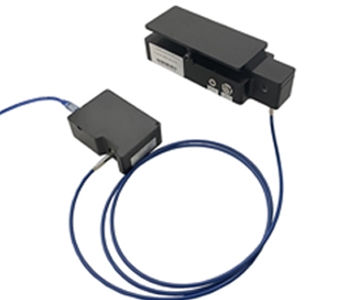
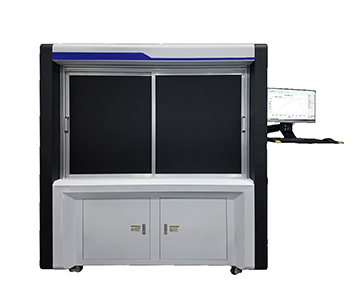
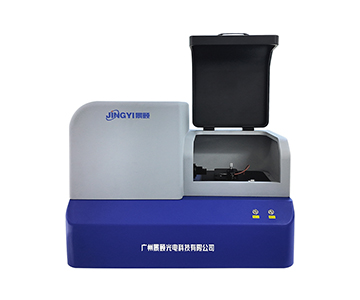
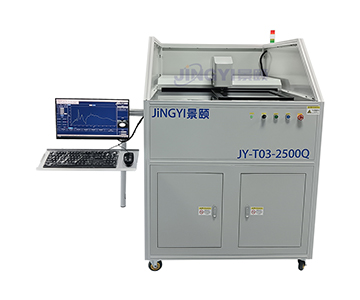
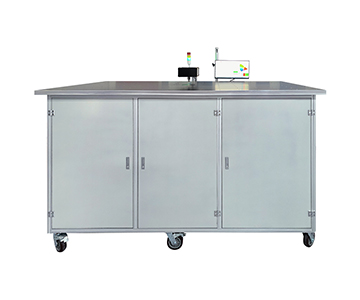
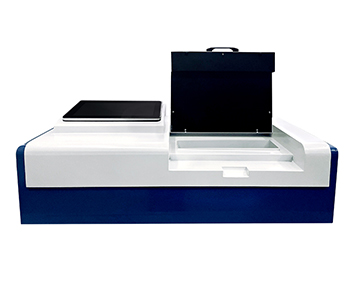
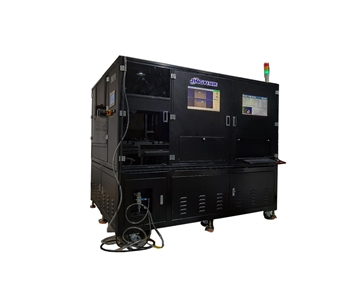
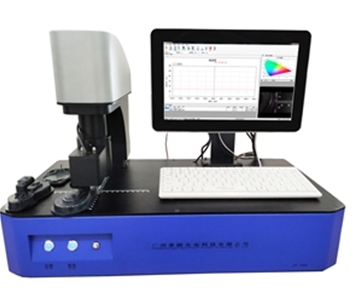
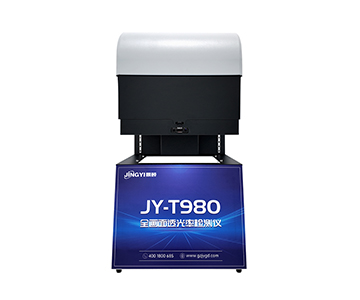
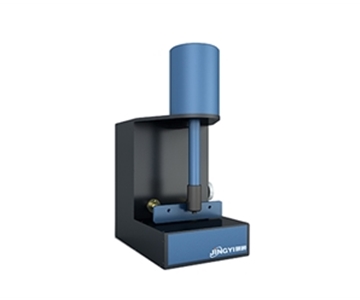
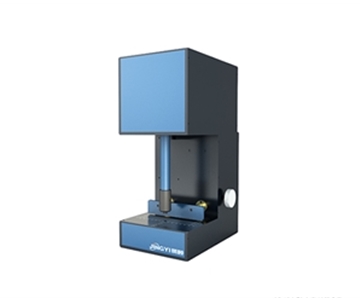
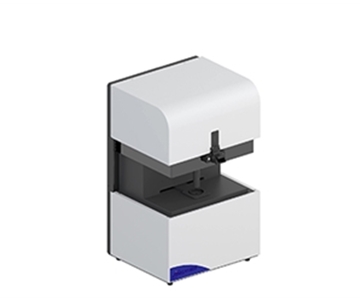
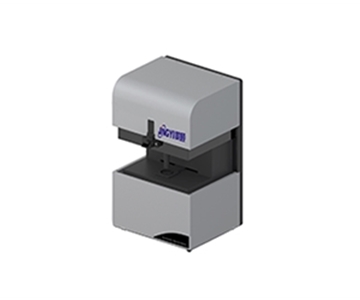
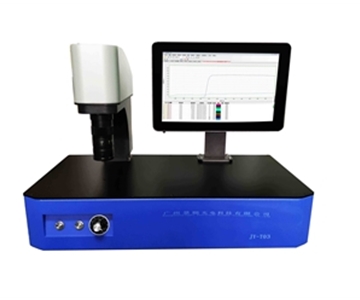
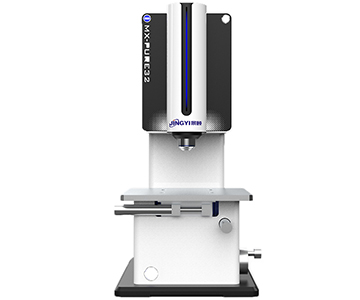
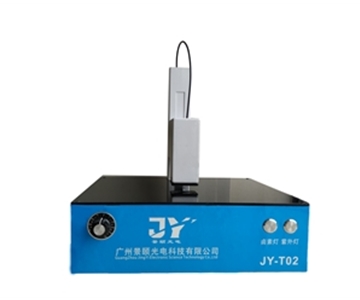
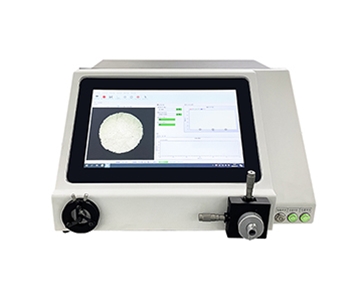
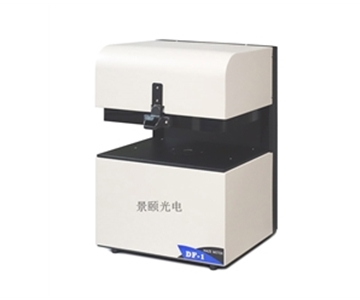
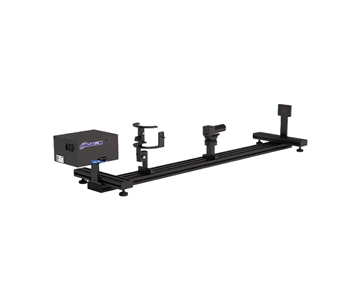
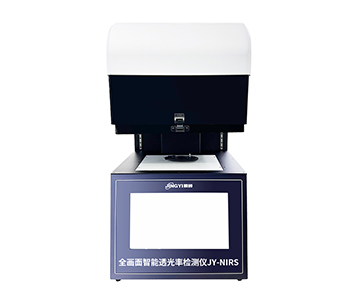
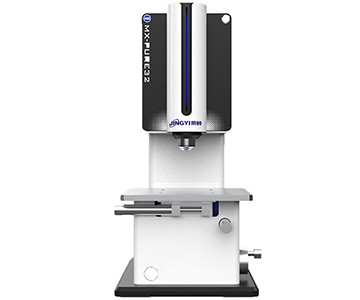
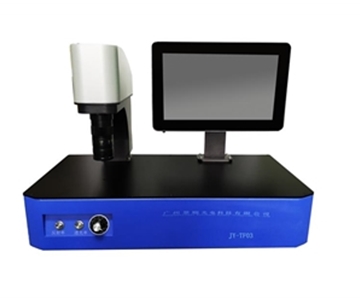
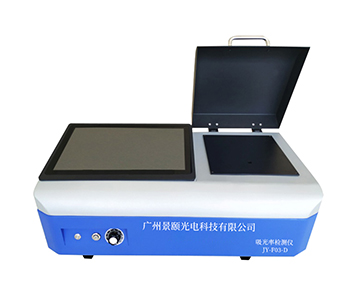
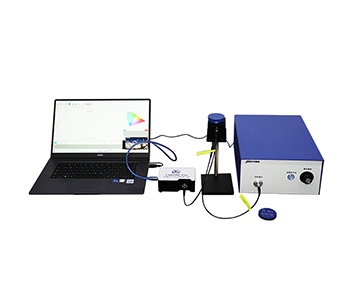
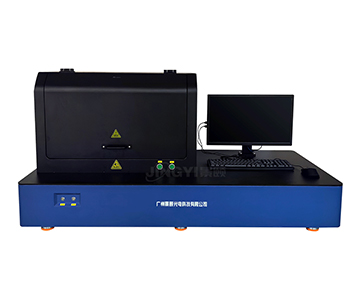
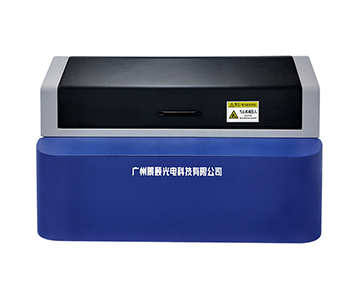
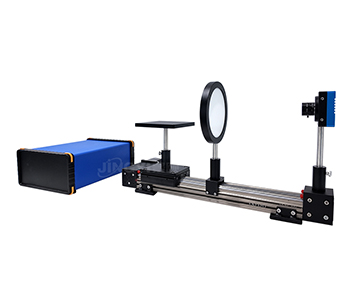
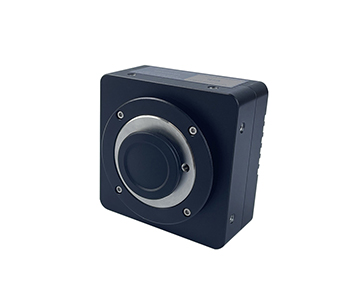
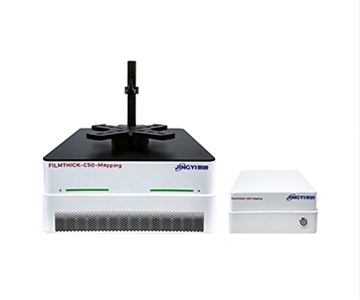
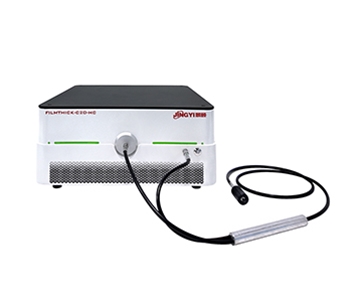
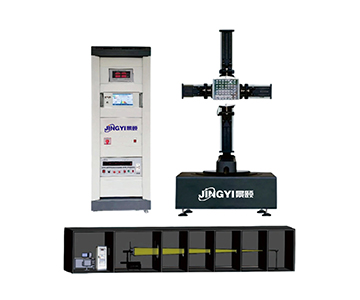
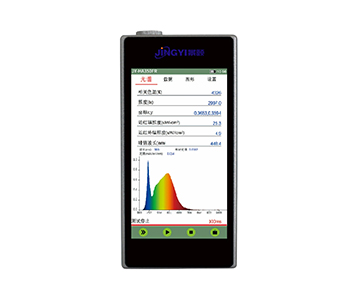
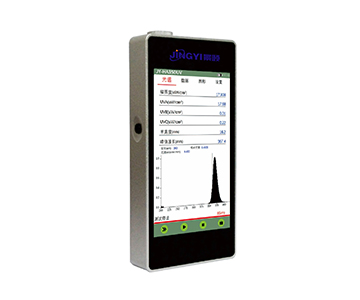
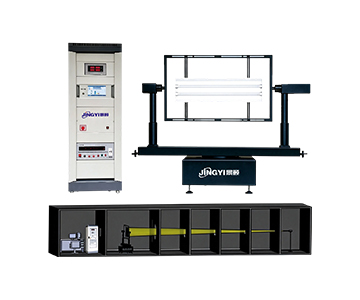
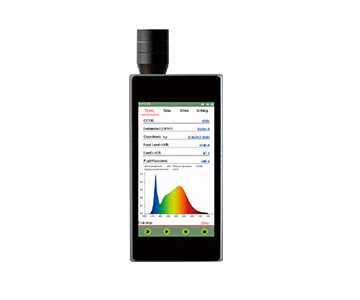
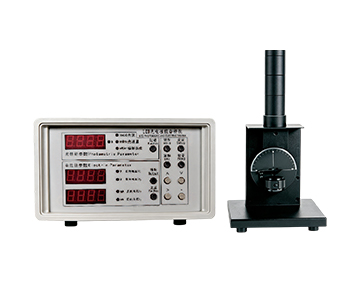
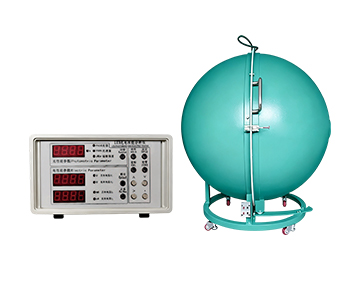
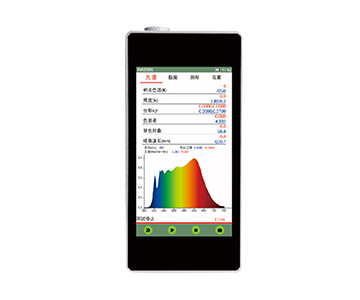
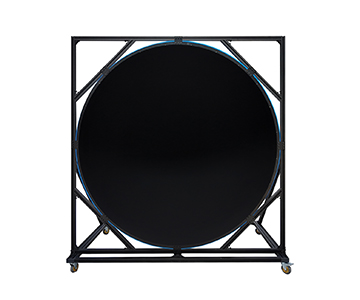
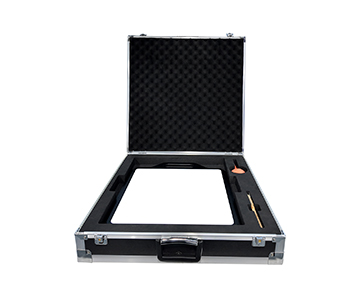
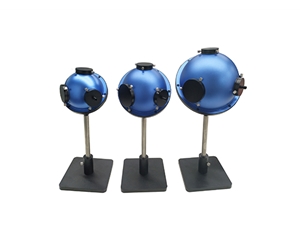
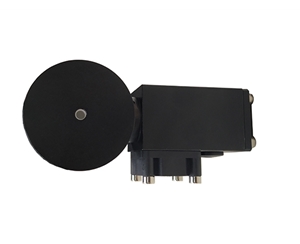
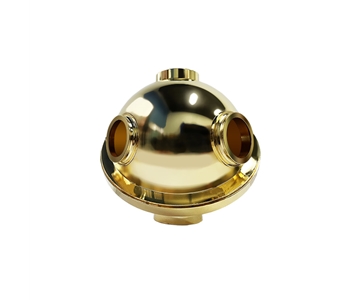
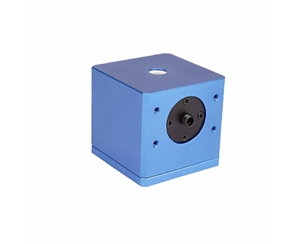
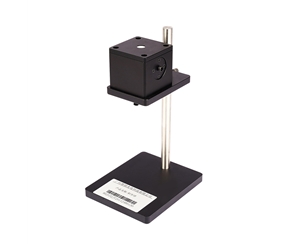
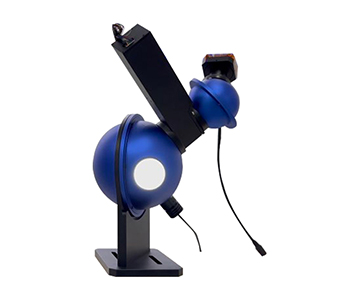
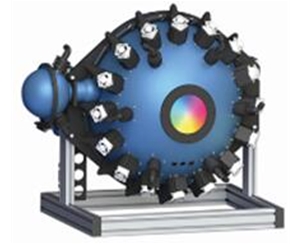
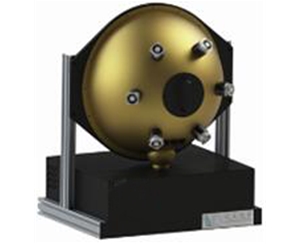
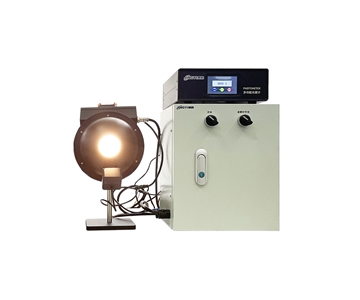
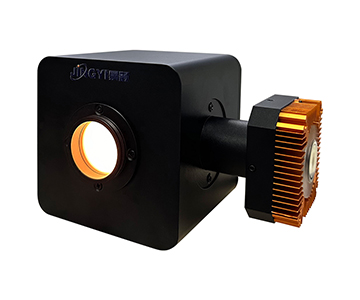
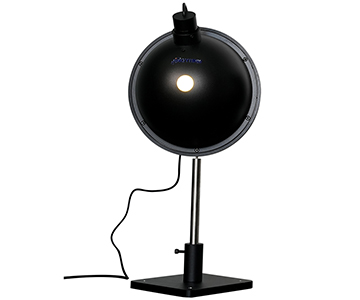
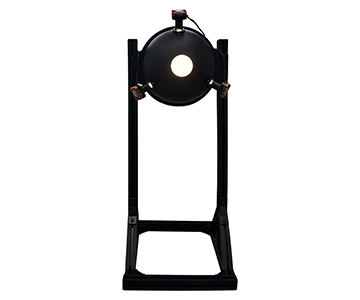
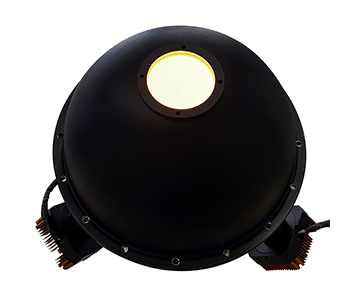
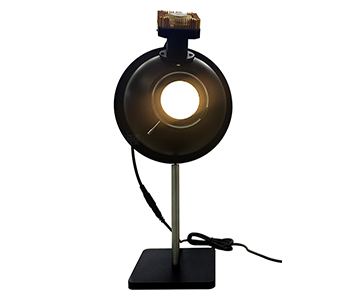
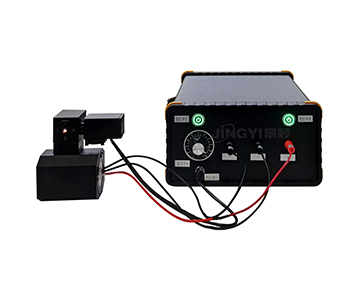
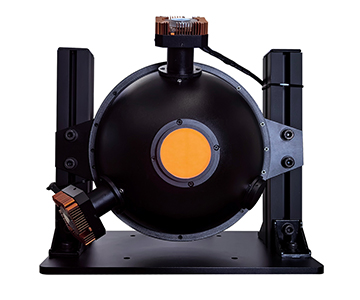
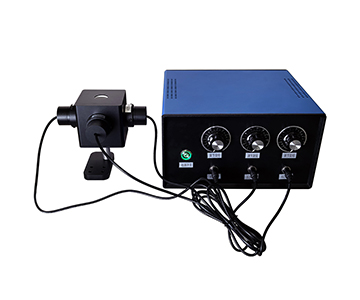
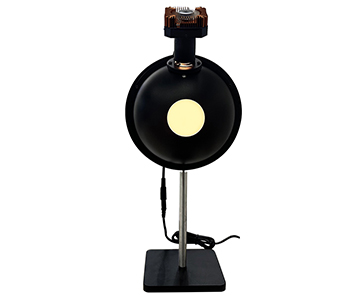
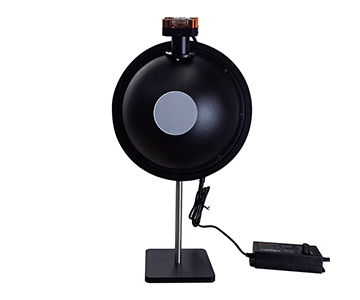
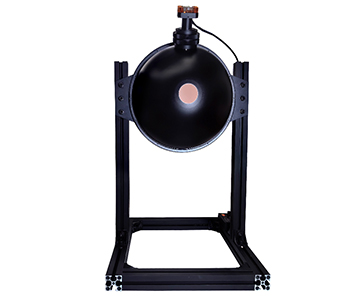
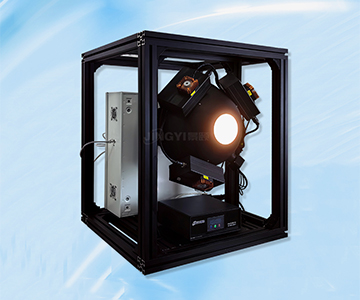
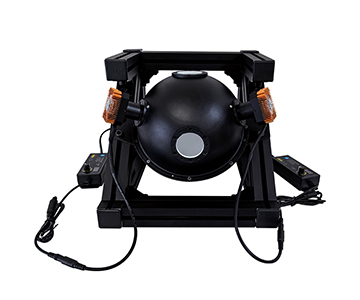
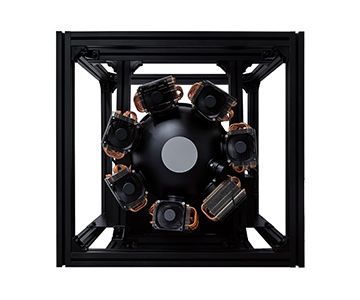
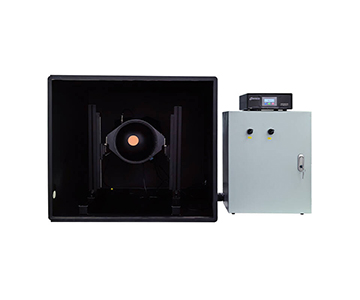
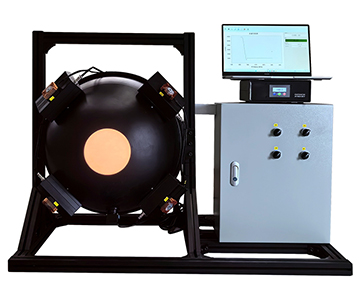
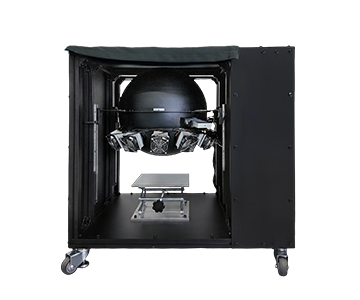
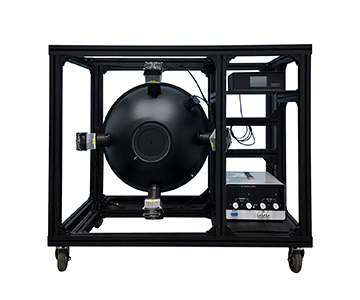
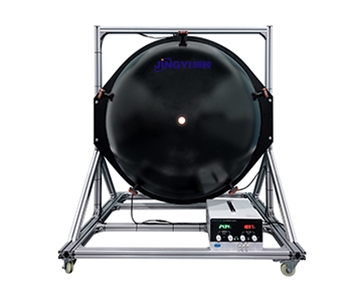
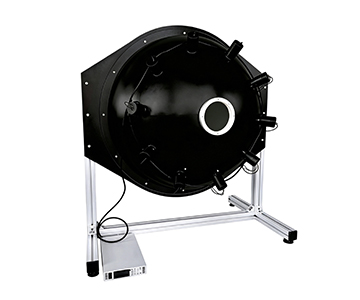
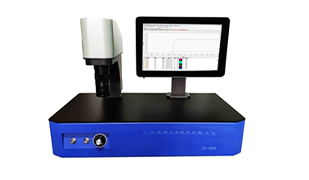
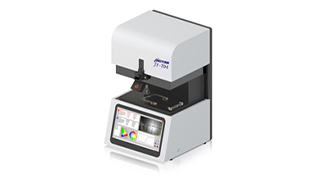
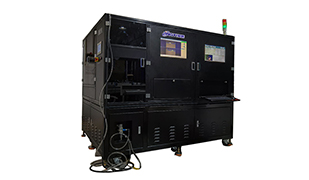
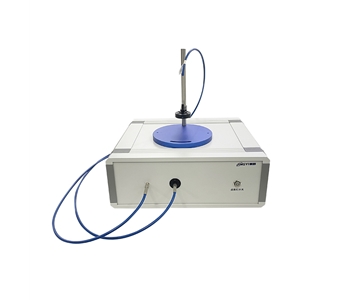
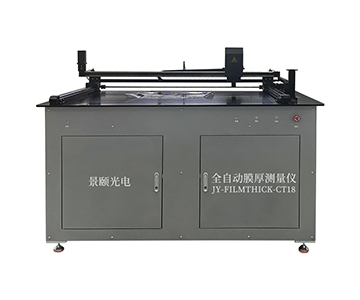
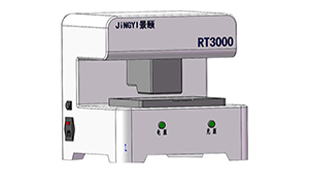
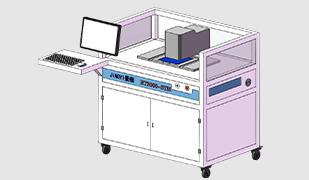
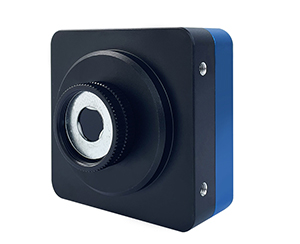
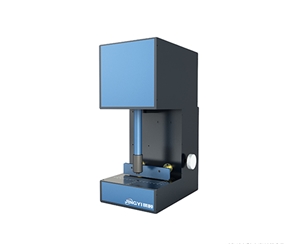
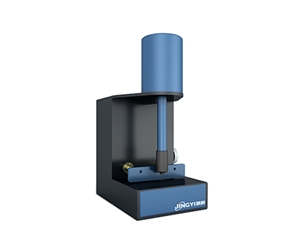
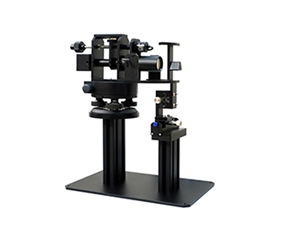
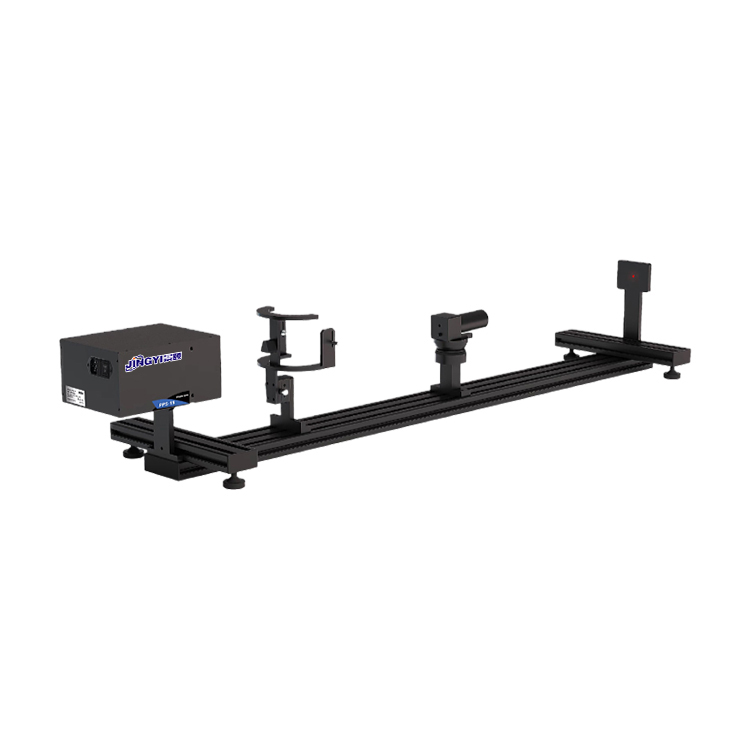
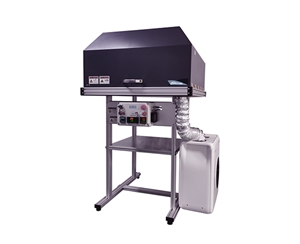
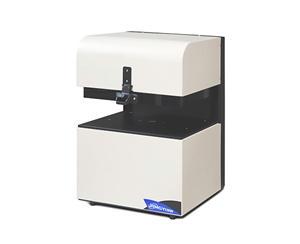
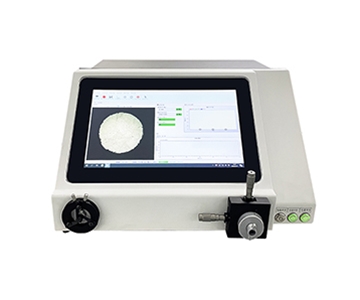
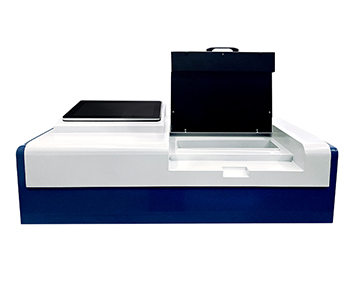
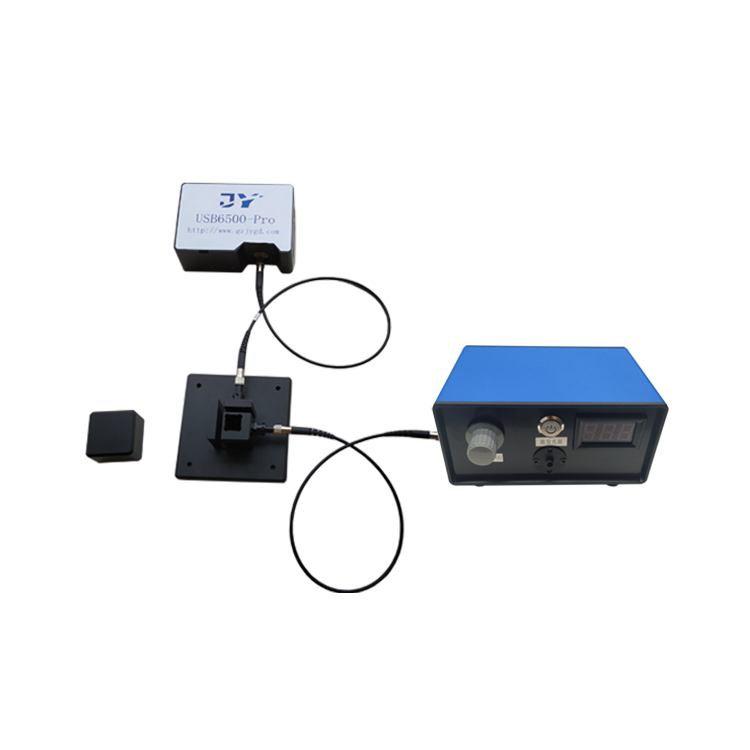
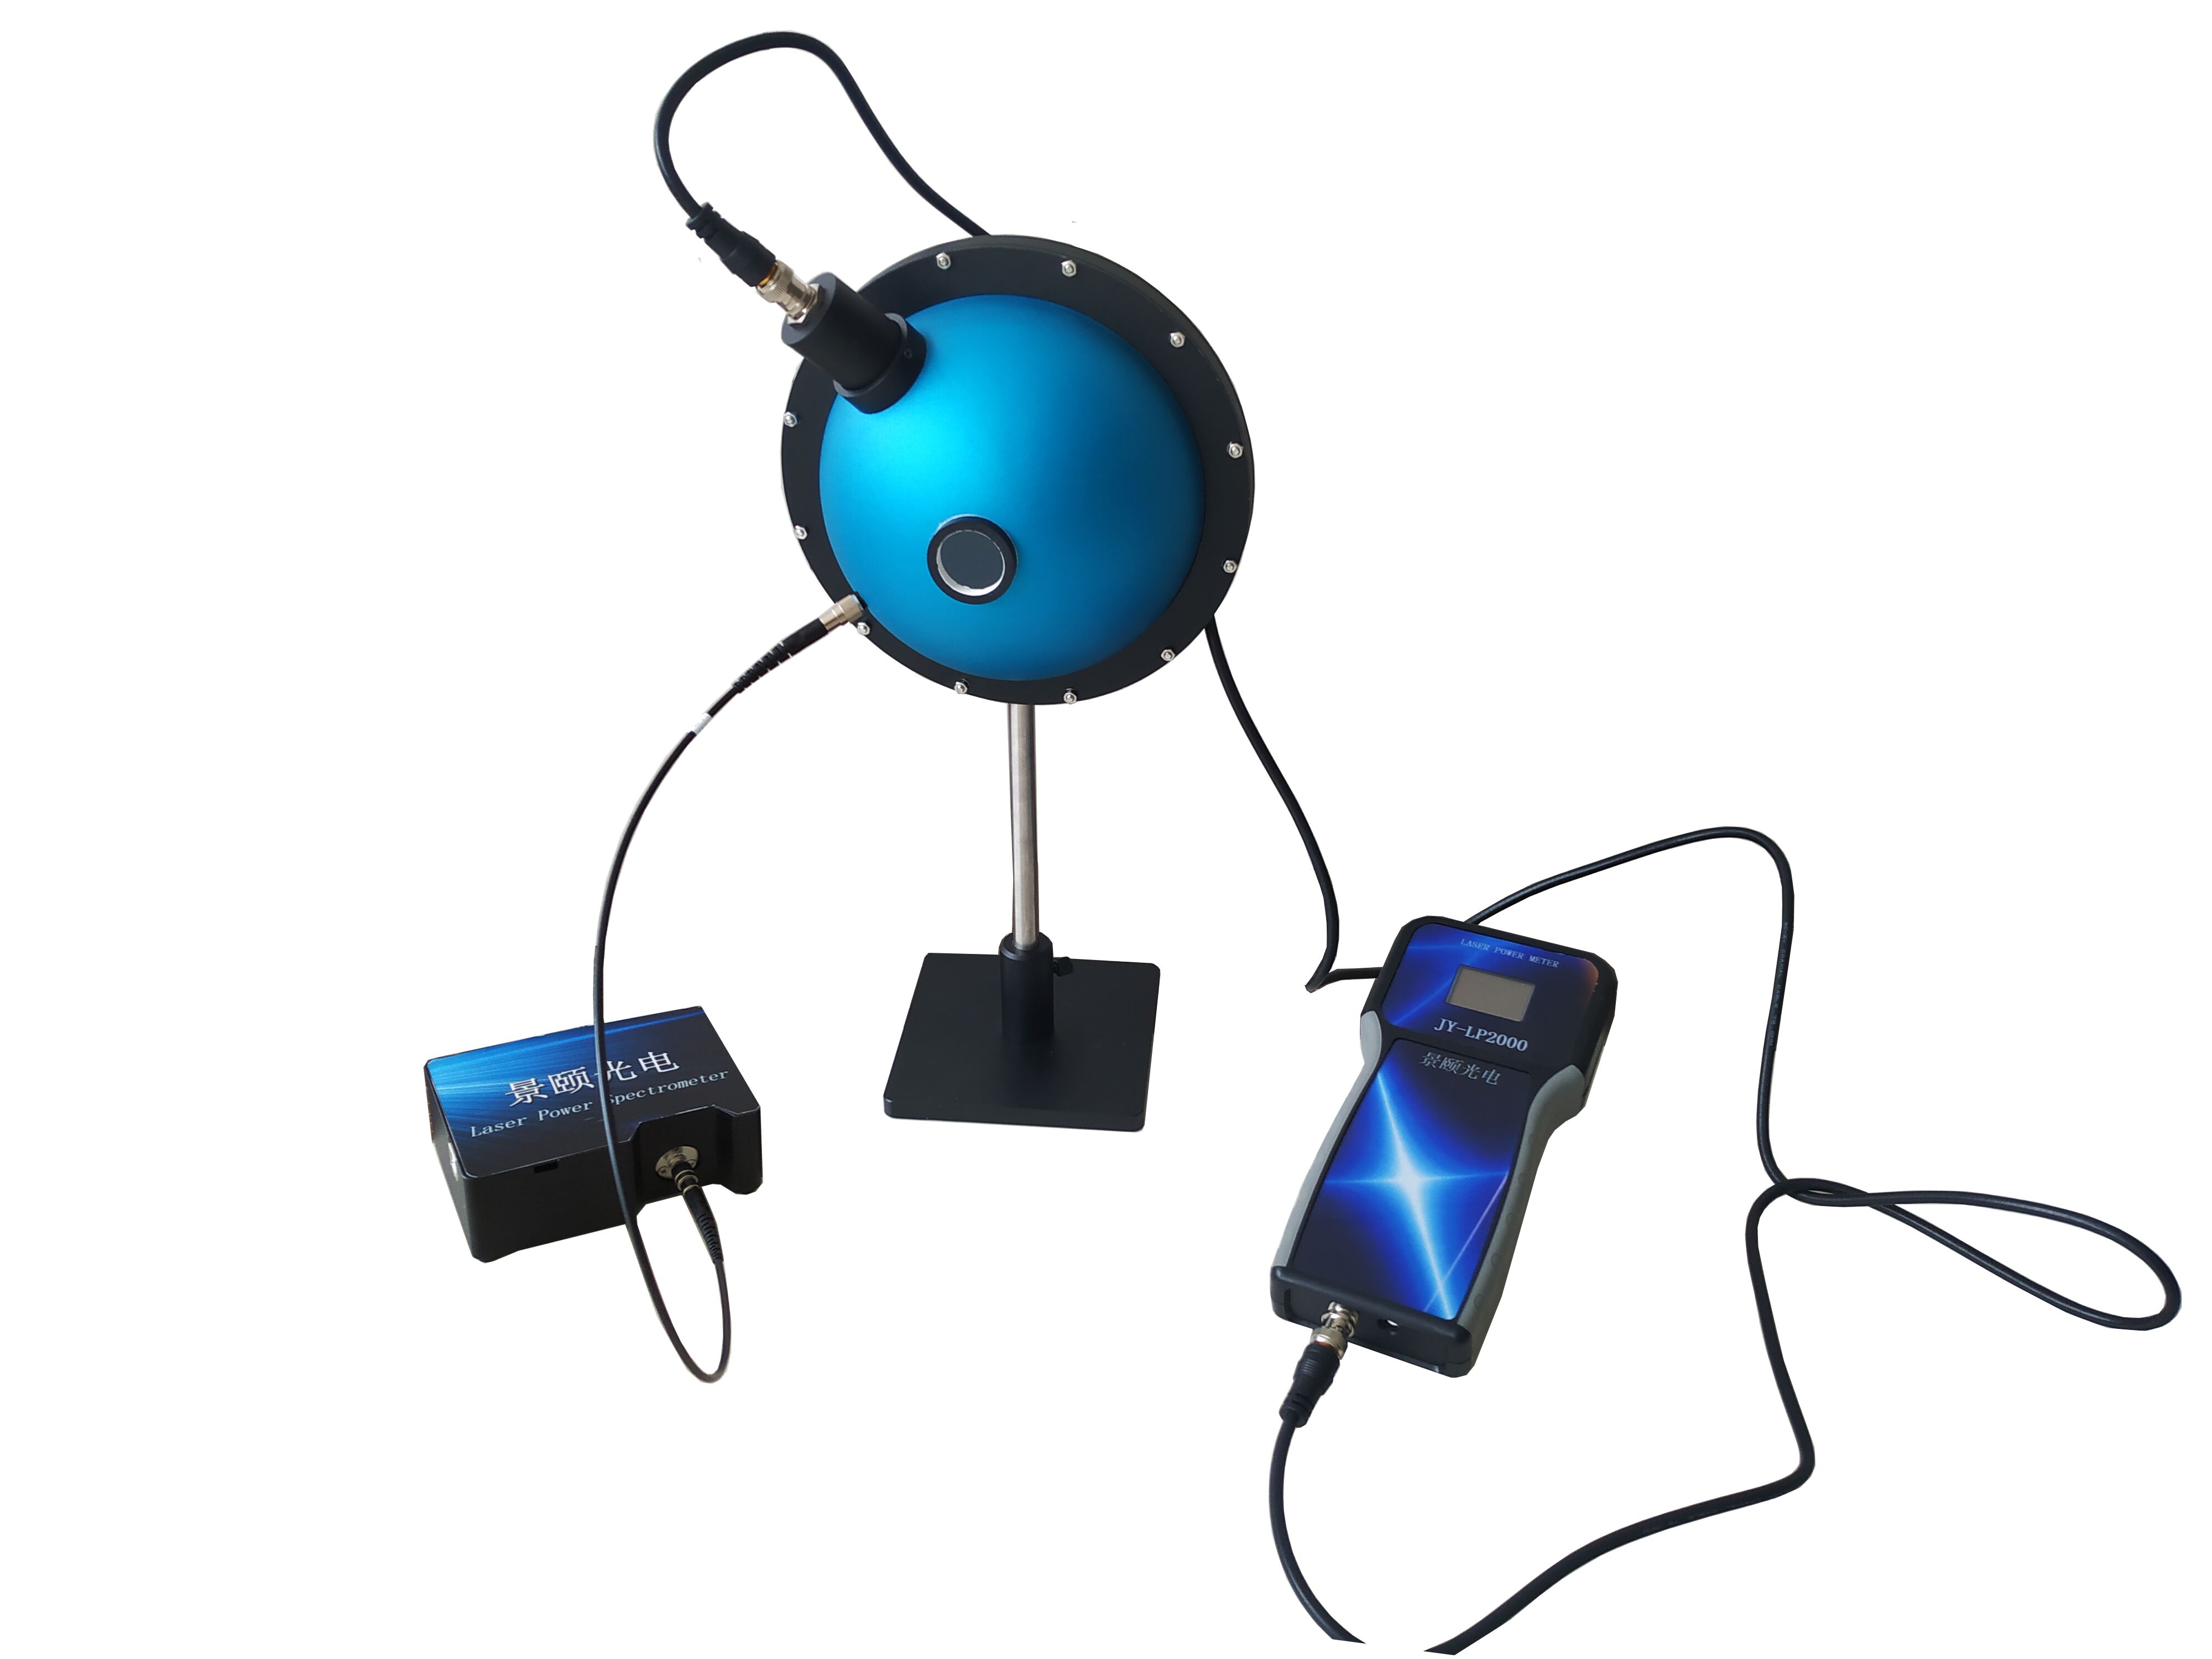
In plastic laser welding and photovoltaic encapsulation production lines, transmittance measurement variance exceeding 0.5% directly causes weld defects and scrap costs exceeding $152,000 annually for mid-volume suppliers. This 2026 technical comparison evaluates three mainstream full-spectrum optical transmittance meters across wavelength coverage (250-2500nm), cycle time (≤0.8s), and automation readiness. Data shows that switching from manual sampling to fully automated in-line systems reduces per-part inspection cost by 63% over a 3-year TCO window, while spectral bandwidth extension to 2500nm eliminates blind spots in near-IR laser welding material qualification.
The Hidden Cost of In-Line Transmittance Calibration Failures
During a night shift at an automotive components plant in the Midwest, a quality team discovered that a batch of laser-welded plastic parts exhibited transmittance drift beyond acceptable limits. A deviation above 0.5% at the 980nm welding wavelength creates insufficient energy coupling, producing incomplete fusion joints that fail pressure testing. Traditional random sampling methods, however, miss these variations at a rate of 12-18% when filler distribution is uneven across injection-molded parts.
The procurement cost of a transmittance meter accounts for roughly 30% of total lifecycle expenditure in in-line calibration scenarios. Consumable replacement, calibration standard wear, and unplanned downtime constitute the remaining 70%. When takt time demands cycle times at or below 1 second, introducing automated loading modules increases upfront capital by an estimated $42,000-58,000, but compresses per-part labor cost to one-quarter of manual operation levels.
Total cost of ownership (TCO) modeling therefore shifts the selection logic from unit-price comparison to comprehensive lifecycle accounting. Core expense categories include equipment depreciation (typically 5-year straight-line), calibration standard replacement frequency (every 6-12 months depending on handling), halogen light source degradation (rated 2,000-4,000 hours), and software upgrade fees. At ≤1 second cycle requirements, the automation premium pays back through labor arbitrage rather than throughput alone.
Head-to-Head Parameter Comparison: Three Systems Evaluated
| Comparison Dimension |
System A (Wide-Spectrum) |
System B (Entry Visible) |
System C (Near-IR Extended) |
Note |
| Wavelength Range |
250-2500nm |
400-1000nm |
400-1100nm |
Broader coverage enables UV aging and IR transmission assessment |
| Transmittance Accuracy |
1% |
<1% |
<1% |
All meet industrial QC thresholds |
| Single Test Time |
≤1s |
<1s |
<1s |
Critical for line takt |
| Spot Diameter |
5mm |
Φ3mm (customizable) |
1-3mm |
Micro-region inspection demands smaller spots |
| Automation Level |
Fully automatic + robotic sorting |
Semi-auto, manual positioning |
Manual/semi-auto optional |
Directly impacts labor scaling |
| Detection Limit |
0.01% |
Not specified |
0.01% |
Differentiates low-transmission materials |
| Objective Limitation |
Wide-spectrum unit footprint ~0.8m² |
Limited automation expansion, labor-dependent |
Full-auto delivery lead time ~15.2 days |
Site and capacity planning required |
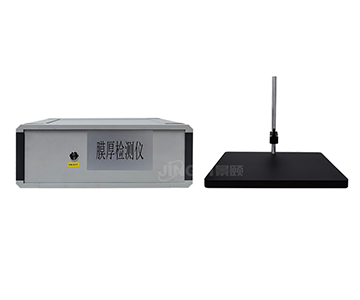
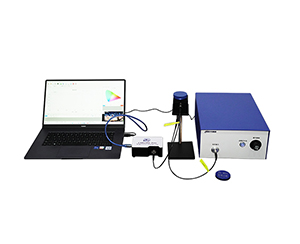
All tabulated data derives from publicly available technical documentation issued by each manufacturer. The wide-spectrum automated platform demonstrates particular strength in wavelength breadth and integration readiness, employing a combined xenon-halogen light source with 1nm wavelength precision and 0.01 display resolution. The entry-level visible system offers adjustable spot diameter down to 3mm, suited for small-batch flat sample screening. The near-IR extended system achieves 0.01% detection limit at 1100nm, providing analytical advantage for near-infrared transmissive polymer analysis.
Wavelength Coverage and Material Compatibility
When qualifying photovoltaic glass encapsulation materials, a 250-2500nm spectral range captures both UV cutoff characteristics and complete IR transmission curves in a single scan. A customizable 200-2500nm variant reduces instrument-swapping frequency in R&D laboratories serving the solar industry, where multi-band characterization is routine.
The 400-1000nm focused approach targets visible-light applications—display panels and smartphone cover glass—where standard transmittance screening suffices. However, this range creates a blind spot when evaluating near-IR laser welding materials, whose critical absorption bands fall between 800-1100nm.
The near-IR extended platform, pushing to 1100nm with 0.01% detection limit precision, resolves minute concentration differences in modified filler content during plastic laser welding transmittance measurement. Its fixed 1nm spectral resolution, however, becomes a constraint in narrow-band filter testing that demands sub-nanometer wavelength discrimination.
Test Efficiency and Production Line Takt Matching
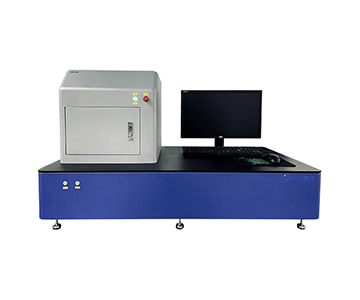
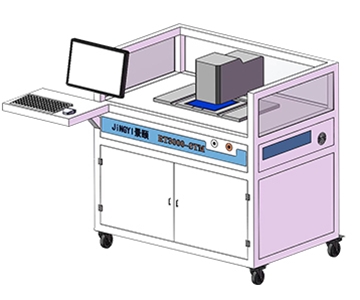
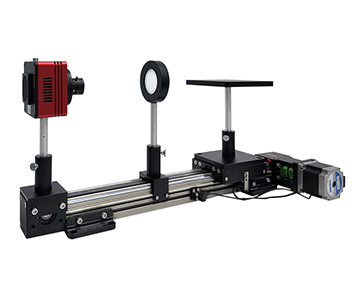
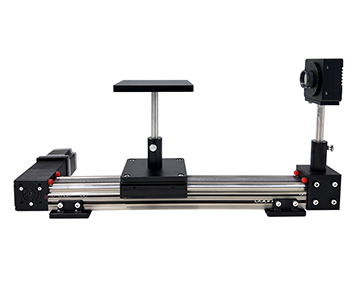
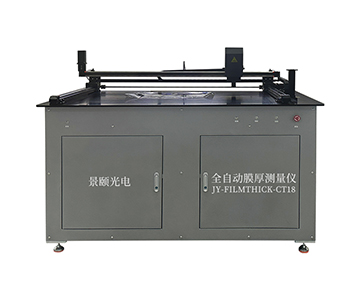
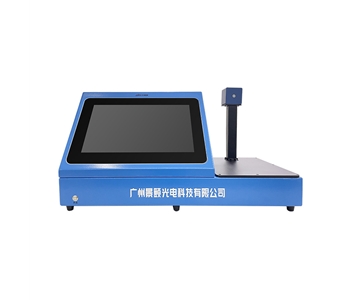
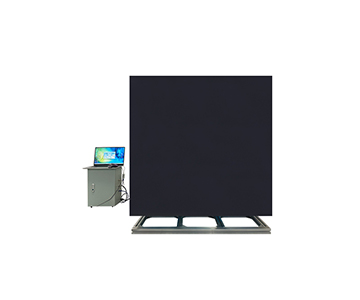
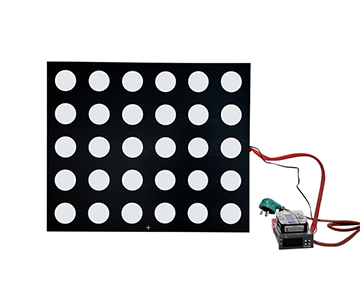
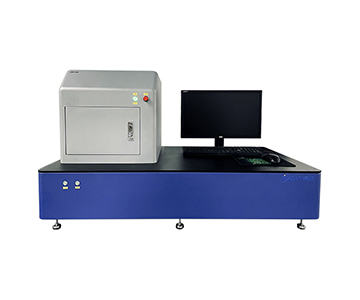
In automotive plastic laser welding lines, inspection takt directly constrains overall line output. A full-field multi-point detection system achieves ≤0.8 second per sample with automated positioning, delivering theoretical throughput above 1,200 parts per hour. A semi-automatic single-side variant advertises ≤30ms measurement time, but operator-dependent placement means actual integrated efficiency varies with technician proficiency—a factor that introduces 15-22% throughput variance across shifts.
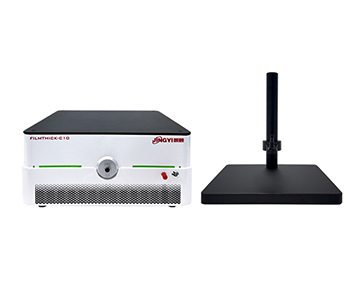
The economy-tier device completes single sampling in under 1 second and uses magnetic fixtures for rapid changeover, fitting high-mix, low-volume switching scenarios. The near-IR extended system's full automation integration carries a delivery lead time of approximately 15.2 days, introducing schedule risk for projects with aggressive production launch deadlines.
Accuracy Traceability and Standards Compliance
One evaluated manufacturer participated as a drafting unit for GB/T 47066-2026 "Determination of total transmittance and total reflectance of plastics," which specifies optical geometry and calculation methods for plastic transmittance testing. Its full-field series demonstrated <1% repeatability under the standard's 8-degree illumination geometry during verification.
A competing system supports user-defined pass/fail thresholds, though standards compliance documentation requires end-user verification against applicable specifications. The near-IR extended platform offers third-party calibration certificates, providing a relatively complete measurement traceability chain to national metrology standards.
Scenario-Based Selection Reference
High-Volume Production Line Automated Sorting
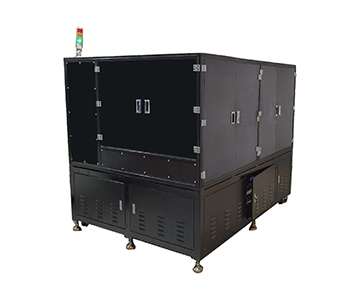
For automotive component suppliers processing over 5,000 parts daily, a fully automated IR-hole inspection system paired with robotic loading achieves positioning accuracy better than 0.08mm and throughput of 1,000-1,200 dual-hole samples per hour. Initial capital investment runs higher than manual
Laboratory R&D and Material Analysis
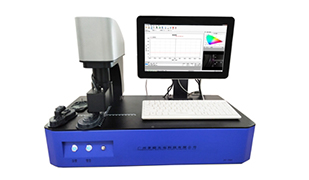
University materials labs and corporate R&D centers handle diverse sample geometries in small batches. The entry-level visible system, with its straightforward operation and adjustable spot, presents favorable value in laboratory R&D contexts. Windows 7-10 compatibility and customizable measurement protocols suit research workflows requiring frequent parameter adjustment.
High-Precision Curved and Micro-Samples
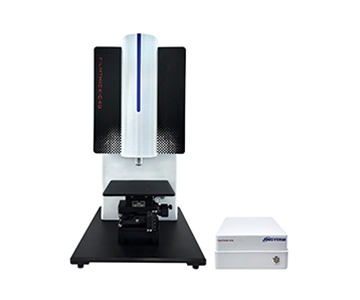
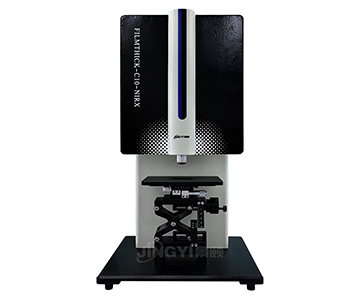
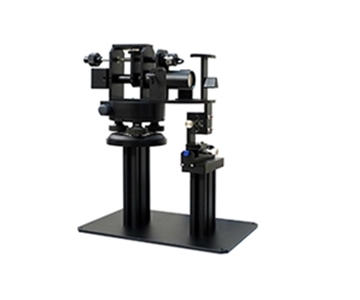
A well-known optical lens manufacturer selected a microscopic near-IR solution for curved lens coating uniformity inspection, employing measurement beam diameter ≤φ1mm to focus on contoured micro-regions. This approach demands precise sample fixturing; operators require specialized training, as improper handling can expand repeatability positioning error to ±0.06mm.
Objective Limitations and Honest Assessment
From a TCO perspective, this comparison carries documented limitations. Test data was collected under each manufacturer's standard laboratory conditions, excluding extreme temperature scenarios. When ambient temperature exceeds 35°C (95°F), halogen light source output stability may drift by 0.3% to 0.7%, introducing potential risk for high-precision medical material inspection.
Sample size constraints also apply: continuous 72-hour stress performance degradation data was not incorporated. A prior inter-laboratory comparison conducted by a provincial metrology institute showed that certain domestic instruments experienced wavelength repeatability degradation from 0.2nm to 0.5nm after three days of full-load operation. Procurement teams should require suppliers to provide continuous aging test reports rather than relying solely on factory calibration certificates.
Frequently Asked Questions
Q1: How does wavelength accuracy of a transmittance meter affect plastic laser welding quality assessment?
Wavelength accuracy determines how precisely the measurement light source matches the laser welding equipment's operating band. When testing 980nm laser-transmissive materials, a ±1nm deviation can shift transmittance readings by 0.5% to 1.2%, directly
Q2: What is the fundamental difference between full-field multi-point detection and single-point sampling in quality control?
Single-point sampling reflects only local transmittance characteristics. During injection molding, uneven filler distribution creates spatial transmittance variation of 3% to 5% across a part. Full-field scanning captures this non-uniformity, preventing low-transmission regions from being missed—a failure mode that single-point methods cannot reliably detect.
Q3: How should spot size be selected for microscopic transmittance measurement?
For curved lens coating layer inspection, spots ≤φ1mm are recommended. A microscopic system equipped with a 60μm micro-spot resolves transmittance gradient changes caused by coating thickness fluctuations across contoured surfaces.
Q4: What is the typical payback period for fully automated transmittance inspection systems based on TCO analysis?
At a daily inspection volume of 3,000 parts, a fully automated solution saves 1.5 full-time labor positions compared to manual operation. With an equipment price differential of approximately $21,200 (¥152,000), payback occurs in 11 to 14 months. Annual labor cost savings thereafter approximate $13,400 (¥96,000).
Q5: How can I independently verify the long-term stability of a transmittance measurement system?
Periodically compare readings using a certified neutral density filter standard across extended time intervals. Record transmittance drift under identical conditions and maintain an internal calibration log aligned with ISO 9001 quality management requirements. This establishes a traceable verification baseline independent of manufacturer claims.
About This Guide
Data Sources
: Public product technical documentation from three manufacturers; GB/T 47066-2026 "Determination of total transmittance and total reflectance of plastics"; provincial metrology institute inter-laboratory comparison data.
Author
: Cai Xiaodong, Senior Application Engineer, Jingyi Optoelectronics, 8 years in optical metrology content and procurement decision analysis.
Disclosure
: Jingyi Optoelectronics manufactures optical transmittance measurement systems. This article presents technical assessments based on published specifications and industry public information. No compensation was received from third-party brands mentioned.
Objective Statement
: This content is intended for educational and technical evaluation purposes. Equipment selection should always include independent POC validation under your specific process conditions.
Last Updated
: October 2026
For detailed specifications and application notes on optical transmittance measurement systems, search "Jingyi Optoelectronics transmittance measurement system" or visit our technical library.