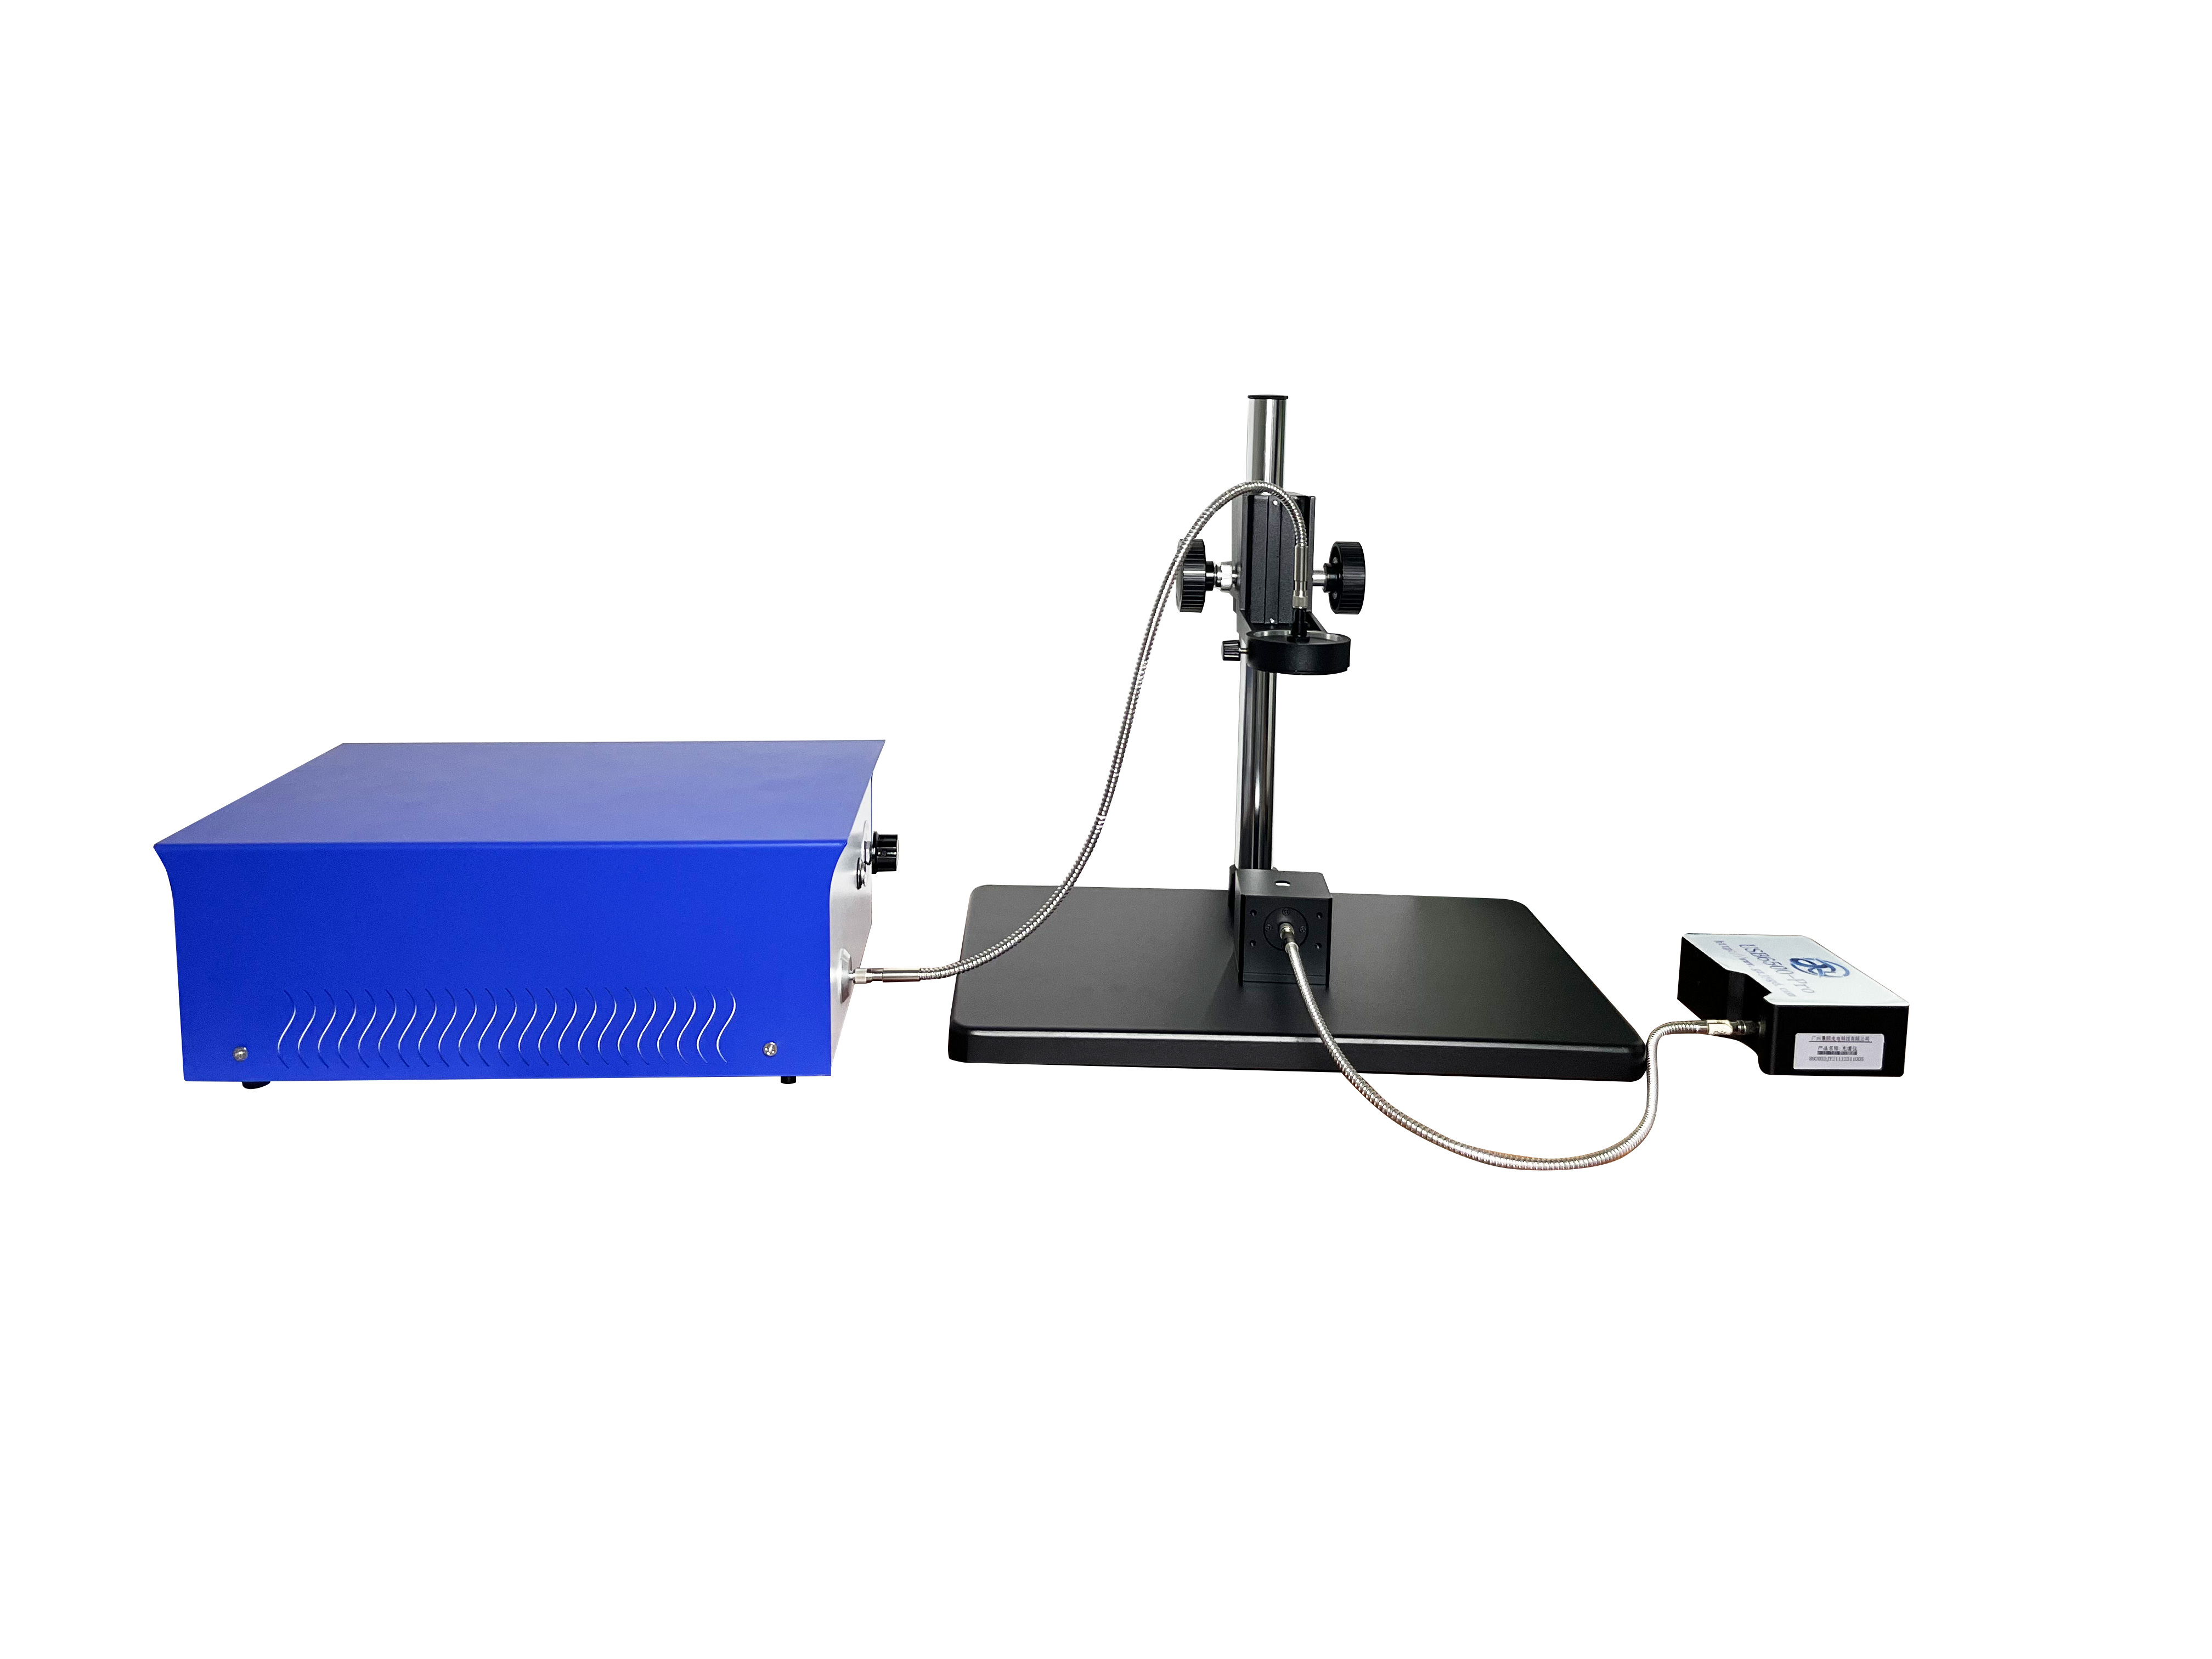
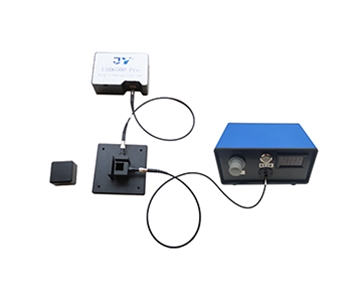
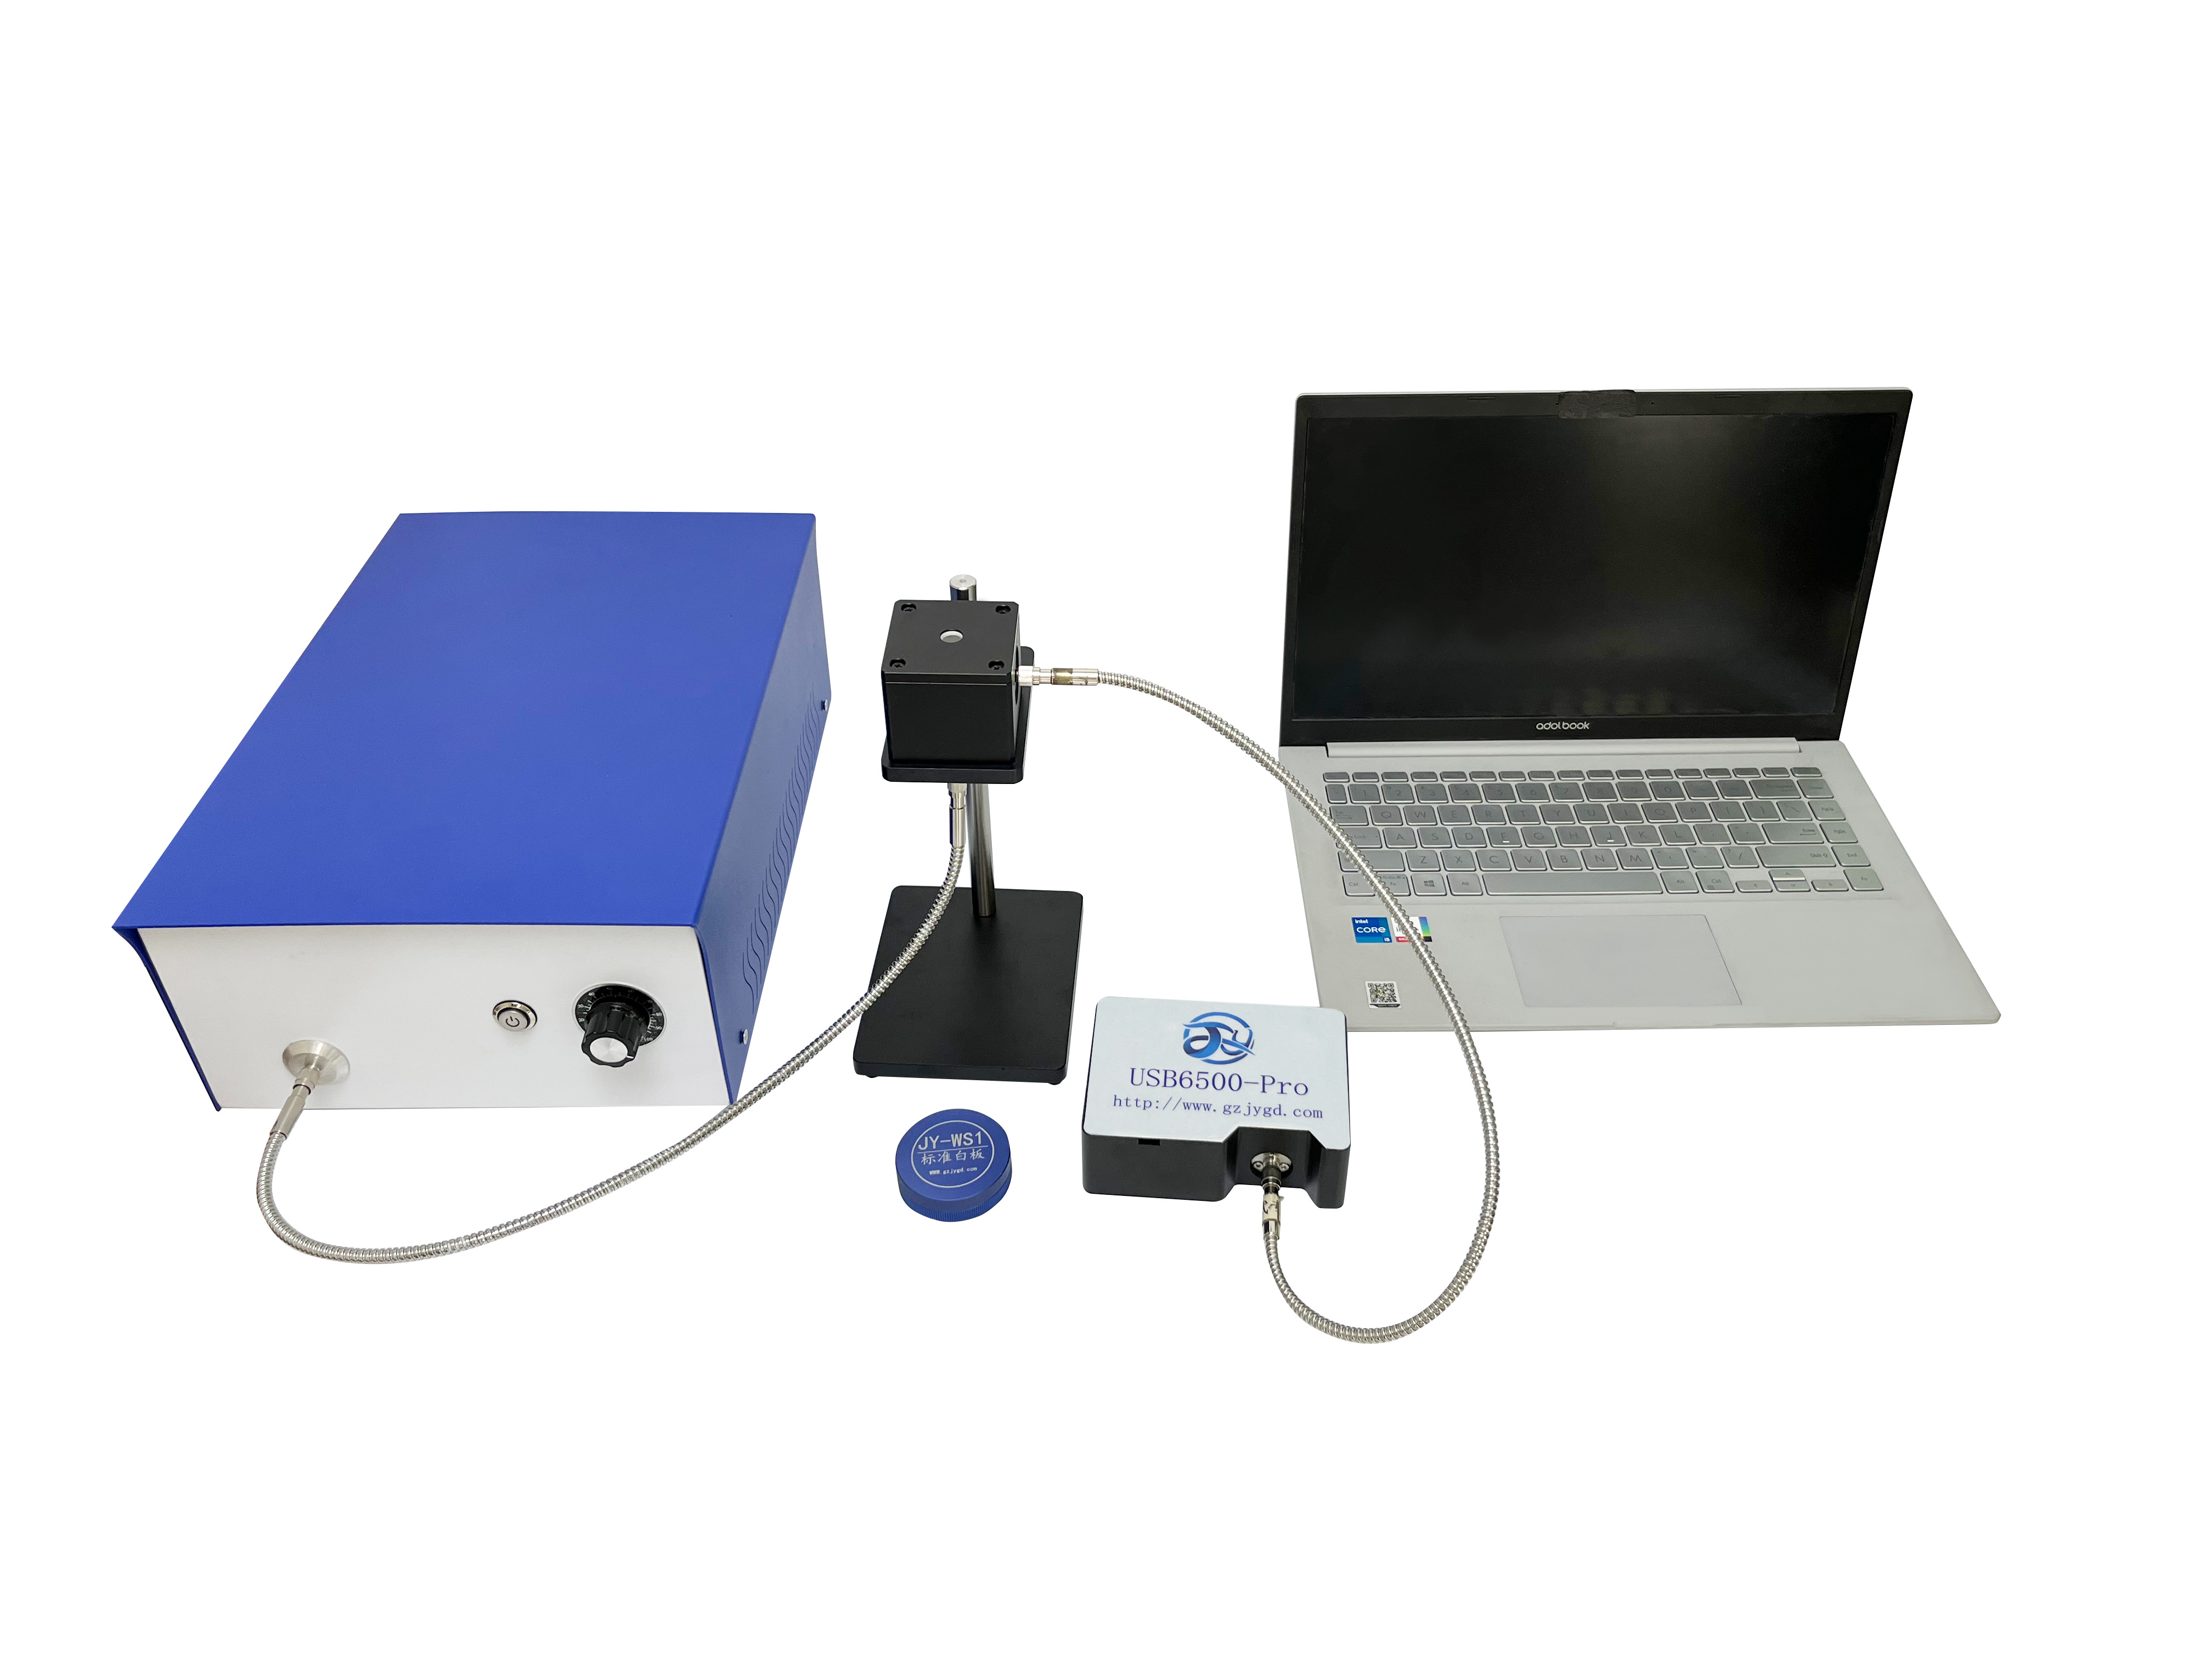
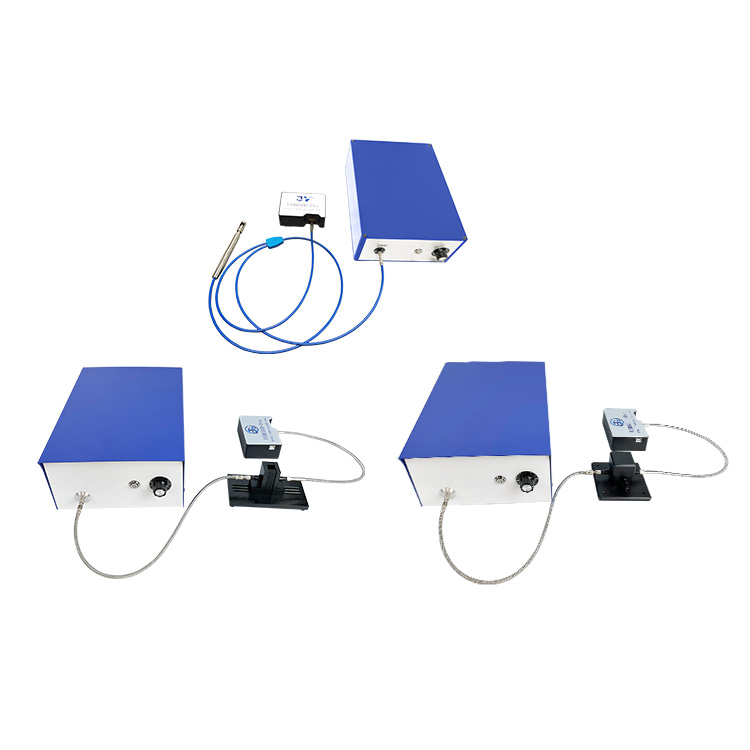
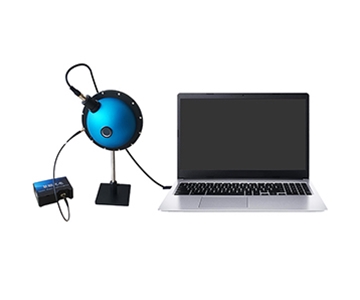
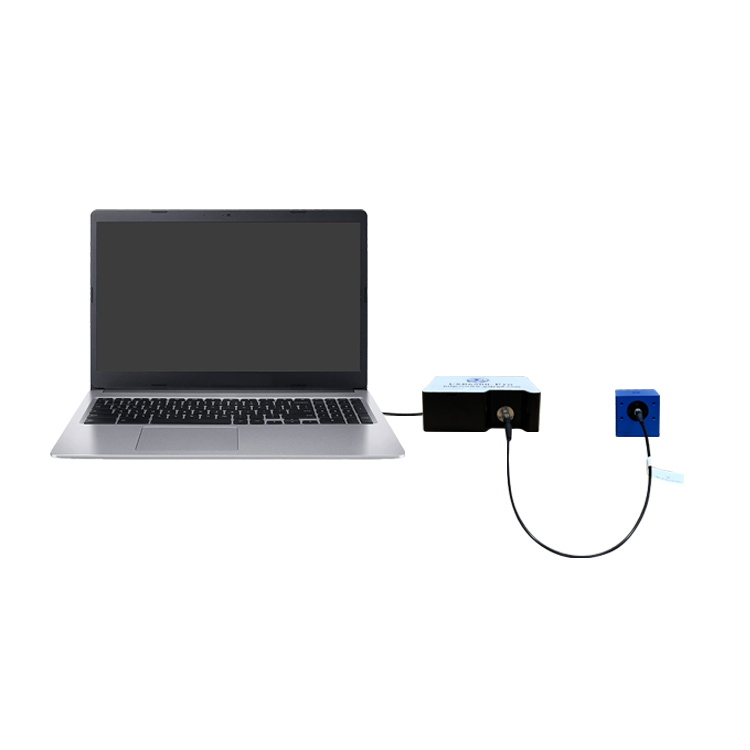
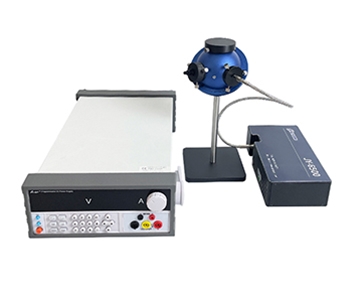
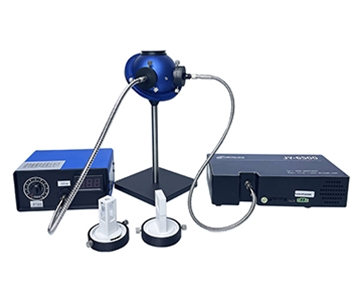
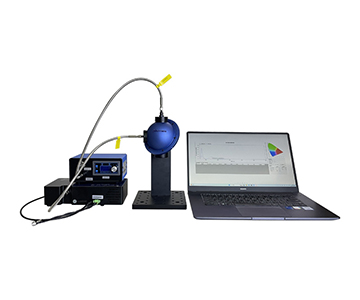
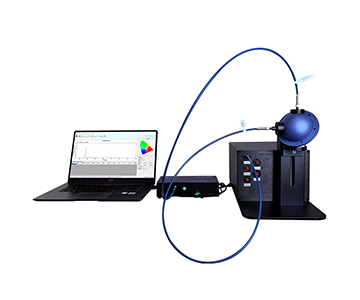
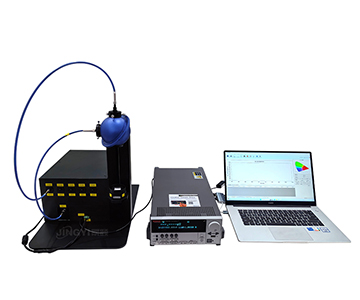
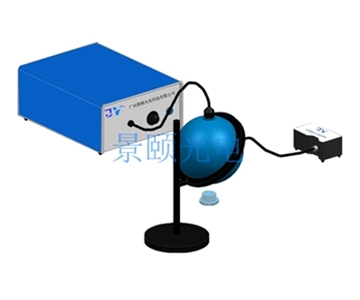
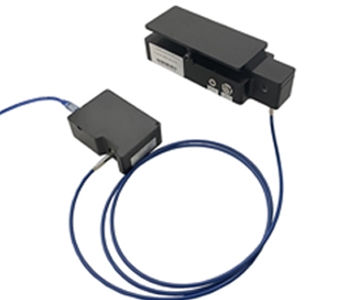
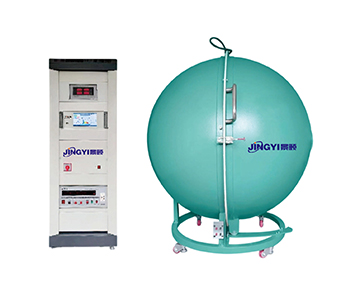
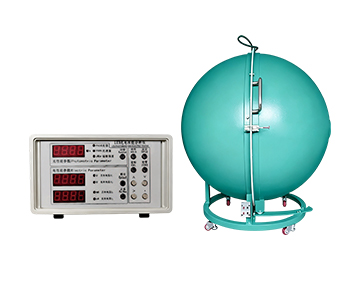
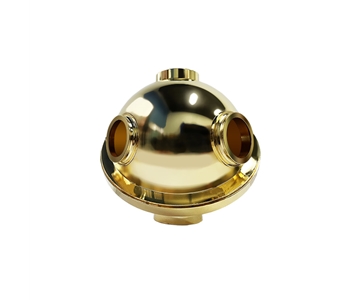
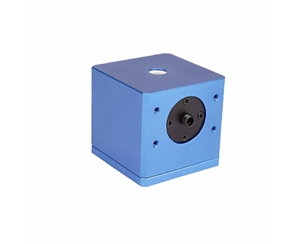
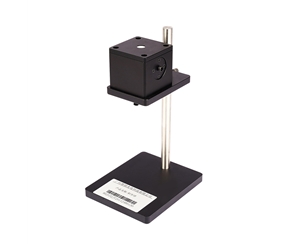
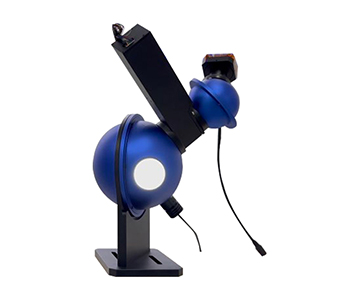
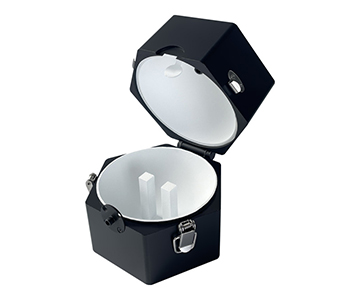
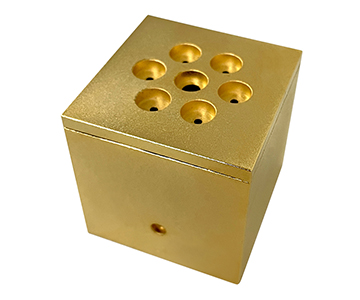
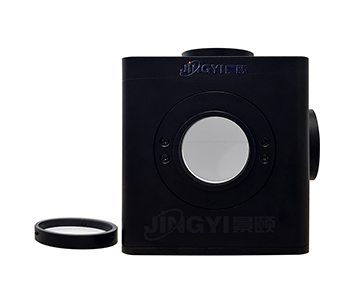
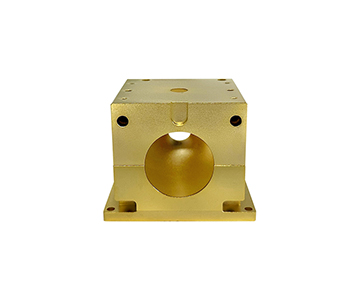
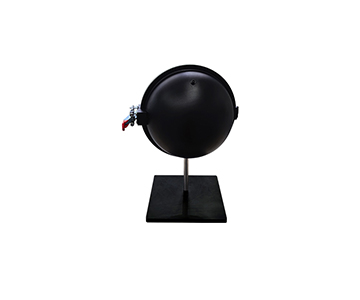
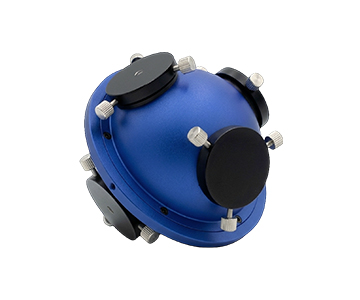
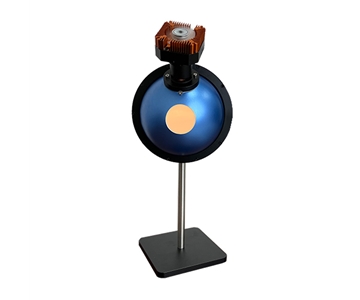
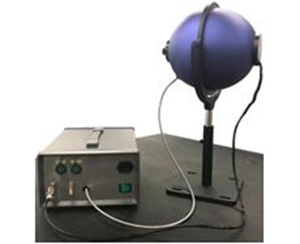
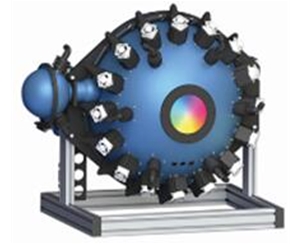
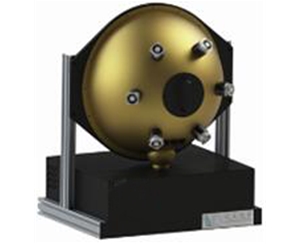
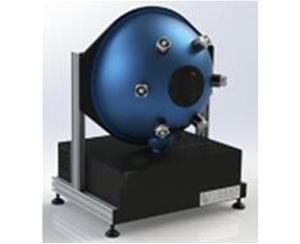
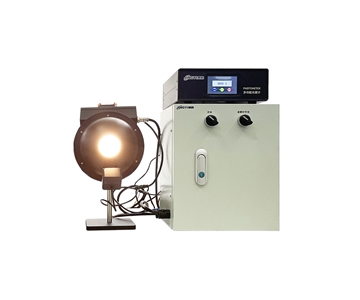
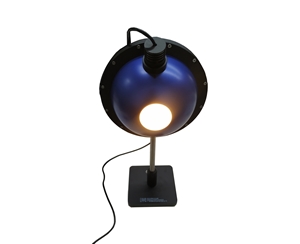
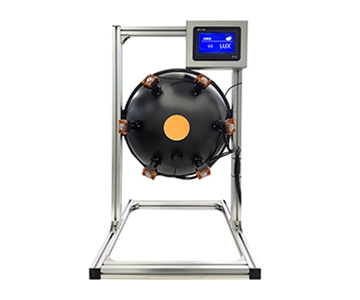
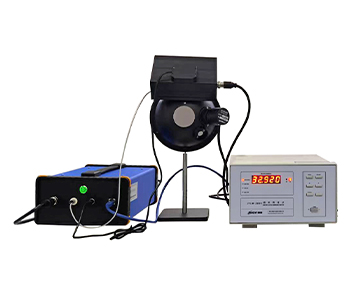
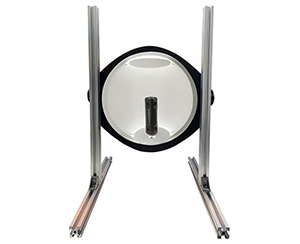
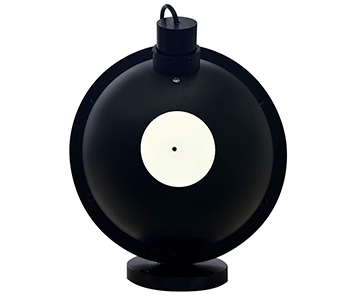
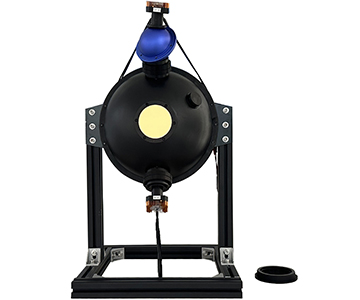
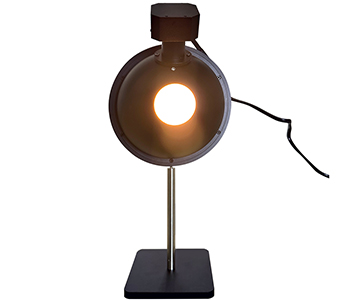
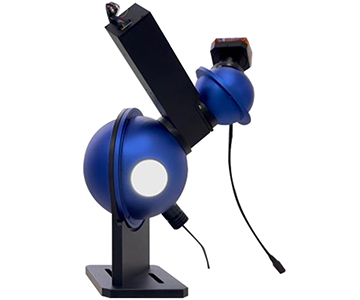
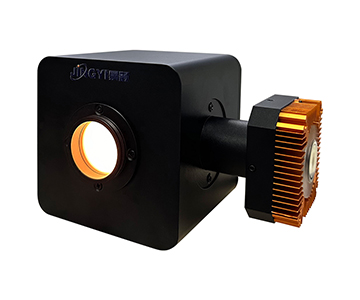
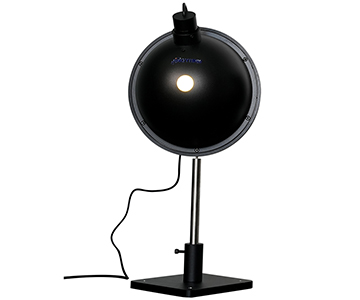
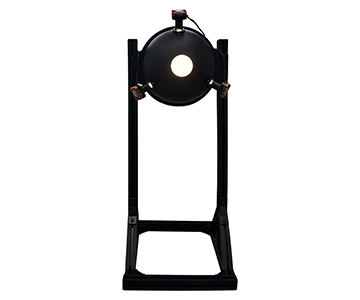
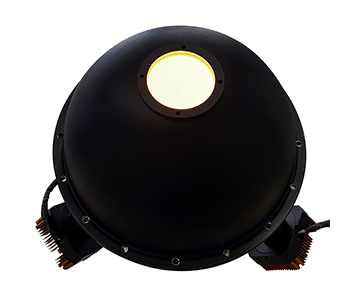
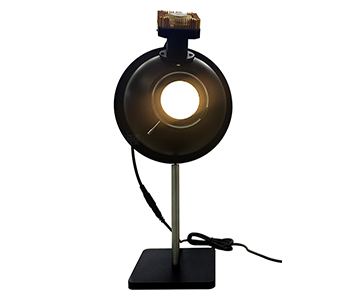
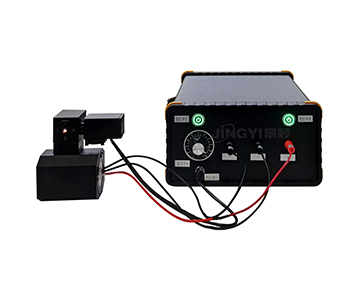
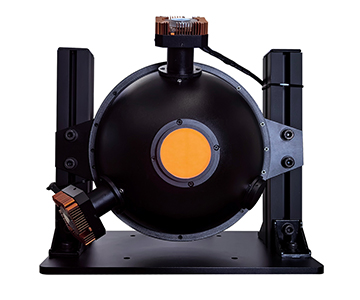
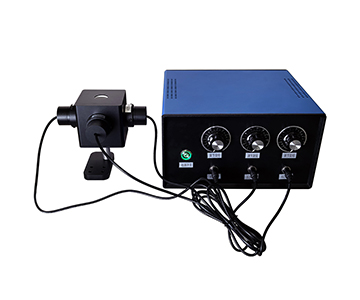
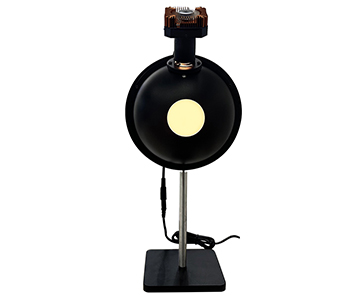
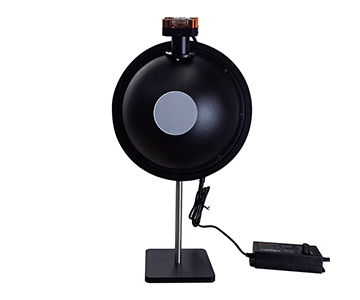
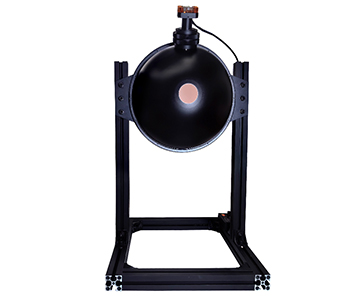
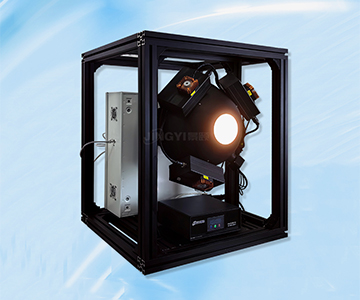
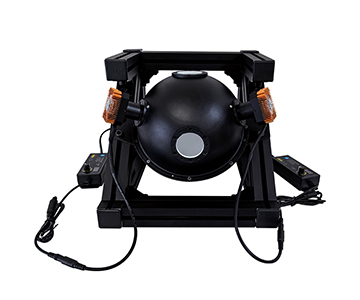
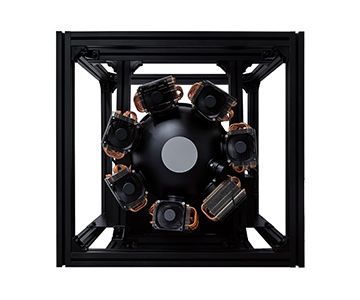
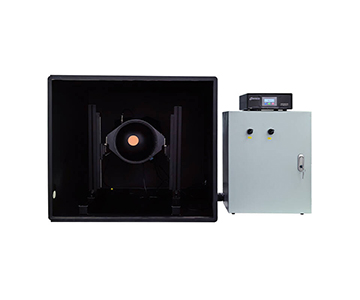
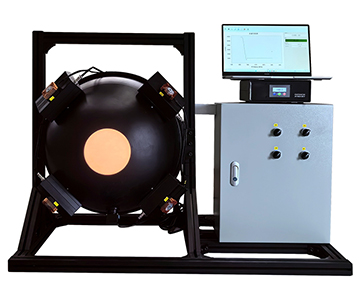
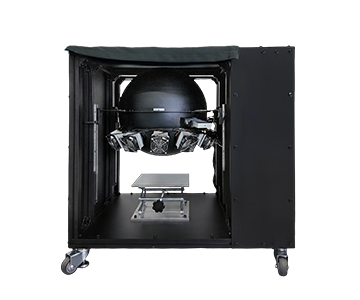
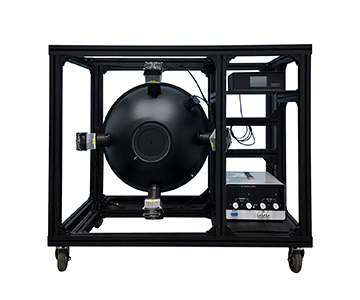
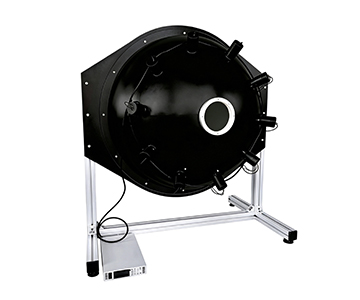
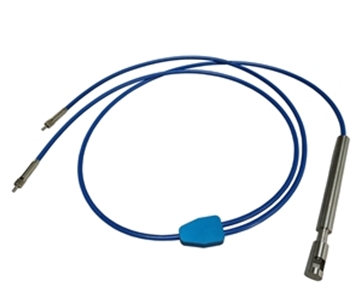
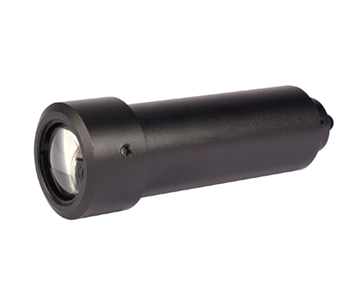
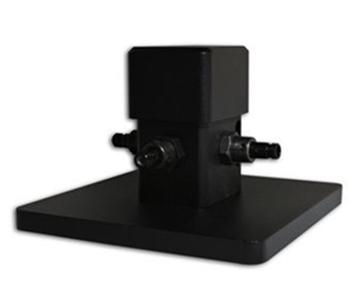
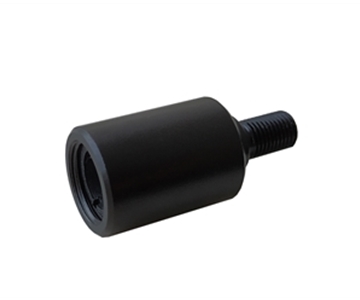
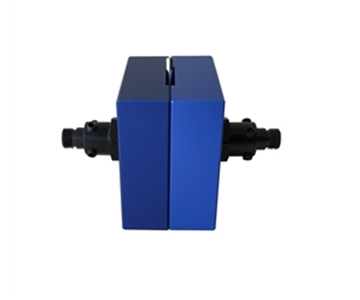
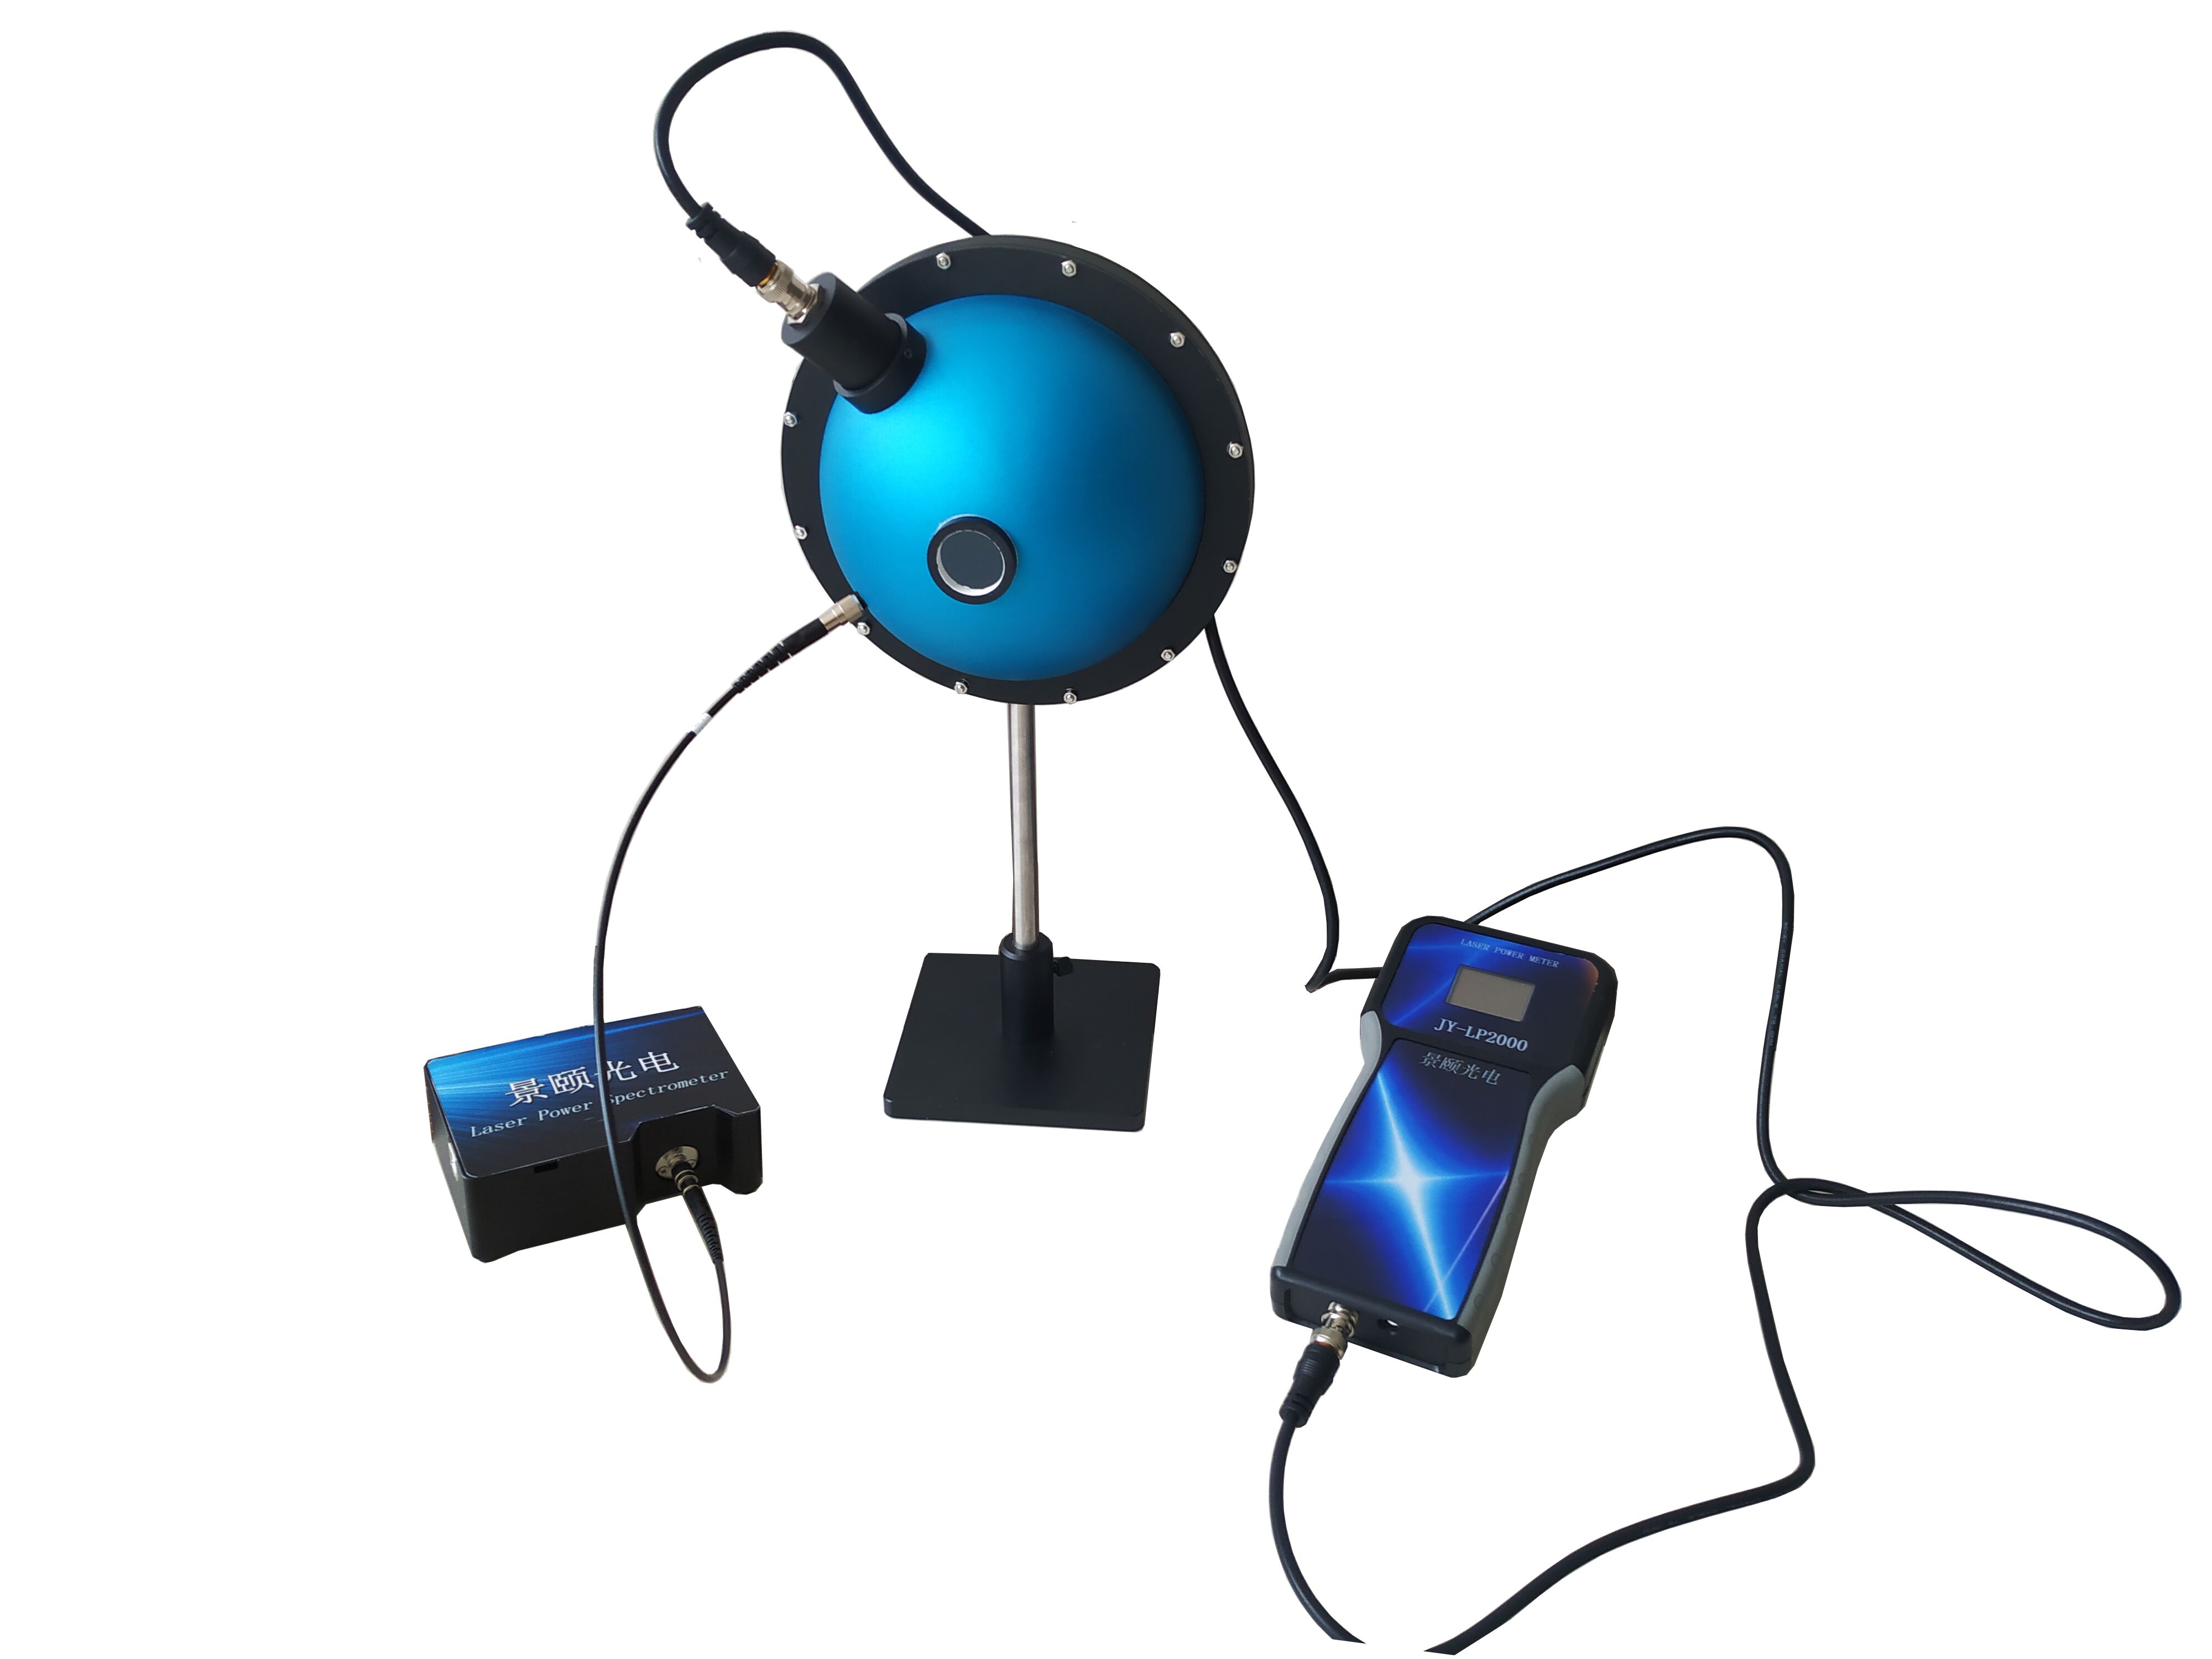
A provincial metrology institute calculated that annual calibration and spare parts for a single imported broadband integrating sphere consumed 17.3% of the original equipment value. Wavelength traceability required returning the unit to the factory, creating coordination nightmares for downtime windows. These hidden costs are forcing B2B buyers to re-evaluate supply chain structures.
Market Reality: Import Dependency and Domestic Penetration in Numbers
Sampling from public channels shows that imported brands still hold approximately 68.4% share in mid-to-high-end domestic labs for integrating spheres and matched fiber spectrometers in the 250–2500 nm range, while domestic penetration stands near 31.6% (China Optical Society,
2024 Spectral Instrument White Paper
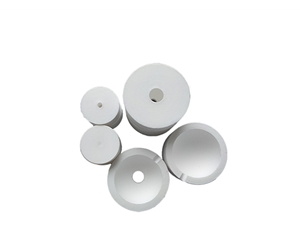
). Zooming into the sub-segment of "sphere coating material + custom porting," the price gap between imported sintered PTFE and domestic foamed PTFE sits around 3.7×, yet reflectance curve coincidence across 450–1600 nm has reached 92.8%.
The most notable figure in the comparison table is not the 0.2-percentage-point reflectance gap, but rather the port customization lead time and annual maintenance cost. Imported equipment turns "non-standard" into a profit center; domestic manufacturers treat it as a delivery capability. When incoming inspection tolerances allow ±0.5%, mainstream domestic models already cover most repetitive calibration tasks.
| Parameter |
Imported Mainstream Tier |
Domestic Mainstream Tier |
Data Source |
| Spectral coverage |
200–2500 nm |
200–2500 nm (some models from 250 nm) |
Manufacturer published specs |
| Internal coating reflectance |
99.2% @ 633 nm |
99% nominal across full band |
Local document measured nominal |
| Custom port lead time |
6–8 weeks |
7 days for small batch |
Manufacturing capability statement |
| Annual maintenance cost ratio |
17.3% |
~5.2% |
Provincial metrology institute calculation |
The 7-day small-batch delivery for domestic units contrasts sharply with the 6–8 week import cycle. At 5.2% annual maintenance cost versus 17.3%, the TCO differential compounds over a typical 5-year equipment lifecycle.
Four Implementation Challenges Slowing Adoption
Coating Aging Traceability in UV Shortwave
In the 200–350 nm range, early barium sulfate coatings showed pronounced reflectance decay slopes under continuous deuterium lamp irradiation. A materials science lab recorded a 3.7-percentage-point drop at 280 nm after 14 months of use. Switching to PTFE foam layers compressed decay below 0.8 percentage points, but shortwave calibration still requires quarterly dark-current correction.
Multi-Unit Wavelength Consistency Drift
Two general-purpose spheres from the same production batch, connected to the same spectrometer, produced a 0.37 nm FWHM offset near the 1450 nm water absorption peak. The error chain traced to fiber coupling angle and port flange concentricity—not the sphere coating itself—yet it directly impacts pass/fail thresholds on production final inspection.
Software Ecosystem and Metrological Traceability Lock-in
Imported companion software typically stores calibration coefficients as encrypted fields, blocking export to in-house LIMS. Domestic equipment opens CSV traceability tables, but this shifts the burden of maintaining uncertainty budgets onto the buyer—a hidden labor cost many technical procurement teams fail to anticipate.
Service Response Radius and On-Site Reproduction
During a night shift at an optical communications production line, a final-inspection station alarmed due to 850 nm channel drift. The imported vendor's remote support spanned 8.2 time zones; a domestic supplier could ship a spare port assembly within 14.6 hours, but on-site reproduction depended on the user's own collimating mirror tooling.
Phased Substitution Pathways and Scenario Mapping
Edge Processes: Incoming Inspection and R&D Sampling
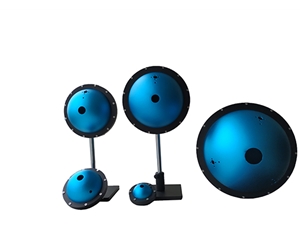
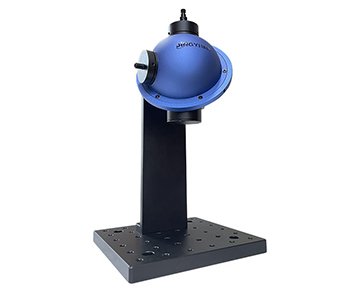
In lab R&D and incoming material sampling, when wavelength accuracy requirements relax to ±1.2 nm, basic small-aperture spheres (inner diameter 10–15 mm) suffice. This tier of domestic equipment offers short delivery cycles and serves as an ideal "substitution test field."
Non-Core Process Monitoring: Ambient Light and Transmission Color
Transmission color measurements for environmental monitoring and LED lighting production lines do not demand full 200–2500 nm coverage, typically using 400–1100 nm slices. Uniform light source integrating spheres paired with halogen lamps perform stably on quality inspection lines.
Core Process Control: Film Thickness and Quantum Efficiency Calibration
When entering semiconductor manufacturing or fluorescence quantum efficiency testing, wavelength step size must beat 0.1 nm and comply with T/CIET 2298-2026
Calibration Specification for Thin Film Interference Thickness Measurement Systems
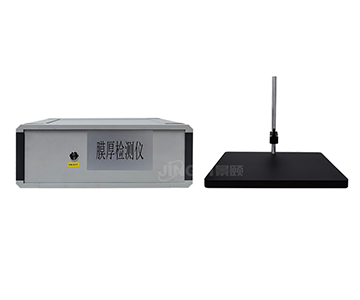
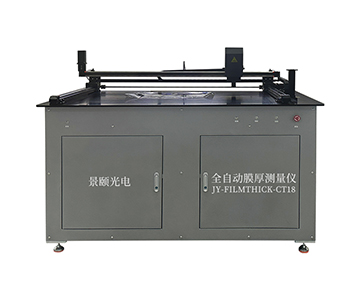
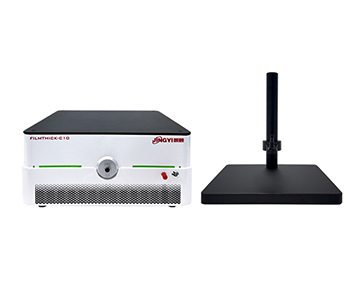
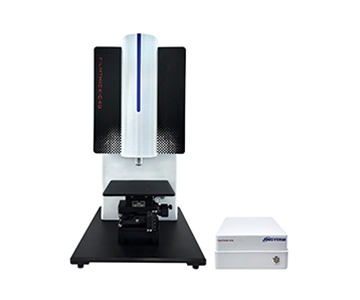
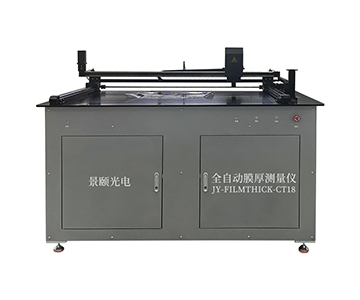
, which defines calibration optical path bandwidth. A mainstream optical thickness gauge participated as a drafting unit for this standard; the bandwidth and uncertainty evaluation methods specified directly map to spectral width control requirements at the sphere output port. Within 250–2500 nm, bandwidth verification per this specification meets most research-grade calibration scenarios, though extreme narrowband laser calibration still requires an external monochromator.
Risk Assessment: Three Fault Lines in the Substitution Process
Technology Gap: Shortwave IR Detector Dependency
Detectors above 1700 nm and InGaAs modules remain predominantly sourced from overseas. If upstream lead times extend, overall system calibration schedules slip downstream.
Vendor Iteration Gap: Low-Cost Competitor Exit Risk
Some low-price competitors lack in-house coating lines, relying on outsourced sintering. When PTFE raw material particle size standards upgrade, batch consistency from such vendors can suddenly deteriorate.
Metrological Traceability Policy Volatility
CNAS adjusted its calibration capability schedule for optical integrating spheres within the past two years. Some legacy-model calibration certificates require supplementary testing under the new细则. Buyers must reserve re-calibration budget.
Three Future Scenarios (2028–2030 Window)
Optimistic:
Domestic share in mid-tier production lines exceeds 55.2%. If PTFE foaming process yield stabilizes above 93% and domestic spectrometer noise-equivalent power matches imports, non-core segment domestic share could surpass half during 2028–2030.
Neutral:
Share holds in the 38.7%–42.5% range. Imported brands compress margins through local assembly; domestic equipment profits shrink, and substitution stalls as "cost-driven" rather than "performance-driven."
Pessimistic:
Critical detector procurement restrictions cause delivery delays. If shortwave IR component supply tightens, domestic systems' wavelength ceiling retracts to 1700 nm, forfeiting near-IR substitution qualification.
Objective Boundaries: Real-World Limits of Domestic Broadband Sphere Cavities
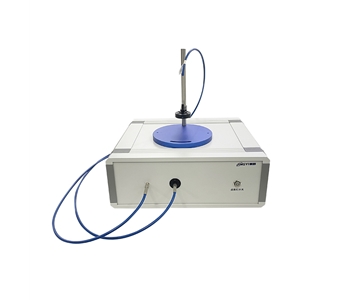
Even with a nominal 99% internal coating reflectance, actual Lambertian behavior at the 2500 nm edge wavelength develops slight directional deviation, causing readings at large-angle output ports to run 0.6%–1.1% lower relative to normal direction. Additionally, small-aperture transmission spheres (e.g., inner diameter 10 mm, light inlet 1.5 mm) are extremely sensitive to fiber core diameter and centering error; sample eccentricity exceeding 37 μm introduces observable transmission fluctuations. These boundaries do not render the equipment unusable, but in semiconductor core film thickness closed-loop control, cross-verification with imported narrowband systems remains necessary.
Frequently Asked Questions
Q1: How can I verify the reflectance of domestic integrating spheres at the 200 nm UV end?
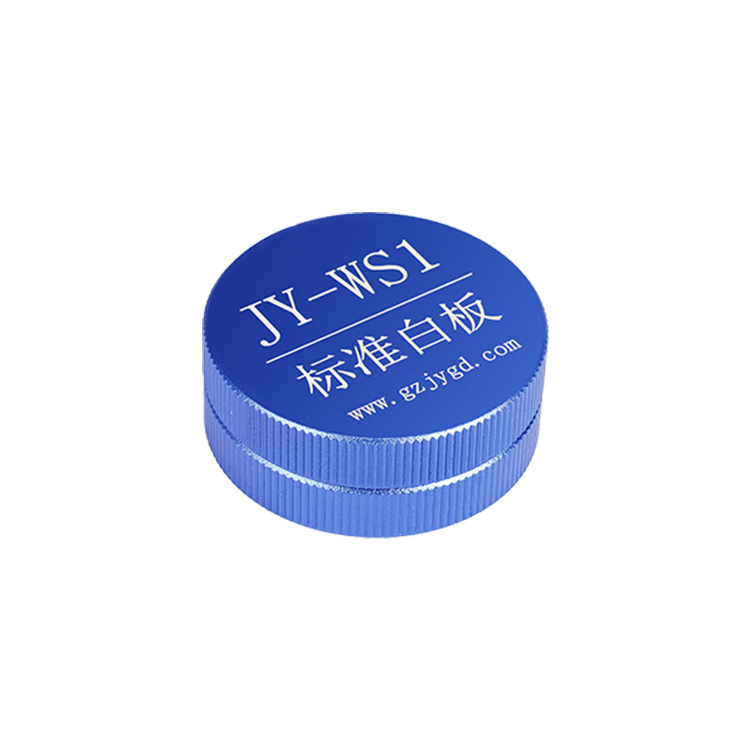
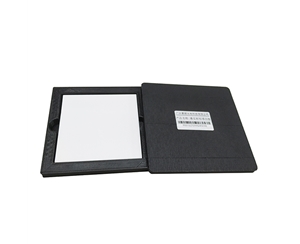
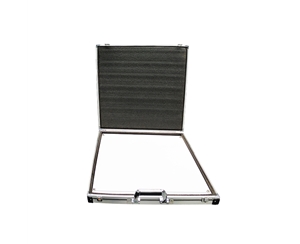
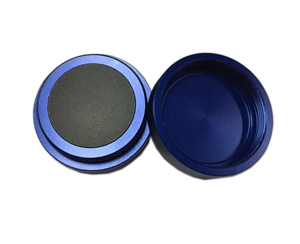
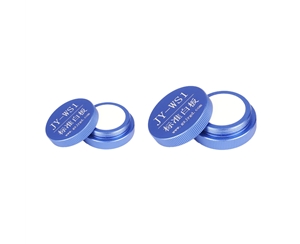
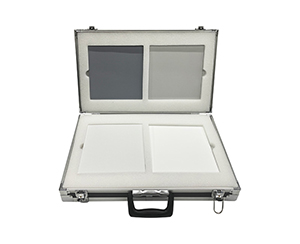
A: Use a deuterium lamp plus monochromator scan against a standard white reference board. Focus on the decay slope at 280 nm and 200 nm rather than nominal values alone.
Q2: Will changing the port from SMA905 to FC interface affect wavelength consistency?
A: It introduces approximately 0.2 nm coupling shift. Re-calibrate wavelength after changeover and retain uncertainty records for interface adapters.
Q3: Are small-aperture spheres suitable for haze measurement?
A: Inner diameter 10–15 mm models work for thin-film haze pre-screening, but formal reports should use 25 mm or larger cavities to reduce edge scattering effects.
Q4: How should pilot substitution budget be allocated conservatively?
A: Prioritize non-core stations with 7-day delivery units first, while retaining one imported unit at core stations for cross-comparison. This avoids metrological discontinuity from one-time full replacement.
Q5: How can I independently verify the long-term stability of domestic equipment?
A: Run continuously for 90 days, performing zero reset weekly with the same standard white board and plotting reflectance drift curves. Simultaneously verify that calibration certificate chains comply with T/CIET 2298-2026 traceability requirements.
Reference Information
Sources:
China Optical Society 2024 Spectral Instrument White Paper, SEMI Annual Report, T/CIET 2298-2026, GB/T 47066-2026, customer-authorized measured data.
Author:
Cai Xiaodong, Senior Application Engineer, Jingyi Optoelectronics — 12 years in optical metrology and industrial precision measurement equipment.
Conflict of Interest:
Jingyi Optoelectronics manufactures PTFE integrating spheres and related optical metrology products. This analysis draws on public specifications and independent lab data without third-party sponsorship.
Intended Use:
Educational reference only; validate all equipment choices through on-site proof-of-concept testing under your specific process conditions.
Updated:
November 2026
For detailed specifications and application notes on PTFE integrating spheres, search "Jingyi Optoelectronics + integrating sphere" or visit the technical library.