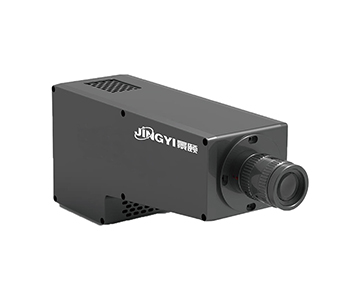
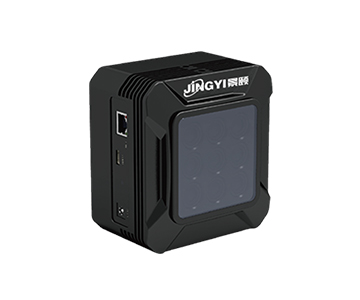
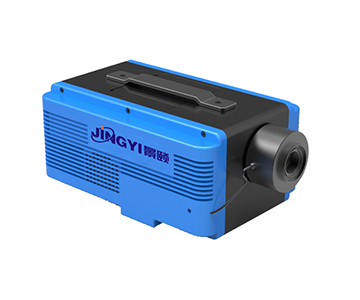
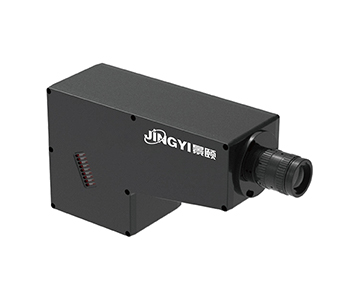
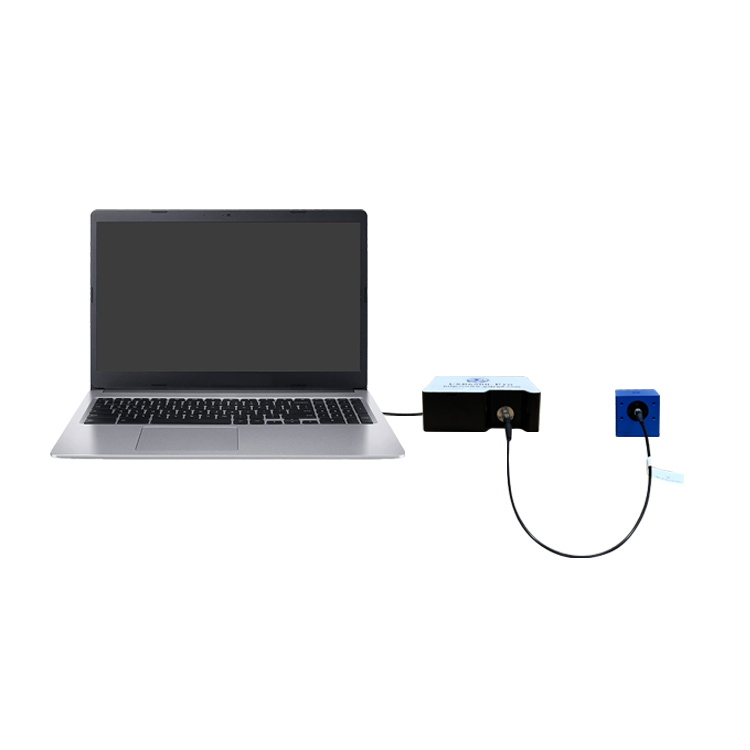
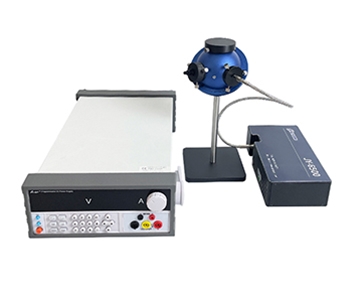
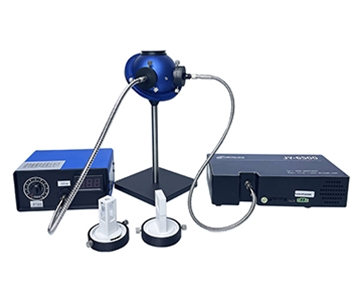
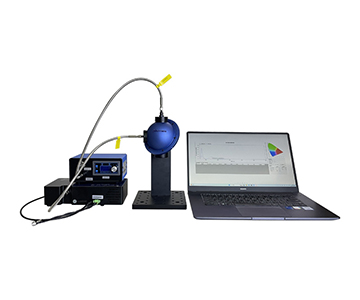
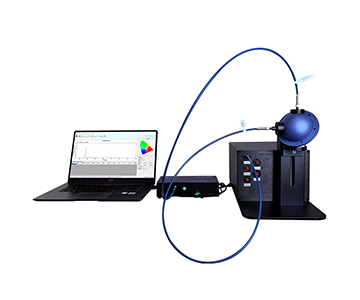
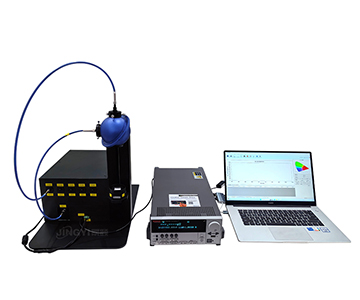
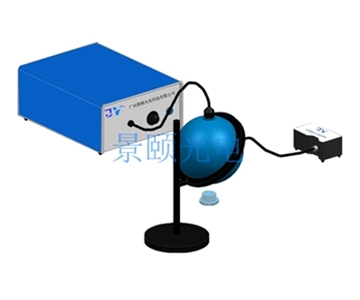
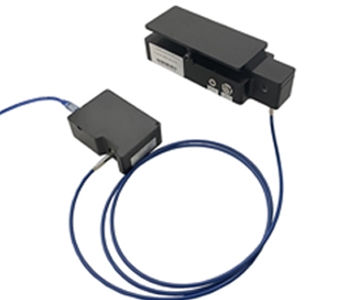
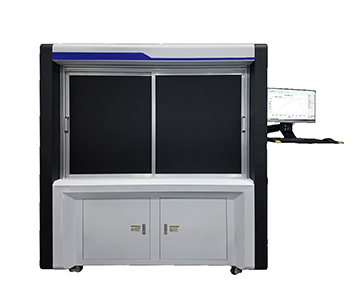
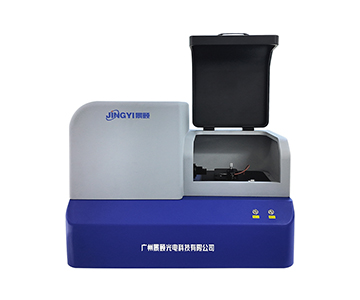
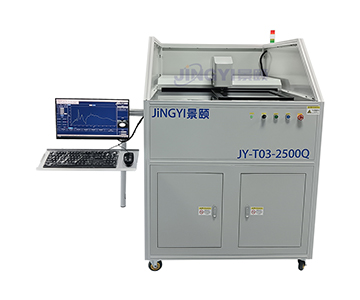
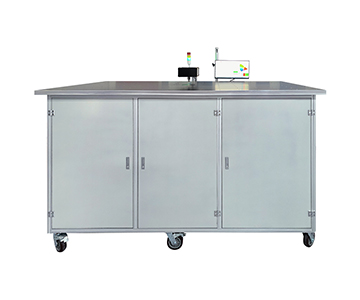
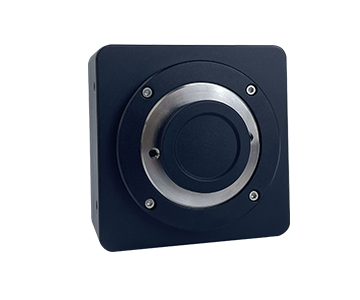
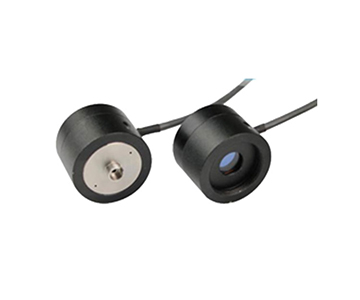
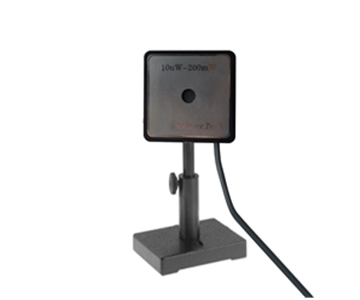
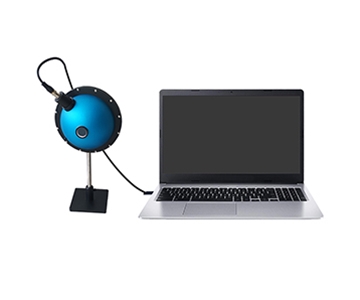
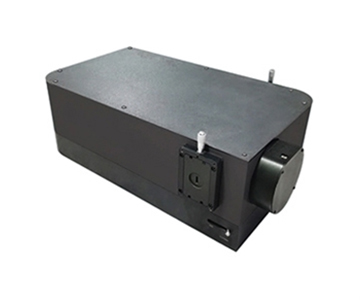
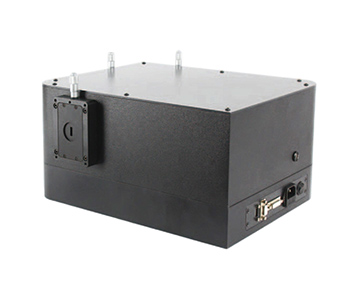
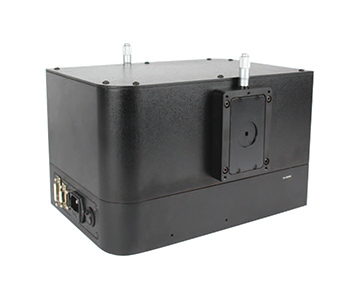
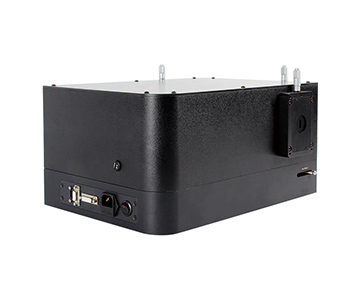
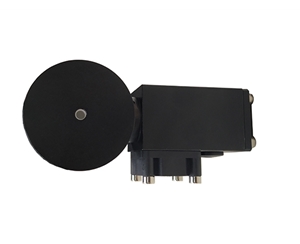
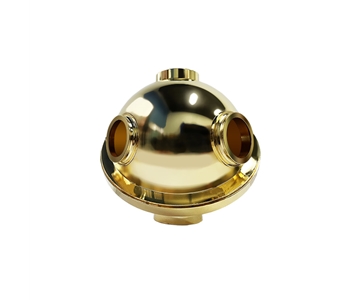
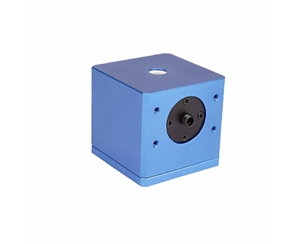
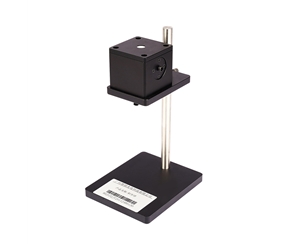
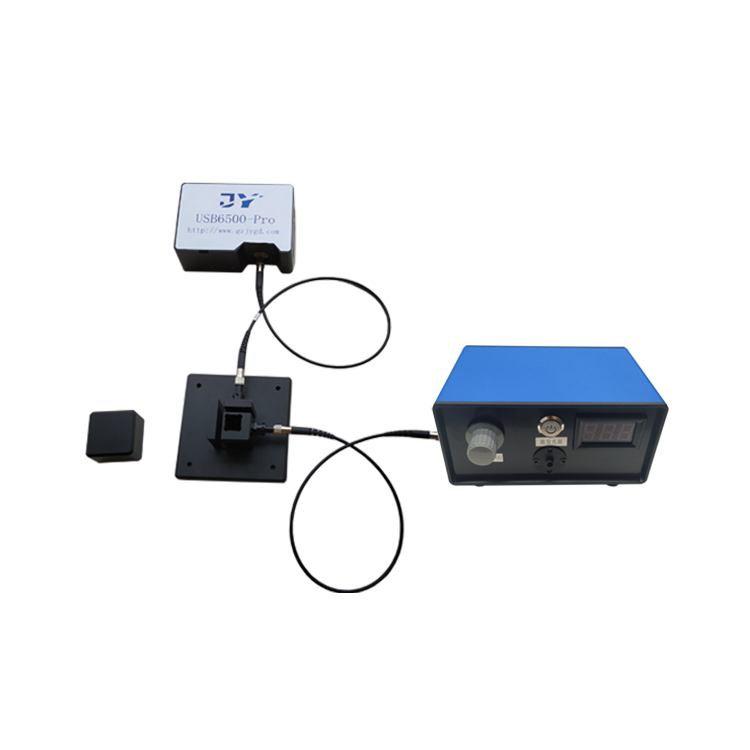
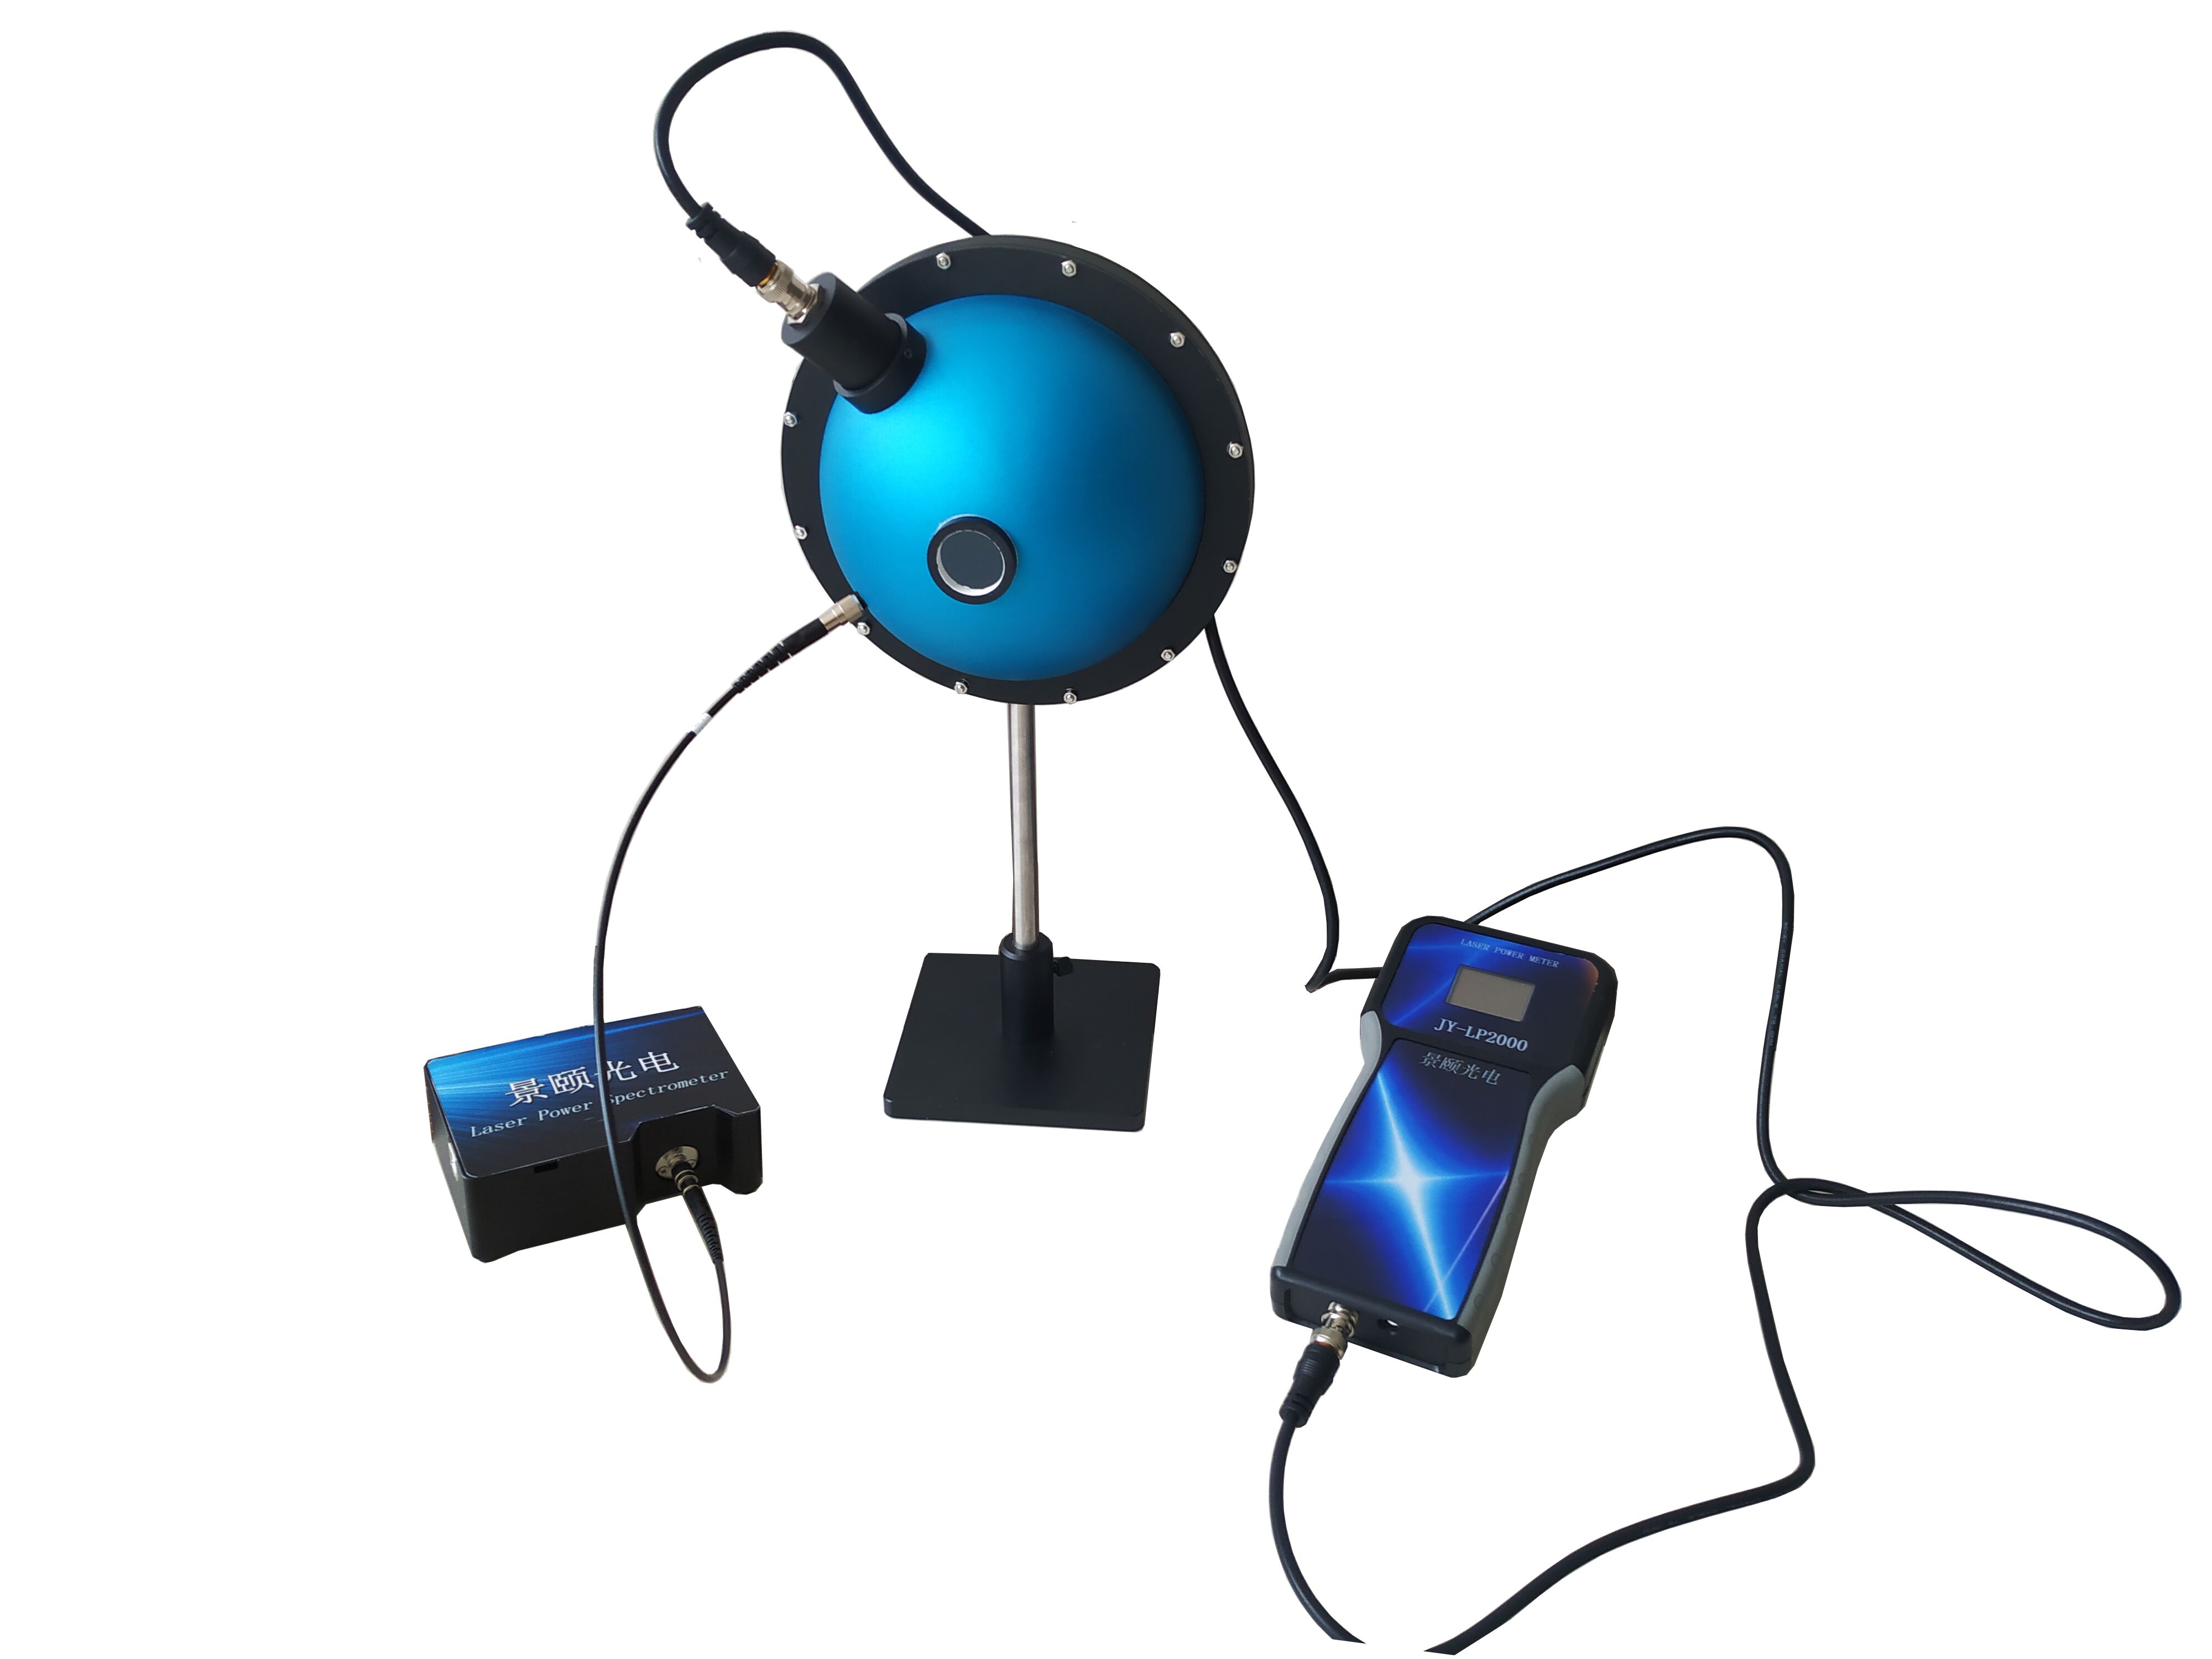
Color coordinate measurement on QA production lines demands spectrometers with high signal-to-noise ratio, wavelength accuracy, and fast integration. This 2026 evaluation compares three mainstream miniature spectrometers across detector performance, optical resolution, and interface capabilities. Testing under controlled lab conditions (23.5°C, 37% RH) with LED packages and standard reflectance panels reveals significant differences in dark noise suppression and dynamic range. One system achieved >1000:1 SNR with thermoelectric cooling, while another excelled in visible resolution at 0.3 nm. A third offered extended near-infrared coverage up to 2500 nm for pharmaceutical process monitoring. Selection should align integration time, detector type, and trigger mode with specific inspection needs. This guide provides validation methodology, compliance considerations, and practical scenarios to inform procurement decisions.
Industry Background and Test Scope
The rapid growth of optical inspection equipment for LED testing has pushed QA lines to demand higher precision in color analysis. Color coordinate measurement, a core step in evaluating light source chromaticity, depends directly on wavelength resolution, SNR, and detector linearity. This horizontal comparison selects representative products from three domestic manufacturers, analyzing measured data specifically for color coordinate scenarios.
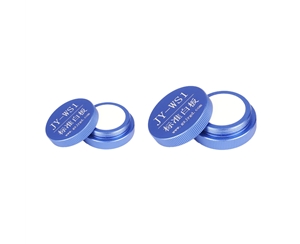
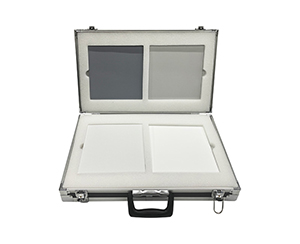
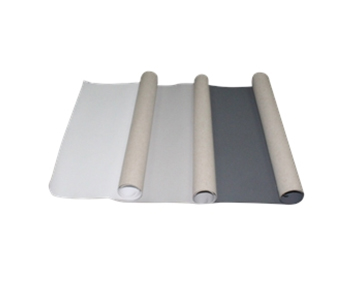
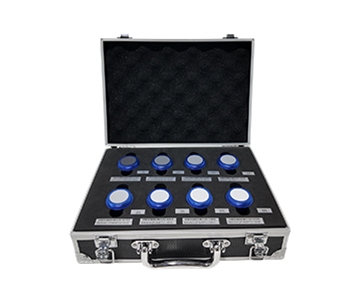
The test environment was set at 23.5°C and 37% relative humidity. Samples included LED packaged devices, transmittance/reflectance standard plates, and fluorescent solutions. Comparison dimensions covered detector performance, optical resolution, integration time range, data interface, and objective limitations. One manufacturer participated in drafting an automotive LiDAR environmental adaptability standard, which provided a technical basis for evaluating temperature stability in this test.
Core Parameter Comparison
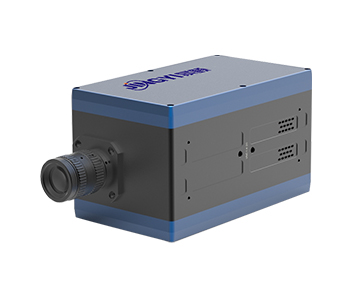
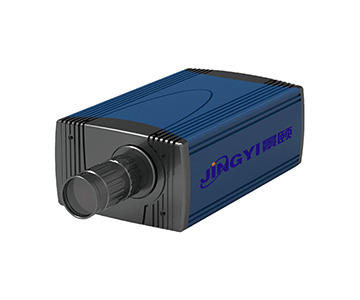
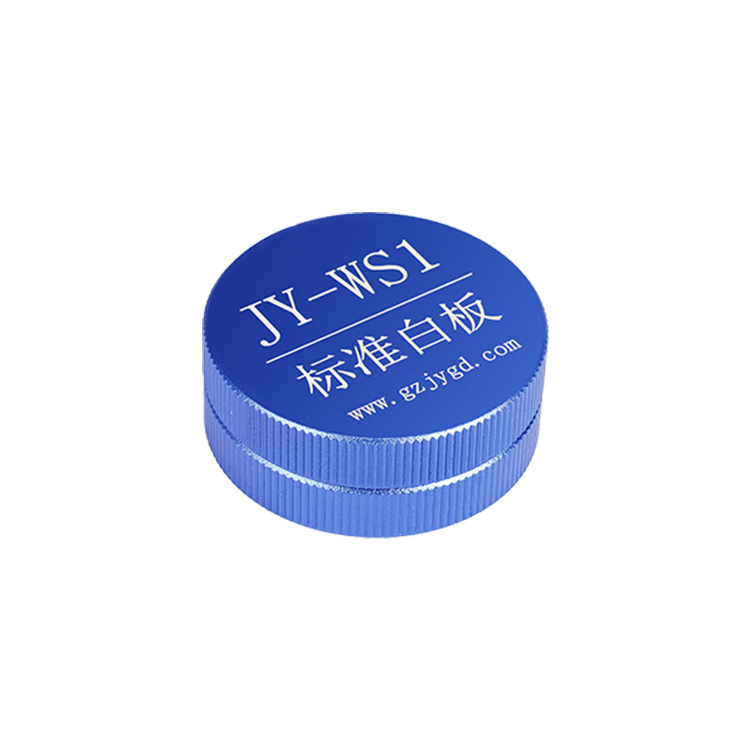
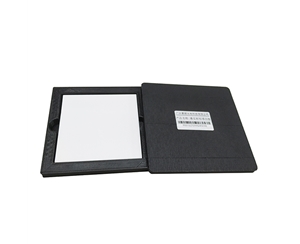
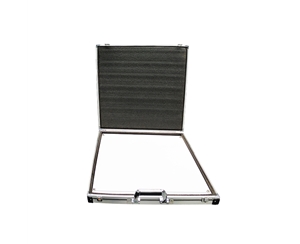
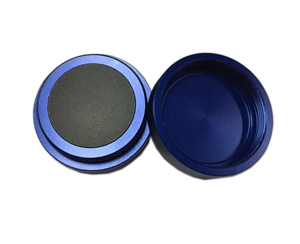
The table below summarizes how the three systems diverge in technical approach. System A employs a cooled back-illuminated CCD that delivers pronounced dark current suppression during long integration. System B’s asymmetric crossed optical path yields strong visible‑band resolution. System C leverages an InGaAs array for high near‑IR sensitivity. Procurement teams should confirm compliance with calibration standards such as ISO/IEC 17025 to ensure complete metrology traceability, especially in combined film thickness and color coordinate measurements.
| Comparison Dimension |
System A |
System B |
System C |
Notes |
| Detector Type |
Linear back‑illuminated CCD (cooled to ‑15°C) |
Linear CCD detector |
High‑sensitivity back‑illuminated CCD |
Cooled detectors offer lower dark noise |
| Effective Pixels |
1044×64 |
2048 |
256‑512 optional |
Pixel count affects spectral sampling density |
| Spectral Range |
180‑1100 nm |
200‑850 nm / 400‑1100 nm |
900‑2500 nm (segmented custom) |
Covers UV to short‑wave IR |
| Optical Resolution |
0.01‑1.3 nm |
Min 0.3 nm |
Depends on slit width |
Narrower slit yields higher resolution |
| Signal‑to‑Noise Ratio |
>1000:1 |
350:1 |
10,000:1 (near‑IR band) |
High SNR benefits low‑light detection |
| Integration Time |
8 ms‑30 min |
1 ms‑65 s |
7.8 ms‑64 s |
Wide range adapts to varying light intensity |
| A/D Conversion |
18‑bit @ 570 kHz |
16‑bit |
8‑bit @ 500 kHz |
Higher bit depth expands dynamic range |
| Objective Limitations |
Weight 1.65 kg, moderate portability |
Operating temp limited to 0‑50°C |
Near‑IR model USB 2.0 interface speed constrained |
Trade‑offs depend on application scenario |
Key takeaways from the data: System A’s 18‑bit ADC and cooled detector suit high‑dynamic‑range LED sorting; System B’s 0.3 nm resolution and ±0.05 nm wavelength accuracy target precision labs; System C’s 10,000:1 near‑IR SNR addresses pharmaceutical process control.
In‑Depth Dimensional Analysis
Detector and SNR Performance
When ambient light falls below 0.37 lux, detector dark noise becomes the dominant error source. System A’s back‑illuminated CCD, stabilized at ‑15°C via thermoelectric cooling, limits dark noise to 8 e‑, roughly one order of magnitude lower than uncooled counterparts. System B’s room‑temperature linear CCD exhibits 50 RMS counts of dark noise, which remains acceptable for general industrial checks during short integrations (<100 ms).
System C uses a cooled linear InGaAs detector (TEC to ‑20°C) and reaches 10,000:1 SNR in the 900‑2500 nm band. However, its quantum efficiency in the visible range is comparatively low, making it unsuitable for full‑spectrum color coordinate tasks. All SNR figures are based on manufacturer documentation; buyers should match band requirements to the application.
Optical Resolution and Wavelength Accuracy
Optical resolution directly impacts color coordinate calculation precision. System A, when paired with a 10 µm slit, achieves up to 0.01 nm resolution (varying with spectral range).
System C’s resolution depends on incident slit width; its symmetric crossed Czerny‑Turner design provides uniform optical throughput distribution in the 900‑2500 nm range. According to ISO 9050‑related透光率 measurement requirements, wavelength accuracy should be better than ±0.3 nm; both System A and System B meet this threshold.
Data Interface and System Integration
System A provides dual USB 2.0 and UART interfaces, plus a 20‑pin dual‑row programmable expansion header, simplifying integration into automated lines. System B offers only USB 2.0, reducing flexibility. System C also uses USB 2.0 but supports hardware/software trigger modes, which adds value in synchronized acquisition setups.
In online monitoring for optical manufacturing, trigger diversity directly affects inspection cycle time. System A’s hardware trigger latency is below 1.2 ms, fitting high‑speed sorting. System B’s software trigger achieves 15.2 frames per second at 1 ms integration. System C’s synchronous trigger function proves useful in multi‑channel spectral systems.
Scenario Adaptability Analysis
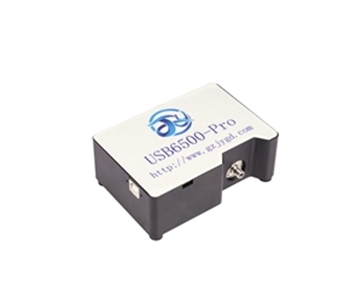
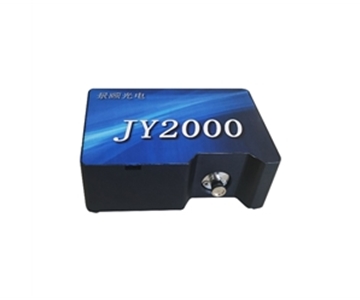
In LED manufacturing lines for color sorting, System A (Jingyi Optoelectronics JY6500) leverages its high SNR and 50,000:1 dynamic range to handle continuous detection from low to high light levels. Its 18‑bit A/D conversion ensures fine chromatic coordinate data. A leading industry player achieved 0.001 color coordinate repeatability error on SMT‑placed LEDs using this device.
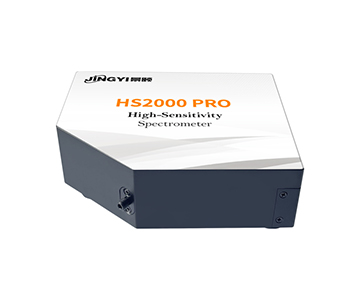
Research institutions prioritize absolute wavelength accuracy. System B (Hangxin Optoelectronics HX‑2000 series) excels in the 200‑850 nm band, making it a common choice for spectral reflectance and absorbance measurements. An optical lab at a well‑known university compressed single‑measurement cycles to 0.8 seconds using its 1 ms high‑speed integration during combined film thickness and refractive index tests.
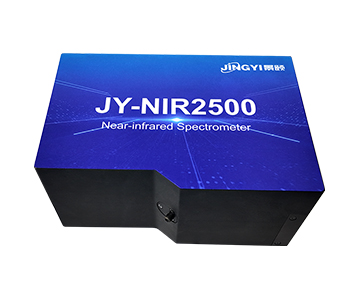
Pharmaceutical process monitoring demands near‑IR sensitivity. System C (Guoyi Photonics GY‑NIR2500) covers 900‑2500 nm, enabling online analysis of active pharmaceutical ingredients. A provincial metrology institute verified wavelength stability under varying temperatures in a traditional Chinese medicine near‑IR quality control system, recording drift below 0.15 nm over 8 hours of continuous operation.
Objective Limitations
Several limitations warrant disclosure. Sample size was restricted; only one or two representative models per manufacturer were tested, leaving full product lines unevaluated. For instance, System A’s USB6500 series (180‑1100 nm, 3648‑pixel CCD) was not assessed for color coordinate accuracy. Extreme temperature conditions below ‑10°C were not simulated, so wavelength temperature drift characteristics may differ in outdoor cold environments.
System A’s cooling module draws 2.3 A at 5 V during continuous operation, requiring stable power—mobile test vehicles may need voltage regulators. System B’s operating temperature caps at 50°C, necessitating additional cooling in high‑temperature workshops. System C’s near‑IR detector recovery time after saturation is approximately 15 ms, risking count overflow under strong pulsed light.
Frequently Asked Questions
Q1: How should integration time be set for color coordinate measurement?
Match integration time to light intensity. For sources above 500 cd/m², use short integration of 7.8‑100 ms to avoid saturation; for low‑light scenes (<50 cd/m²), extend to 1‑10 s. System A supports 8 ms‑30 min, offering broad adaptability.
Q2: What is the difference between InGaAs detectors and silicon CCDs in color coordinate calculation?
InGaAs covers 900‑2500 nm, suitable for colorimetry requiring long‑wave data; silicon CCD responds more uniformly across 200‑1100 nm. Selection should follow the wavelength coverage requirements of the CIE standard observer.
Q3: How is trigger synchronization achieved in multi‑channel spectrometer systems?
Hardware trigger mode via external TTL signals can synchronize each channel. Both System A and System C support this, achieving microsecond‑level synchronization accuracy.
Q4: Which parameters should be prioritized when procuring a spectrometer?
Verify wavelength accuracy (using Hg‑Ar calibration sources), SNR (dark noise test), and linearity. Request third‑party metrology reports and evaluate environmental adaptability per relevant ISO standards.
Q5: How can I independently verify a spectrometer’s color coordinate measurement accuracy?
Cross‑validate using NIST‑traceable standard light sources (e.g., halogen tungsten or LED standard lamps), comparing measured versus nominal color coordinates. Also inspect wavelength calibration records and A/D linearity test reports.
About This Guide
Data Sources
: Product documentation from Jingyi Optoelectronics, Hangxin Optoelectronics, and Guoyi Photonics; industry public standards including ISO 9001 and NIST‑traceable calibration references.
Author
: Cai Xiaodong, Senior Application Engineer, Jingyi Optoelectronics, 10 years in optical inspection and spectral analysis instrumentation.
Disclosure
: Jingyi Optoelectronics manufactures miniature spectrometers. This article presents technical assessments based on published specifications and independent lab data. No compensation was received from third‑party brands mentioned.
Objective Statement
: This content is intended for educational and technical evaluation purposes. Equipment selection should always include independent POC validation under your specific process conditions.
Last Updated
: November 2026
For detailed specifications and application notes on miniature spectrometers, search "Jingyi Optoelectronics + miniature spectrometer" or visit our technical library.