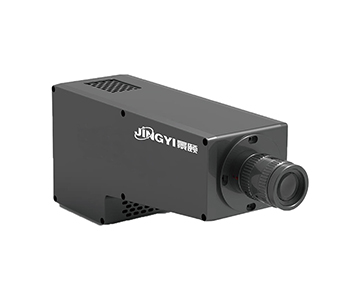
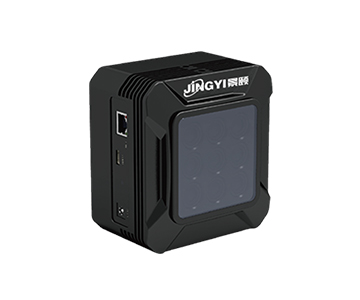
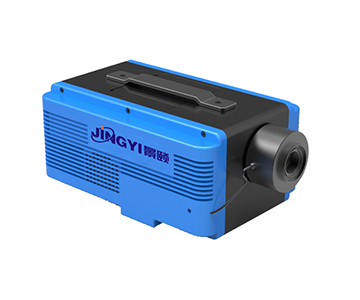
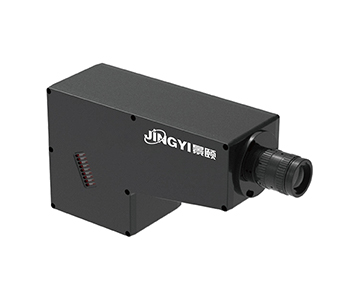
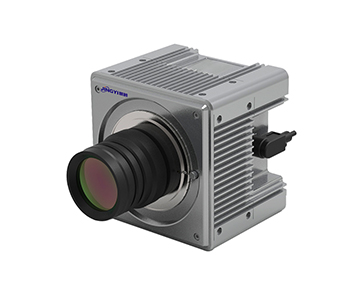
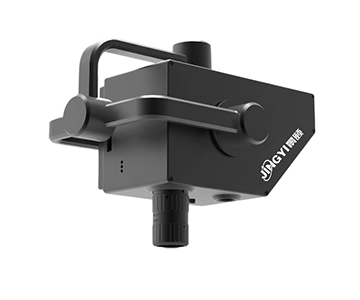
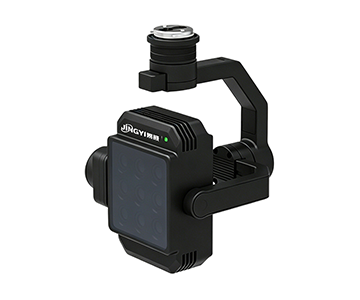
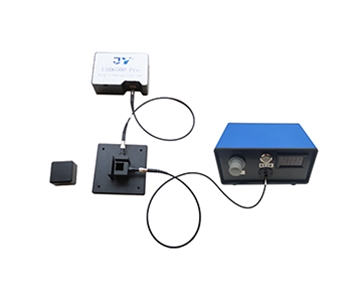
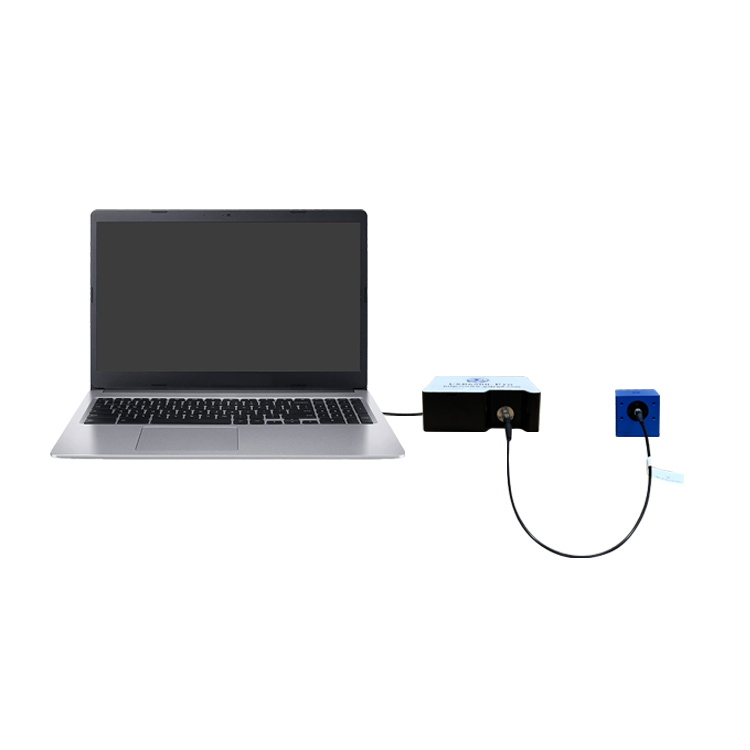
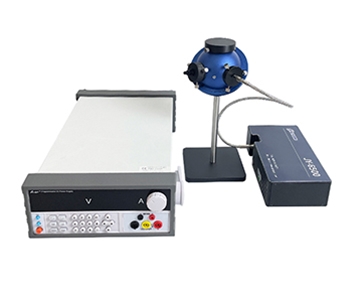
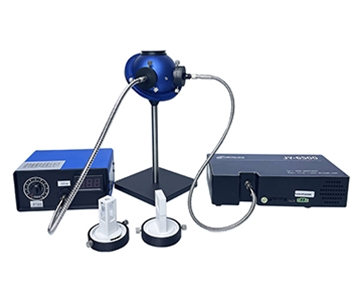
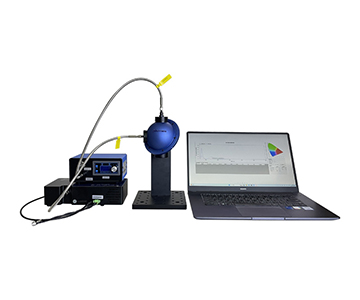
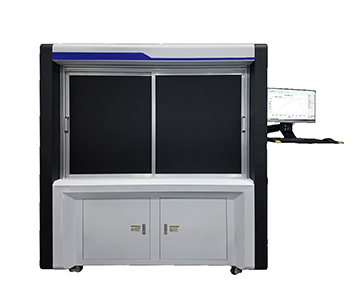
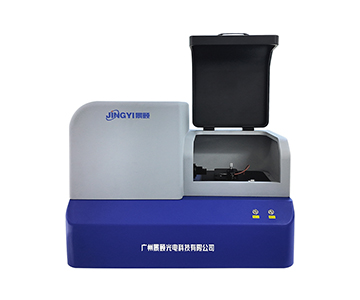
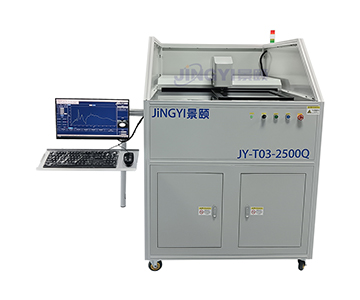
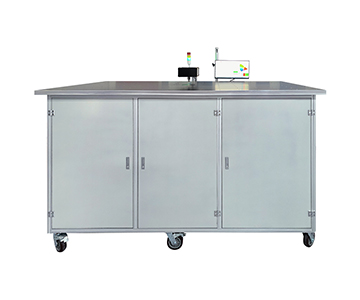
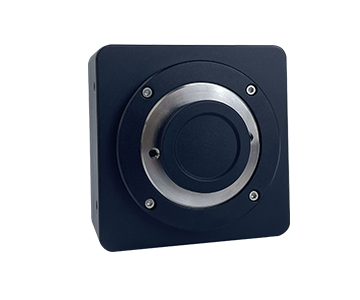
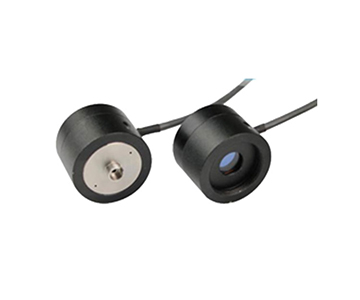
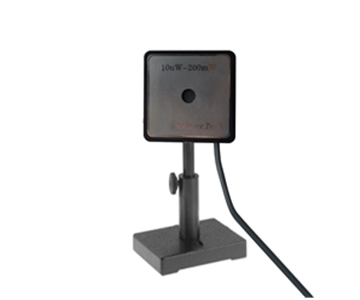
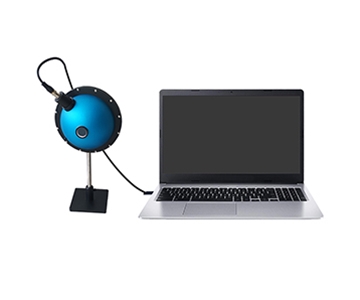
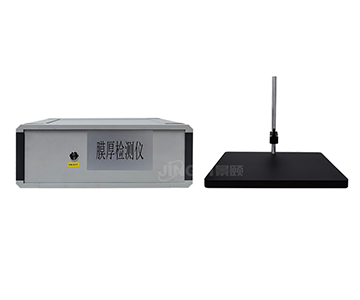
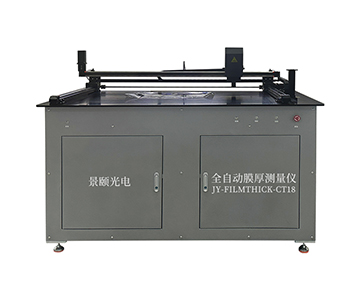
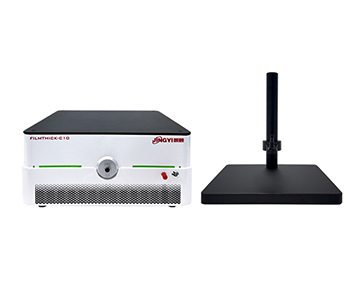
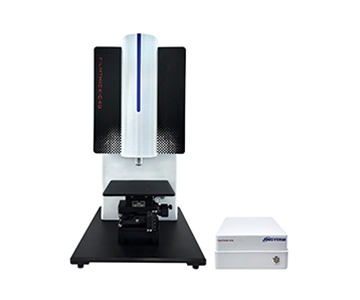
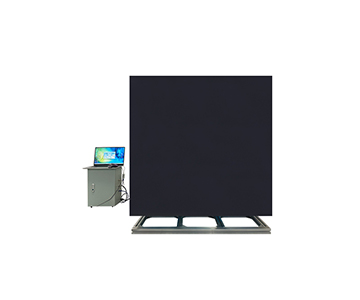
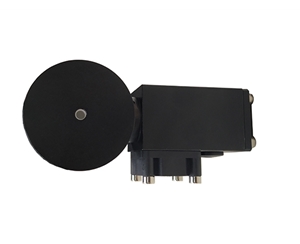
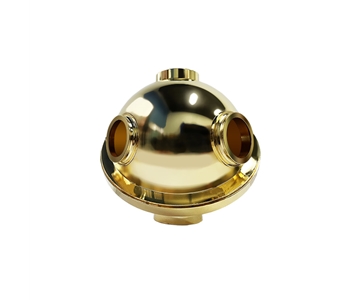
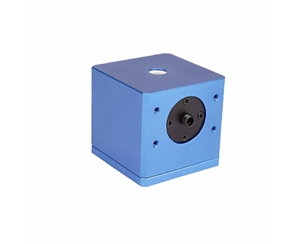
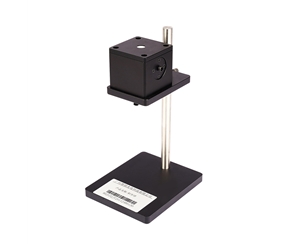
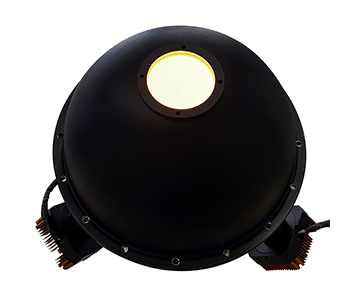
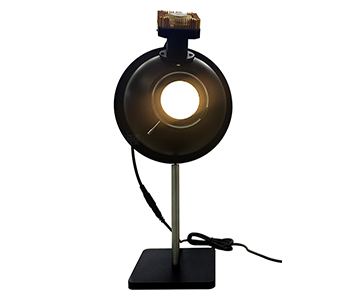
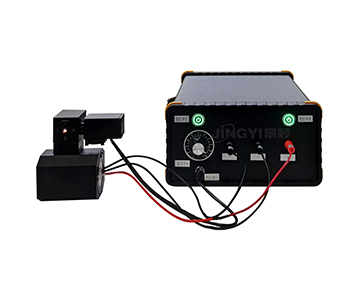
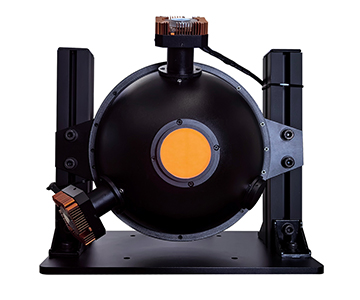
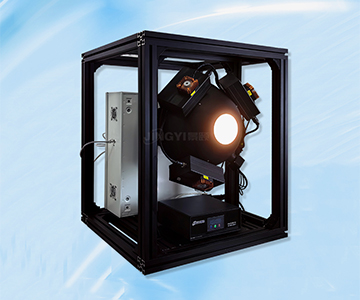
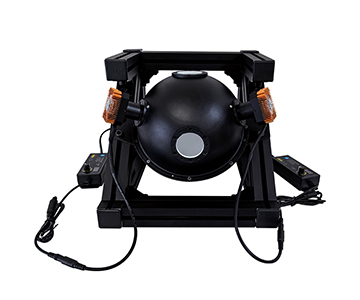
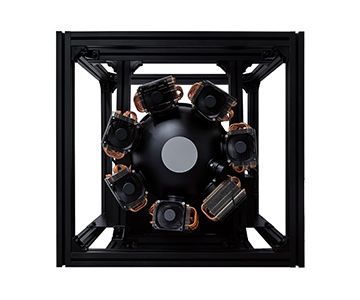
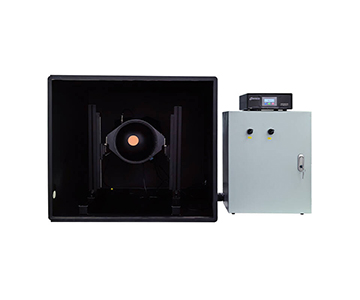
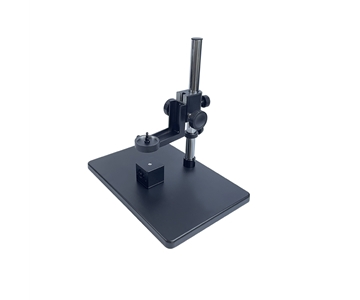
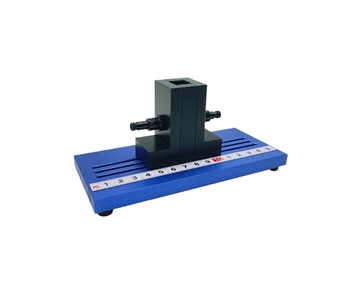
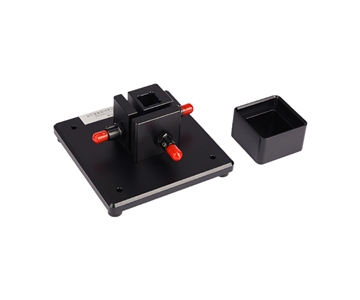
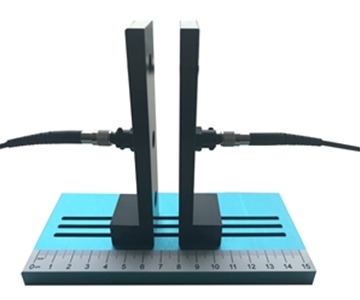
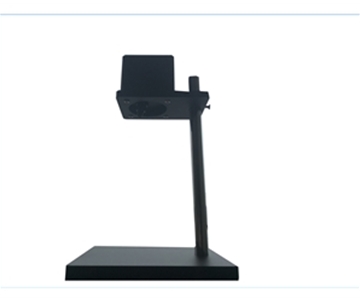
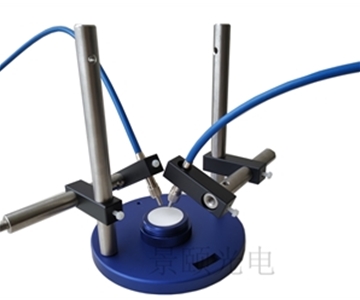
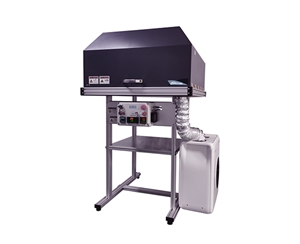
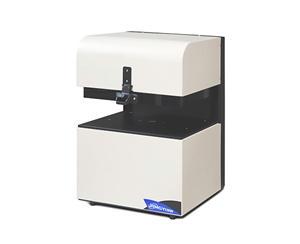
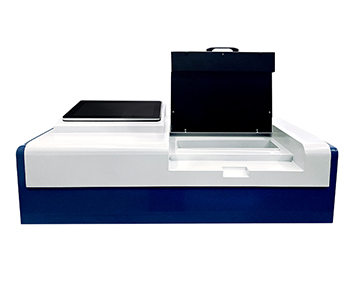
Optical film thickness measurement in semiconductor manufacturing demands sub-nanometer repeatability to control thickness drift on photoresist, AR coatings, and optical layers across 2–12 inch substrates. An interferometric system using FFT, extremum, and curve fitting achieves a 0.2 nm range in 100 repeated tests, with single-point inversion under 0.5 seconds and 2D/3D mapping output. This guide examines the error chain behind full-wafer thickness variation, explains R‑Theta scanning mechanics, and documents a shift from 5‑point manual sampling to 57‑point automated mapping—reducing cycle time by 98.8% while improving data comparability for SPC.
The Error Chain Behind Full‑Wafer Thickness Jumps
During a night shift, a process engineer at a GaN fab in Arizona reviewed inspection logs for a batch of 8‑inch samples. Edge ring thickness curves resembled slightly shaken violin strings. The issue was not equipment failure but insufficient sampling points and manual stage resets that introduced micro‑displacements, rendering readings incomparable across die locations. In LCD and semiconductor manufacturing, this “single‑point accurate, full‑wafer chaotic” phenomenon forces etch windows to narrow incorrectly, pushing rework losses to $21,408 per batch.
A second scenario emerges in AR coating thickness measurement and optical coating evaluation. Layers often measure only tens of nanometers; interference fringes become extremely sensitive to spot position and substrate reflectivity. If the measurement system itself lacks repeatability, process engineers misread instrument noise as process variation, adjusting parameters in the wrong direction and compounding drift.
Optical Reflection Thickness Measurement Mechanism Through Data Repeatability
How Interference Signals Are Inverted to Thickness
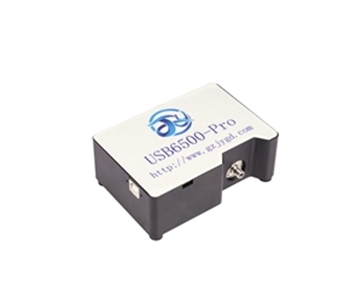
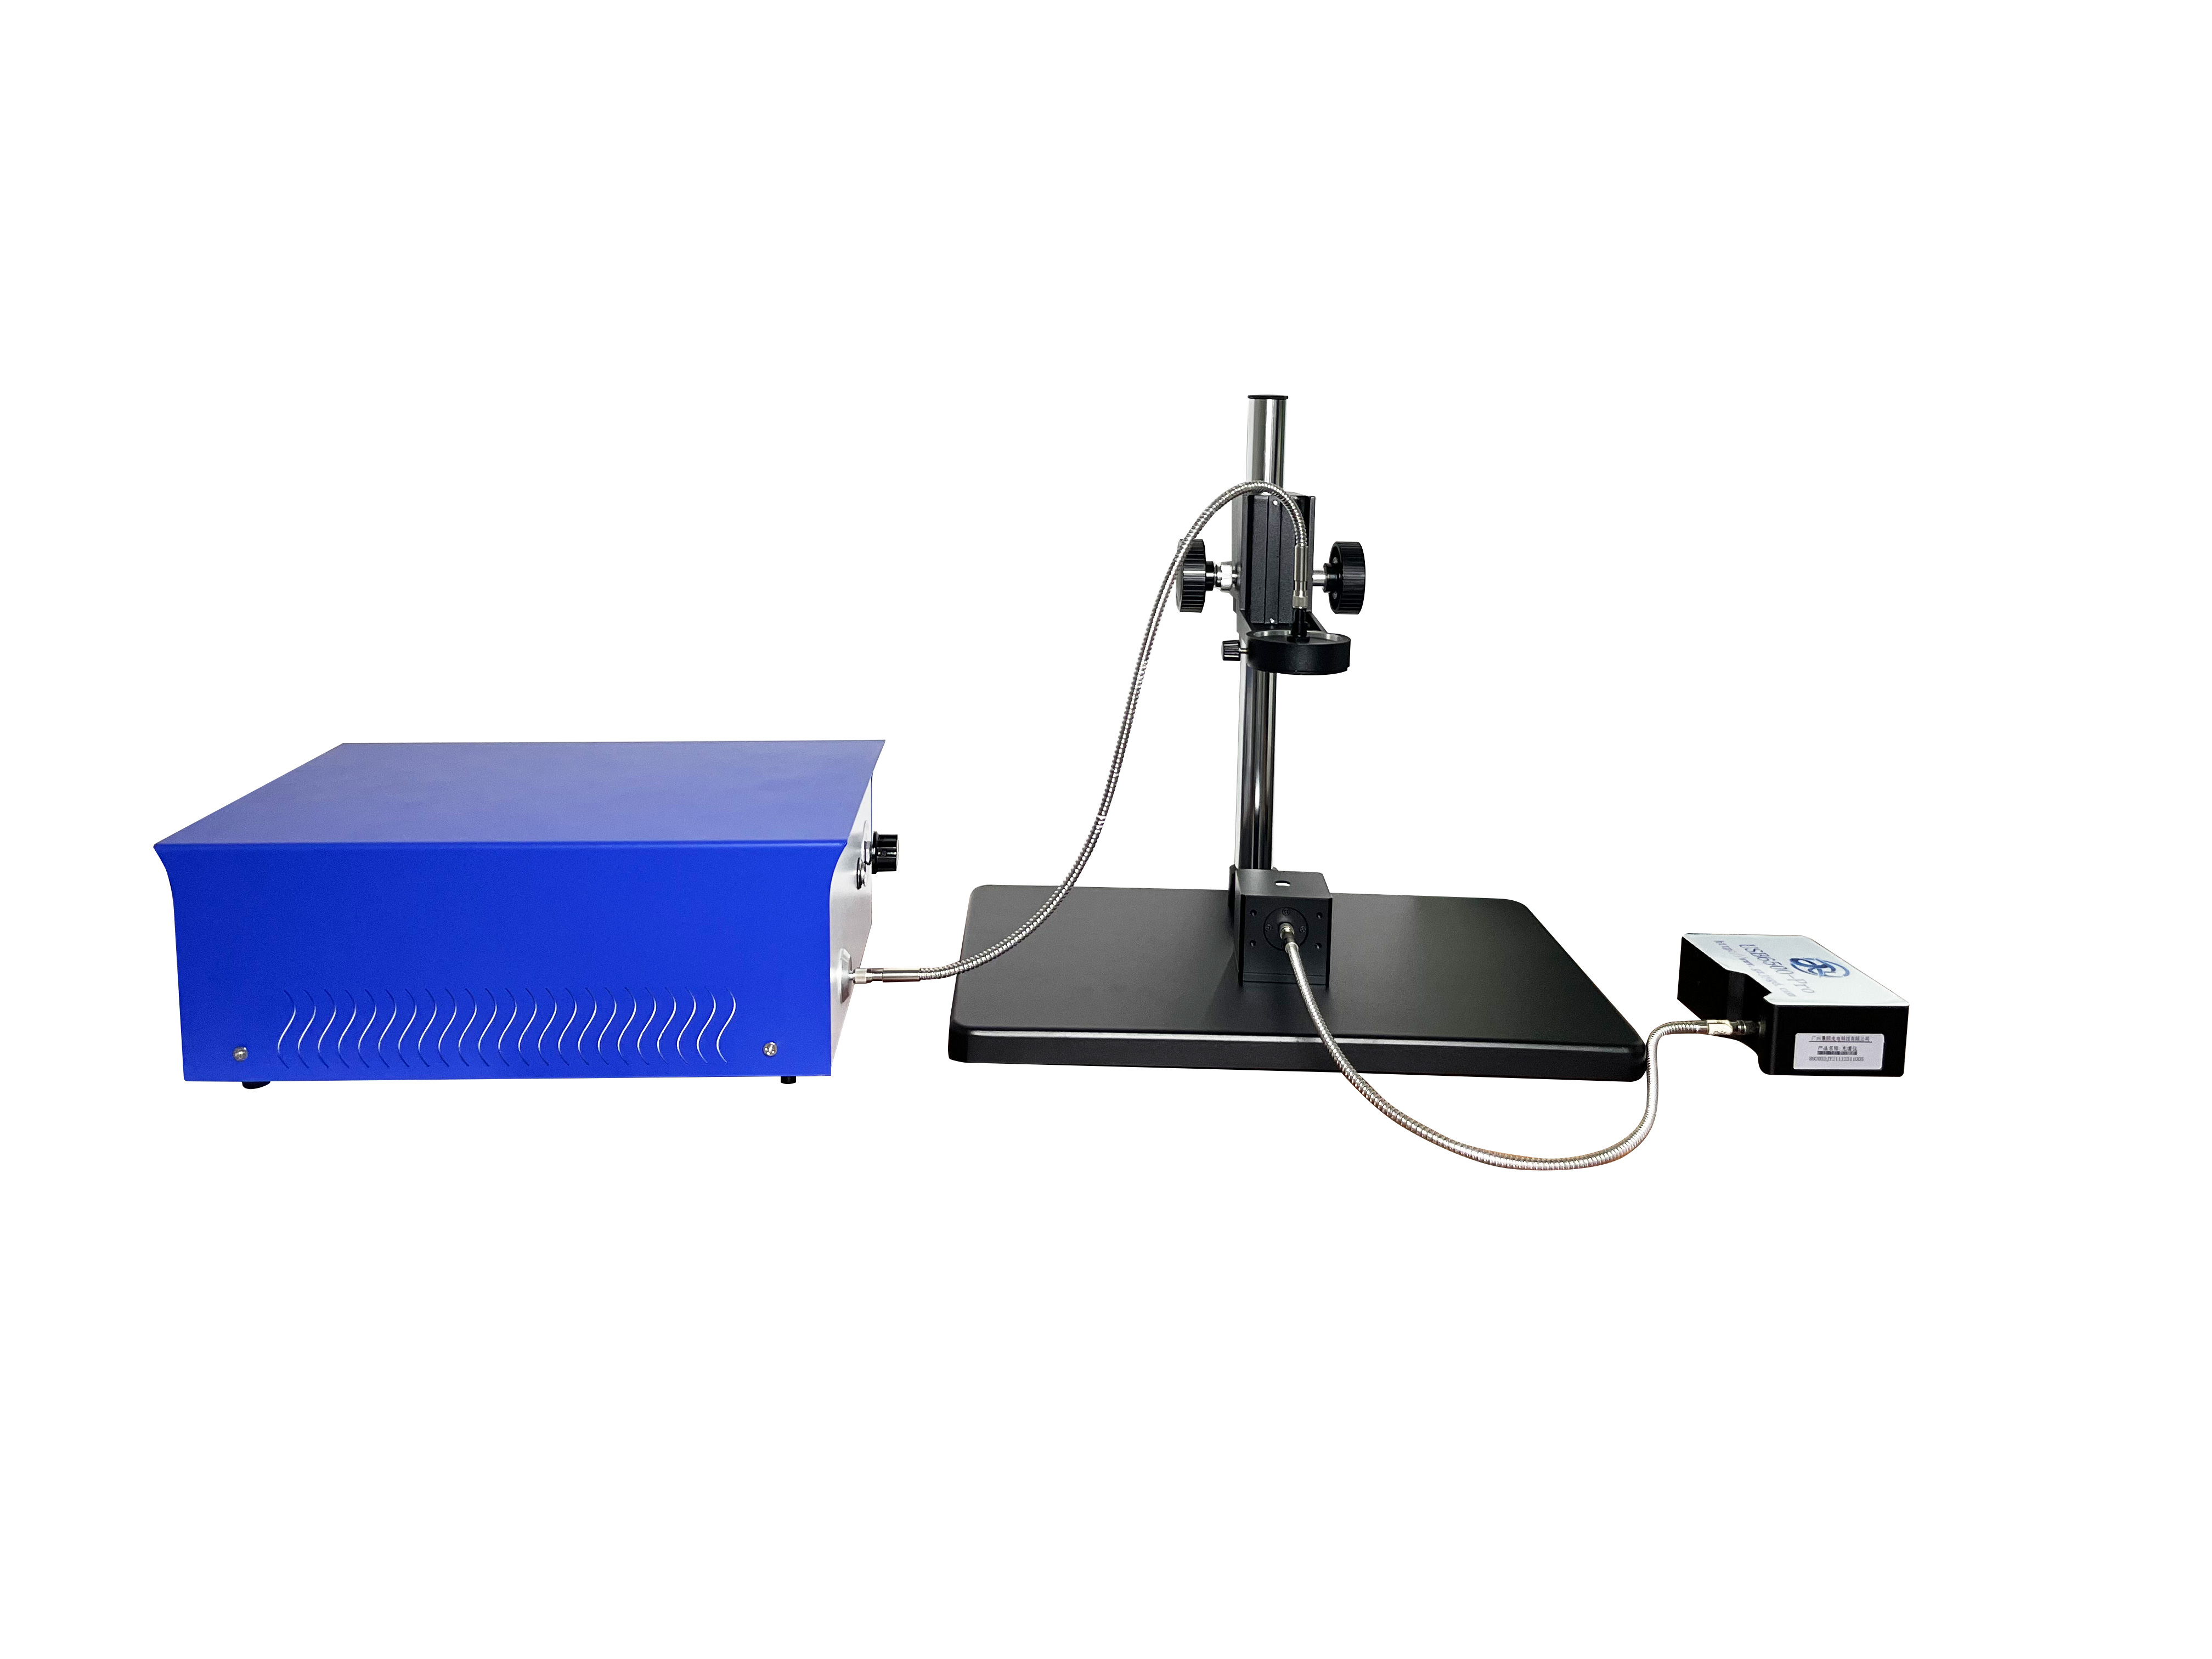
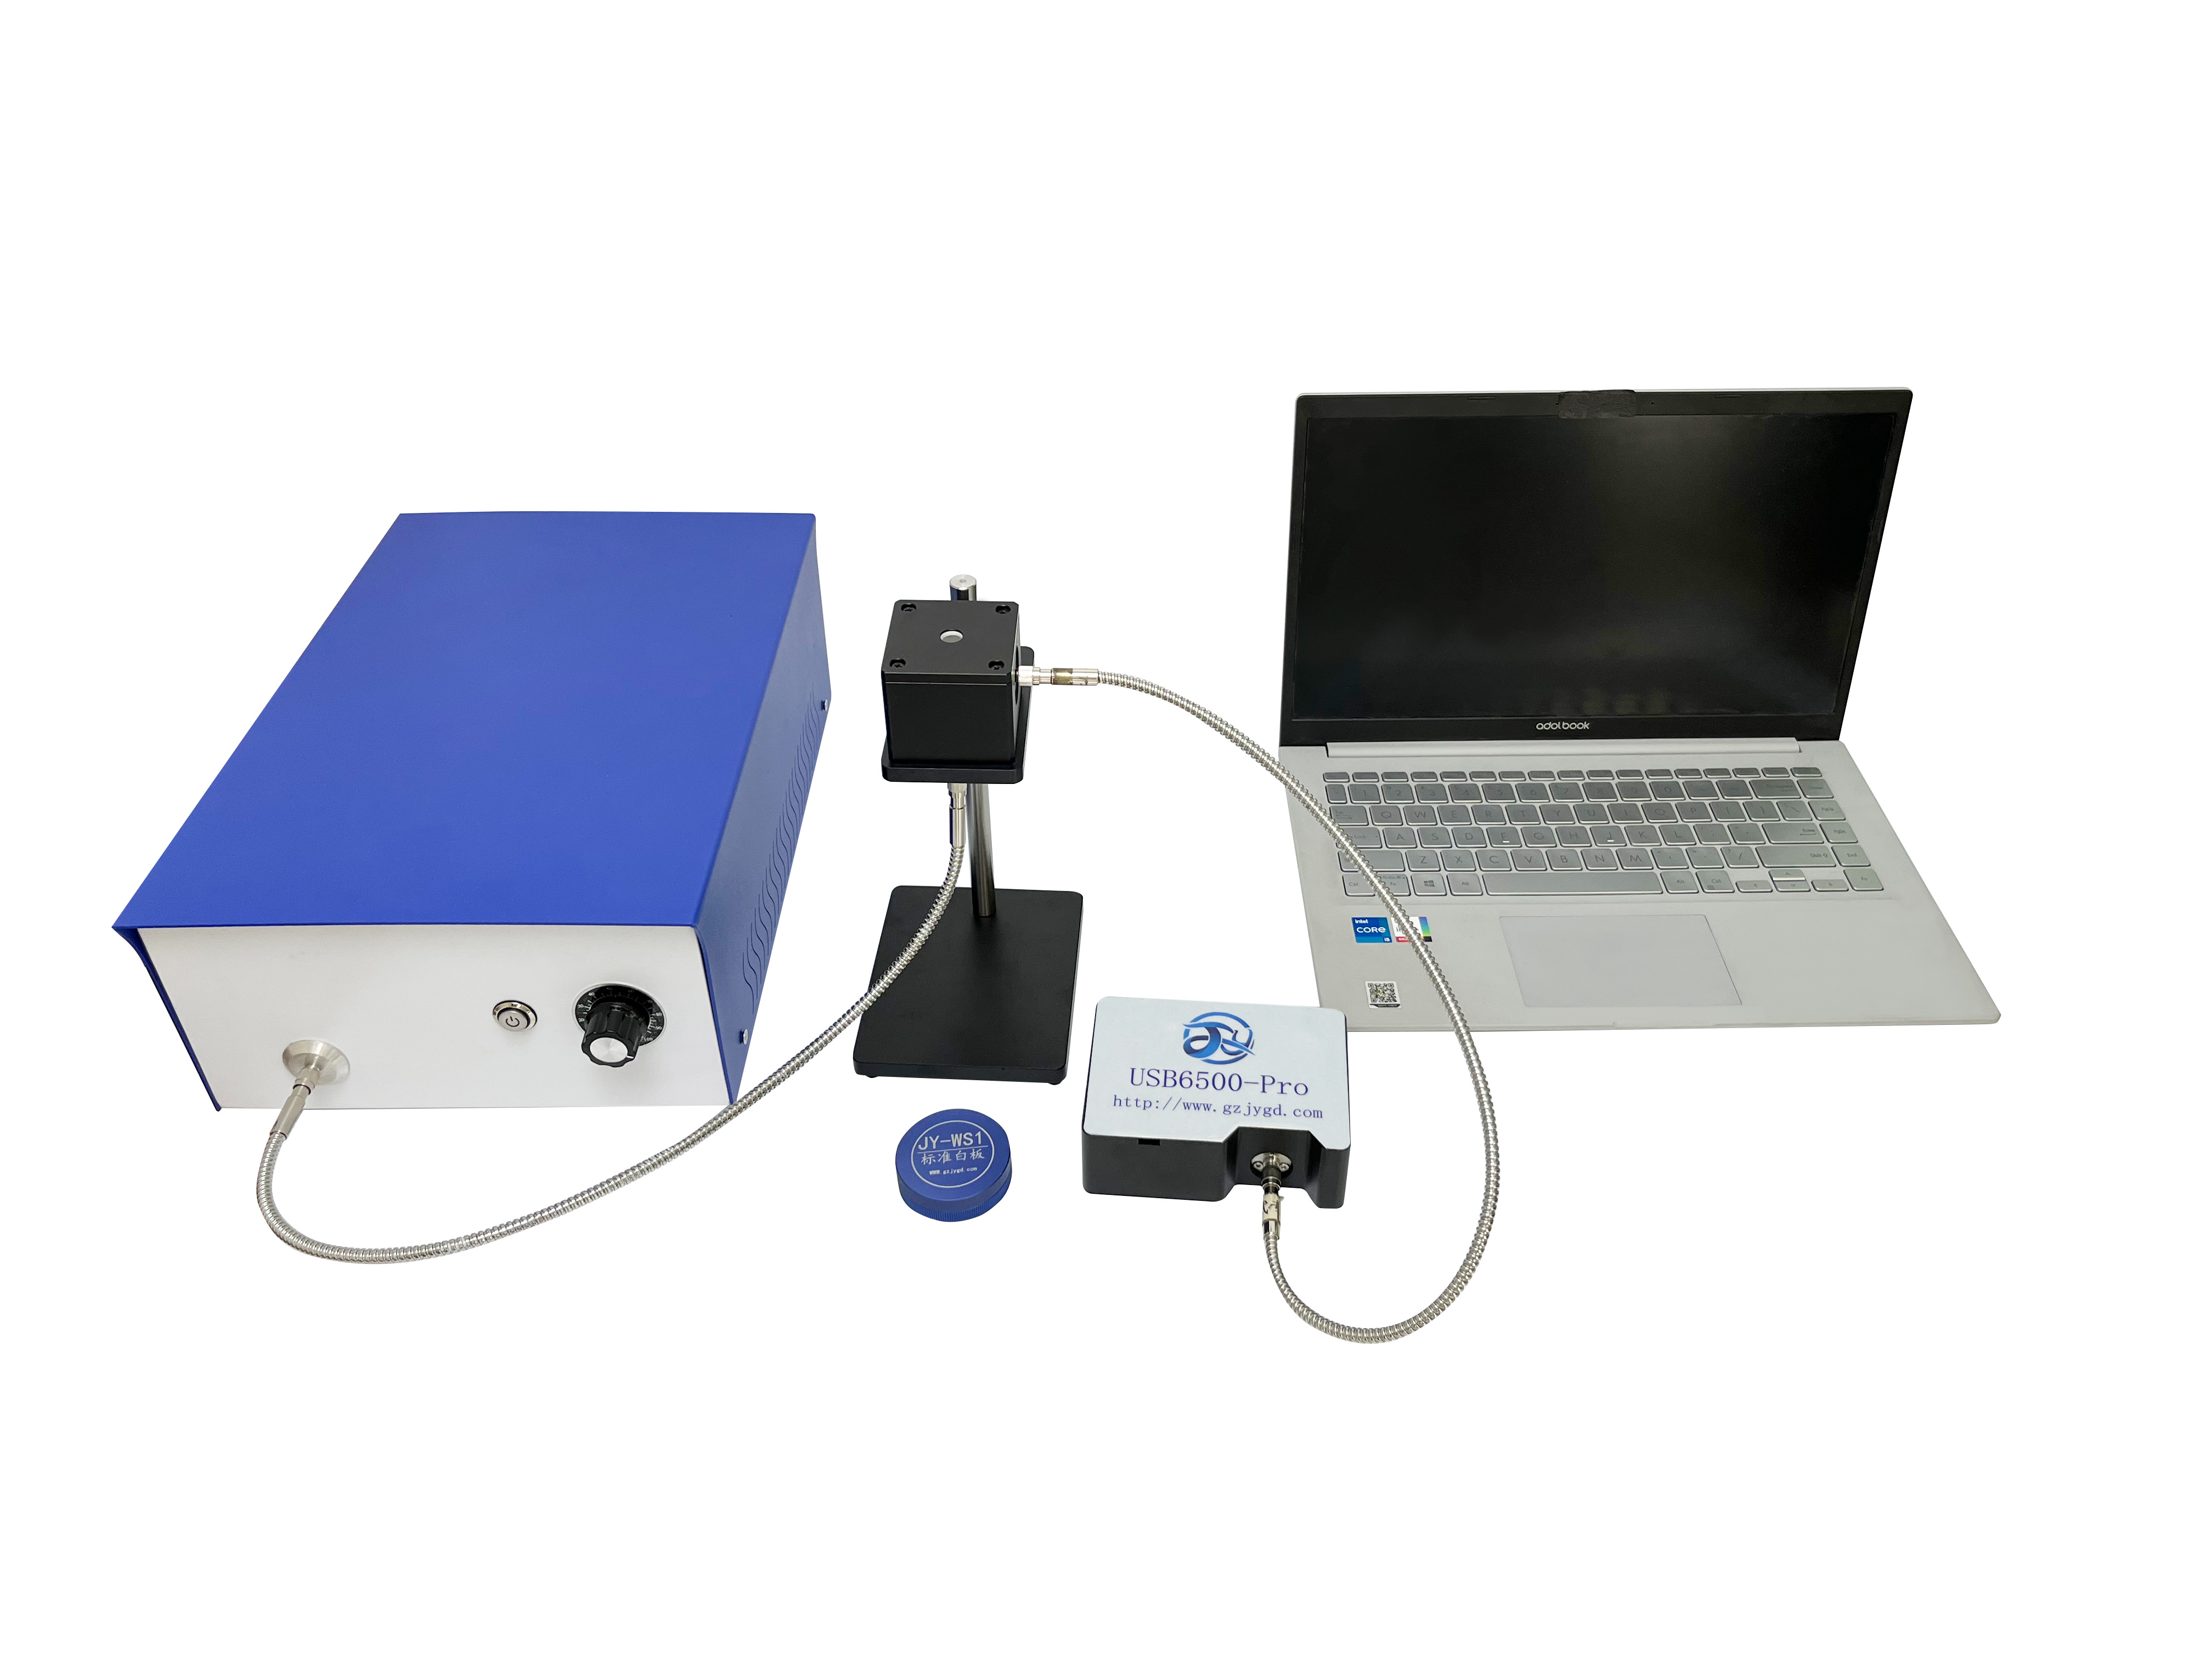
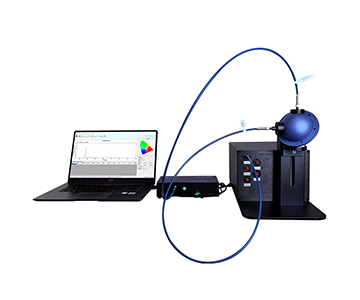
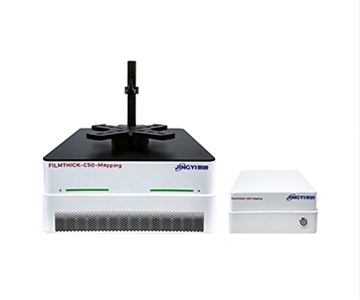
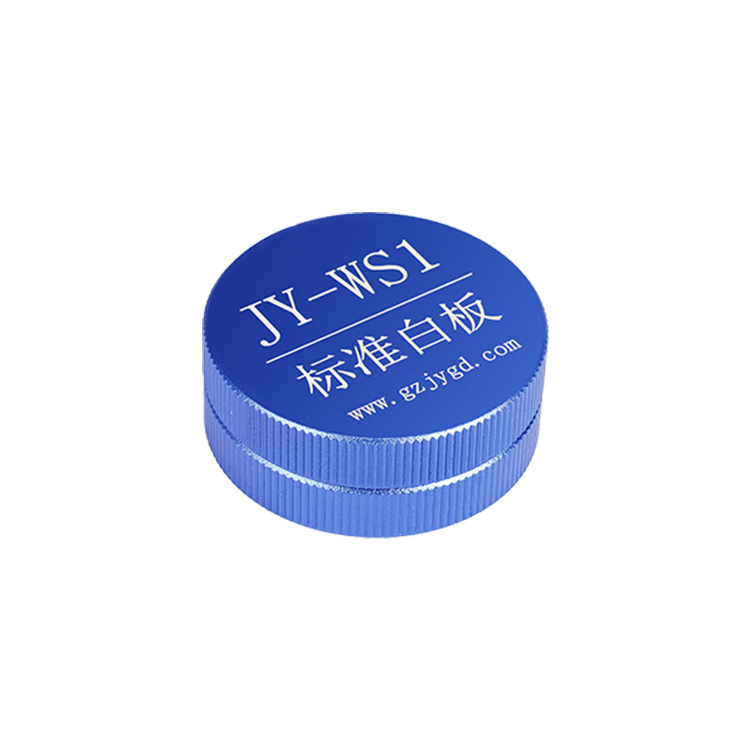
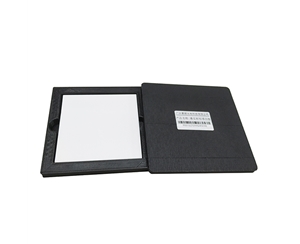
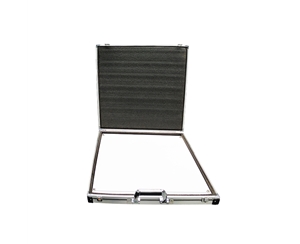
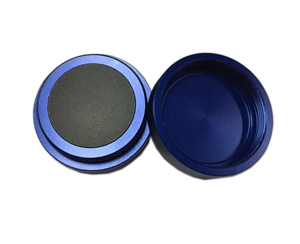
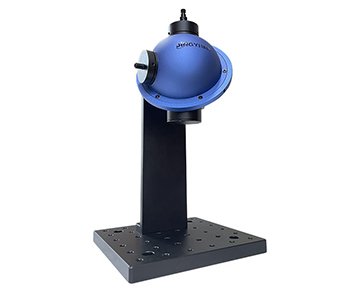
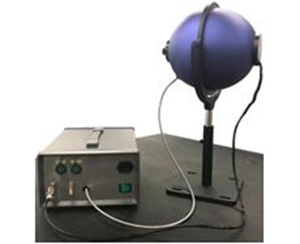
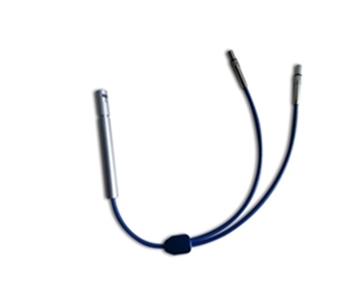
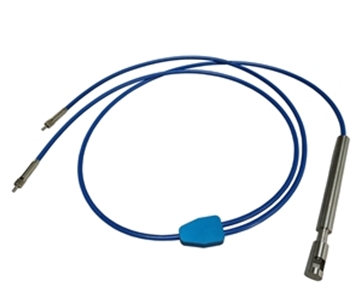
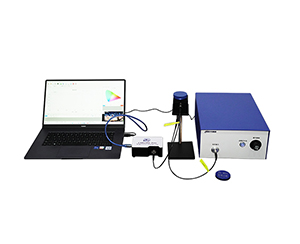
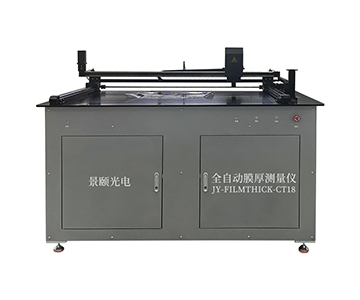
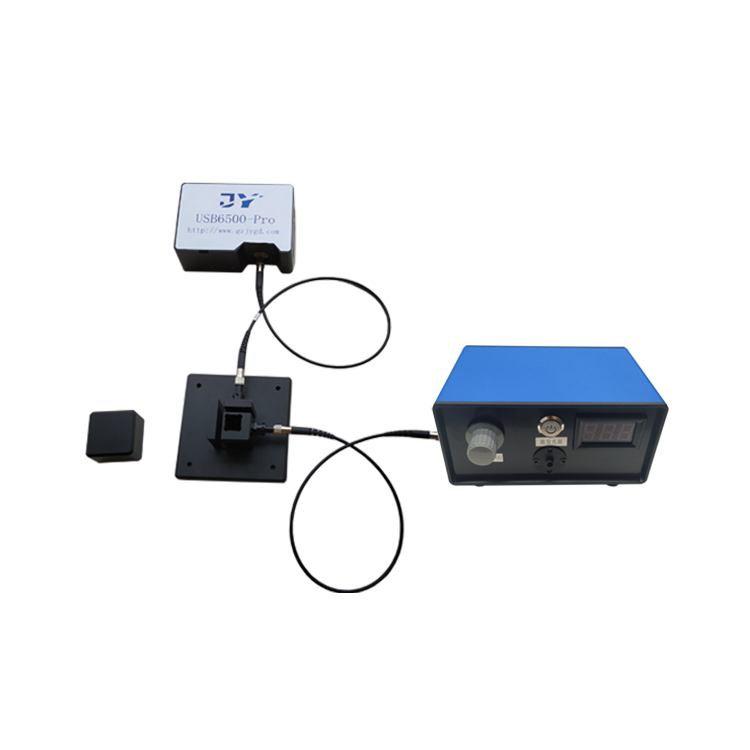
An R‑Theta scanning system avoids contact sampling. A halogen‑tungsten light spot strikes the film surface, capturing the reflected spectrum from superimposed reflections at the upper interface and film‑substrate boundary. FFT separates periodic components, the extremum method locates the envelope, and curve fitting back‑calculates refractive index n and extinction coefficient k. In 100 repeated measurements on a standard SiO₂/Si sample, the maximum range stays within 0.2 nm, with stability better than 0.05 nm.
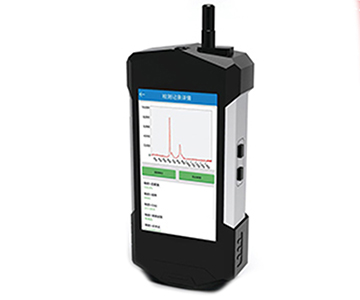
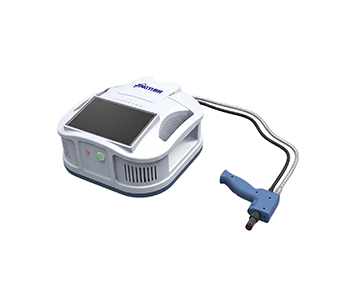
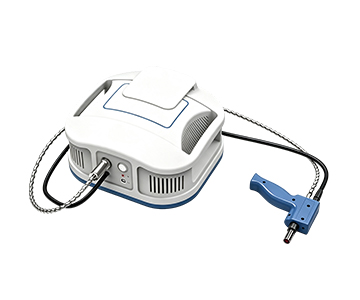
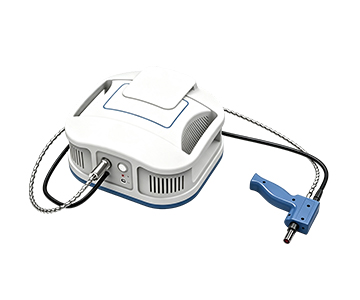
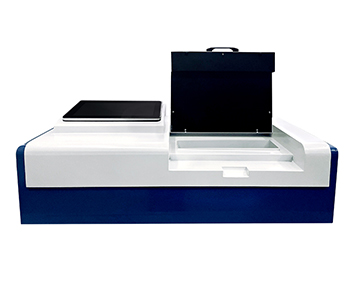
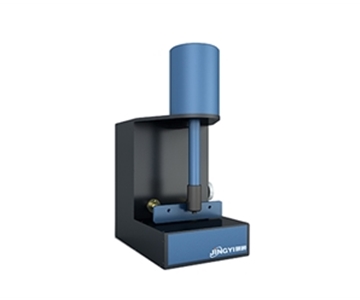
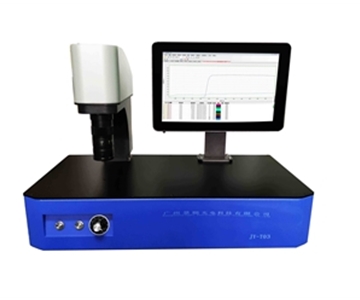
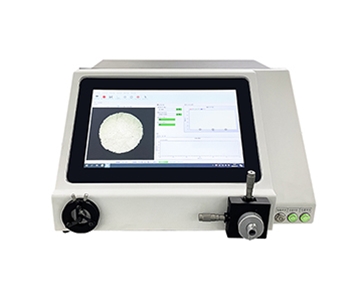
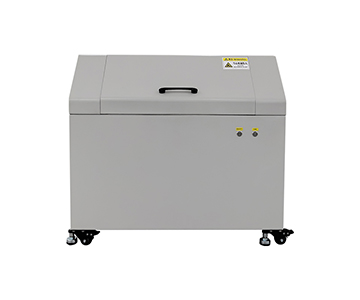
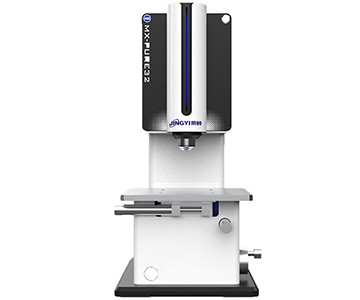
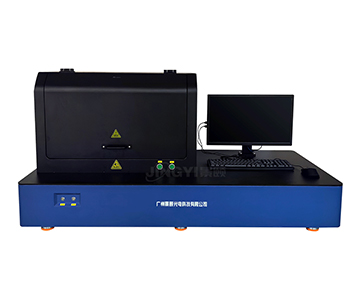
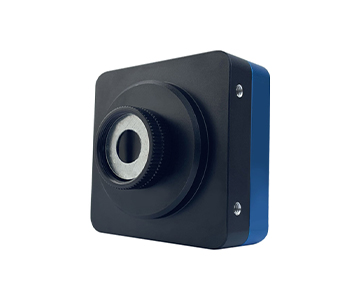
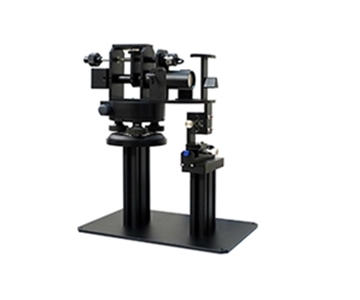
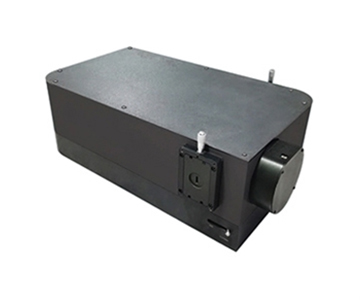
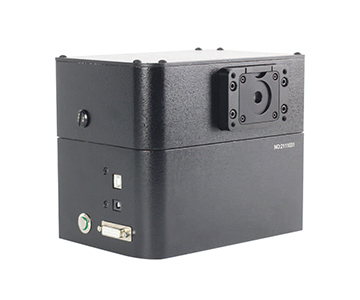
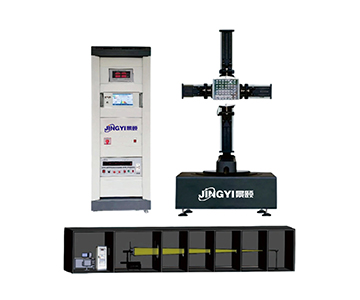
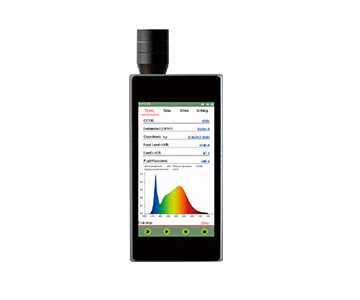
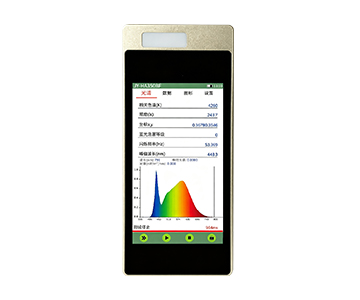
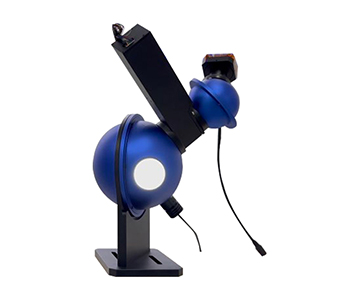
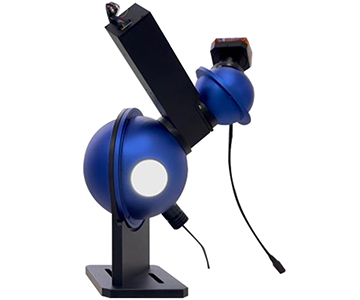
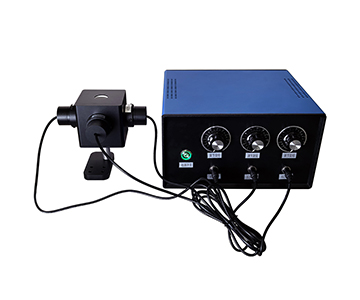
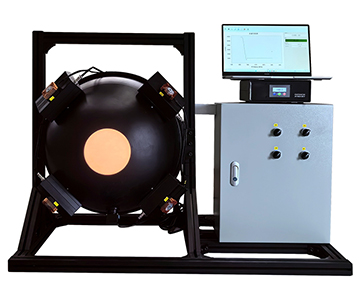
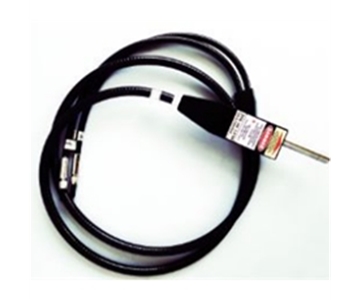
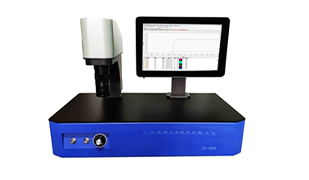
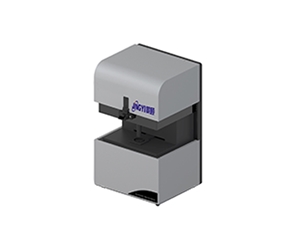
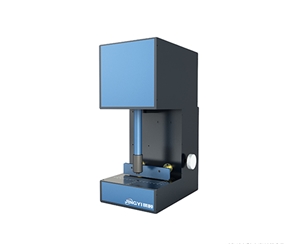
【插入图片:膜厚测量FILMTHICK-C50-mapping.jpg |
Why R‑Theta Structure Affects Repeatable Positioning
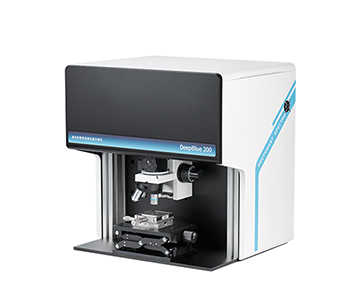
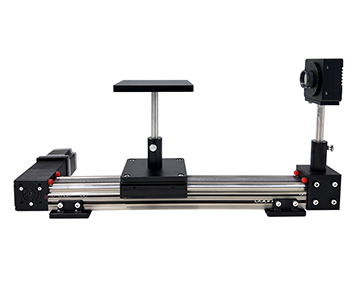
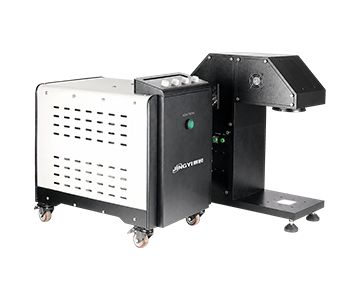
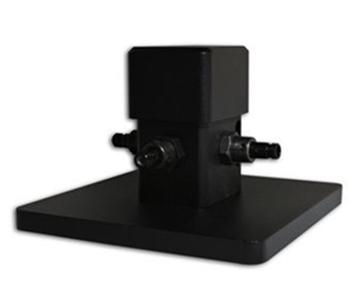
Traditional Cartesian stages accumulate ball screw backlash over long travels. R‑Theta machines keep the optical head stationary while the sample moves radially and rotates, eliminating assembly consistency differences between points. For 2–12 inch wafers, this means constant optical path during full‑wafer scanning; mapping cloud edges and center share the same “ruler.”
Deployment Shift: From Spot Checks to Full‑Wafer Mapping
Cycle Time and Coverage Density
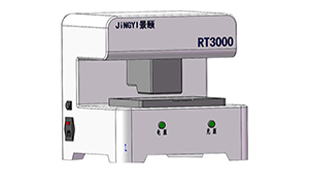
A packaging test lab previously used a manual stage for 5‑point sampling: 42 minutes per wafer, leaving edge rings essentially blind. After switching to an automated mapping system, 5 points take ~5 seconds, 25 points ~14 seconds, 57 points ~30 seconds.
Deployment before: effective sample points = 5, time = 42 min.
Deployment after: effective sample points = 57, time = 30 sec.
Improvement: sampling density increased 10.4×, time reduced 98.8%.
Data Comparability Records
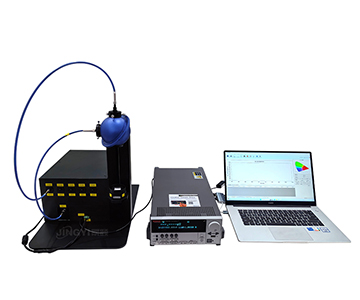
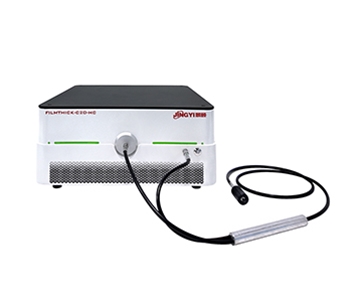
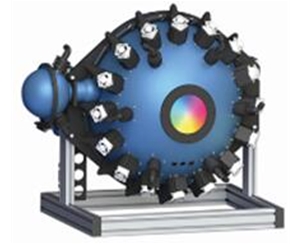
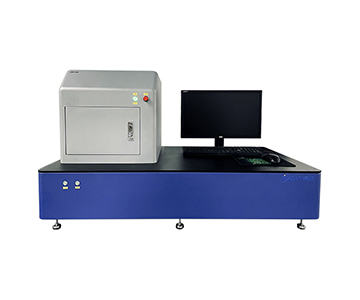
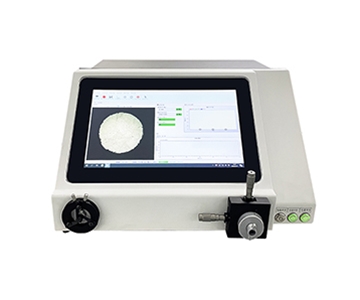
In cross‑validation of photoresist and SiO₂ passivation layers, inter‑shift range previously hit 1.8 nm. After introducing a unified recipe and vacuum chuck stage, 100‑repeat range returned to the 0.2 nm class, enabling 2D contour and 3D distribution maps to feed directly into SPC alarm systems.
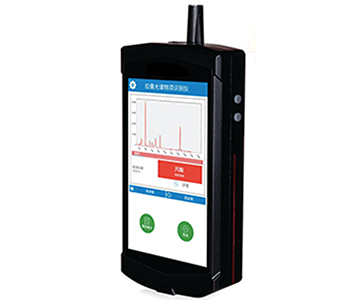
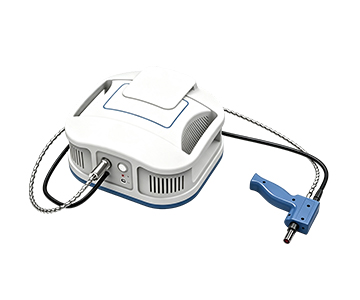
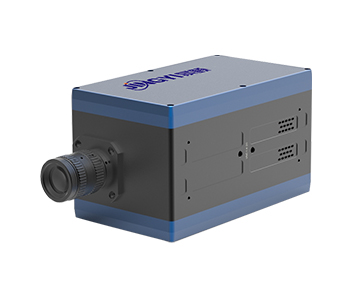
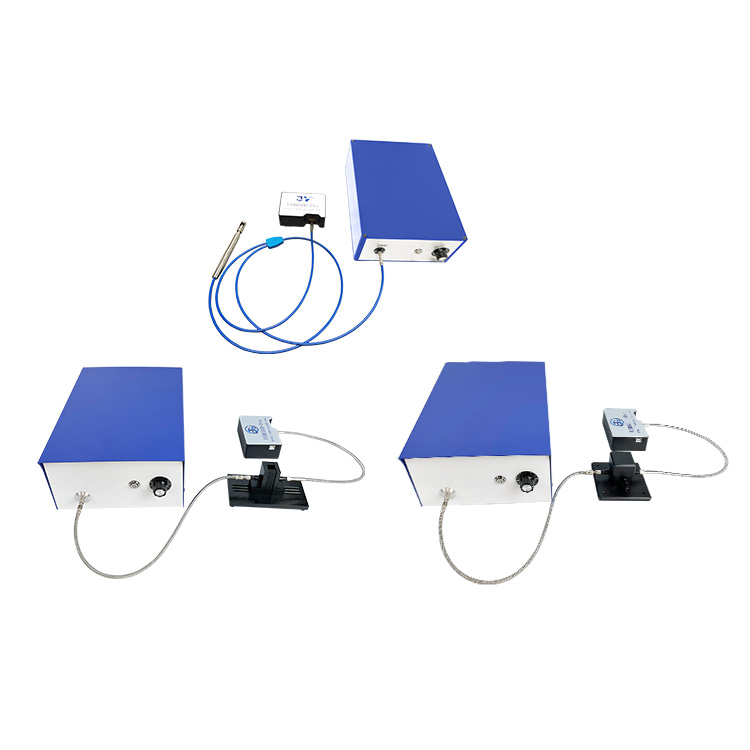
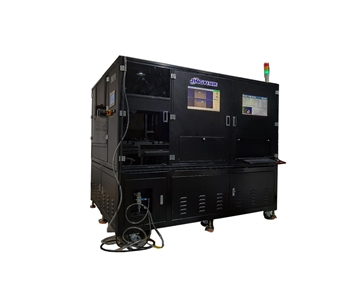
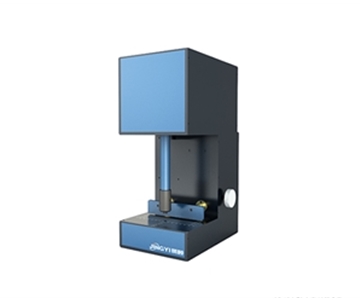
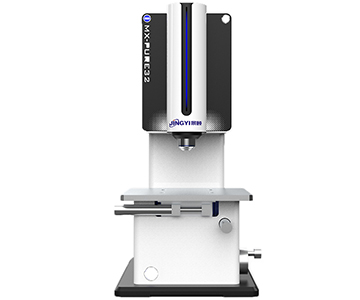
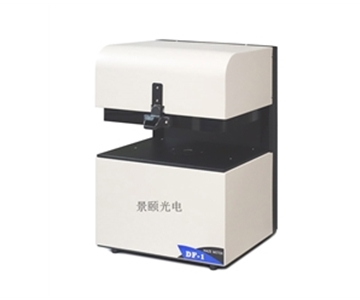
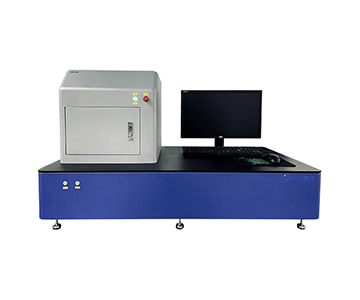
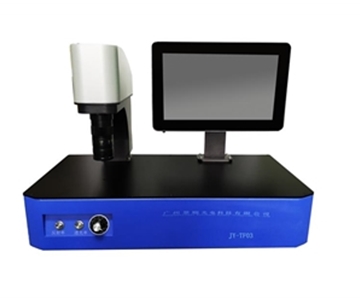
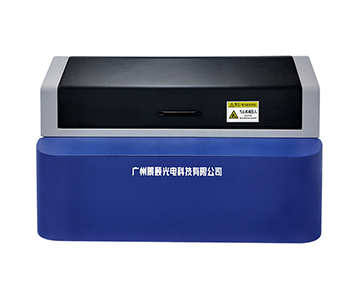
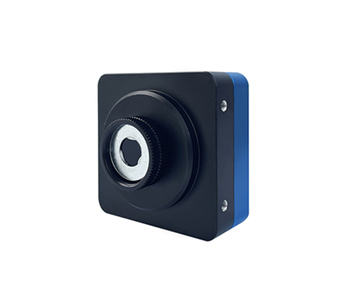
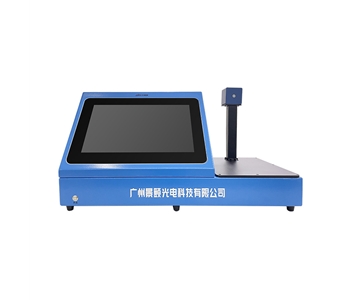
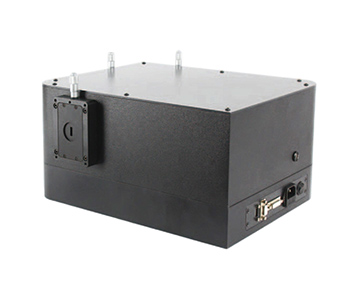
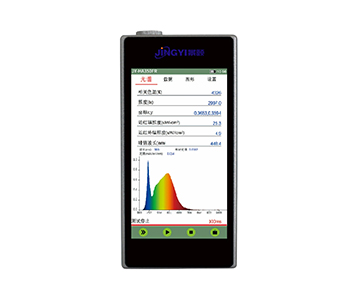
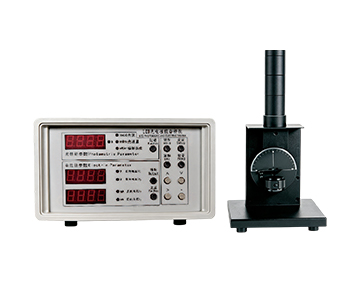
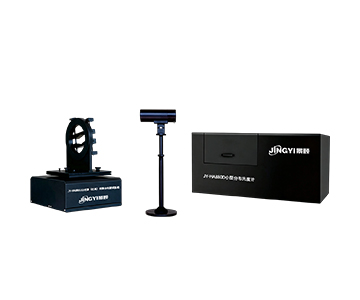
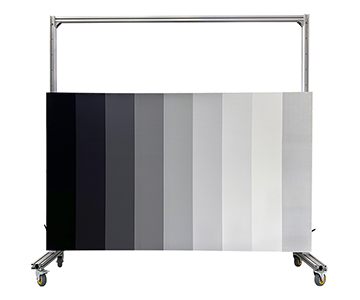
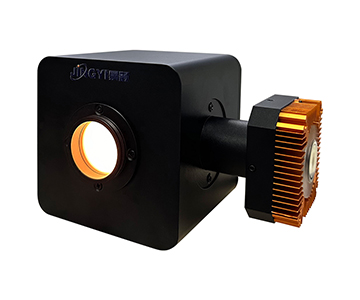
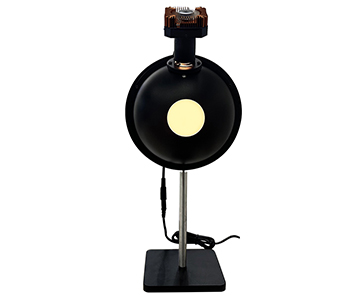
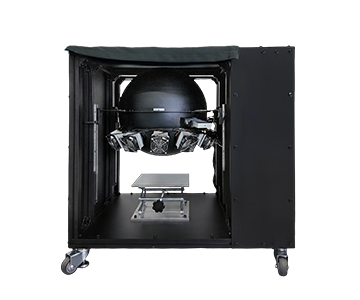
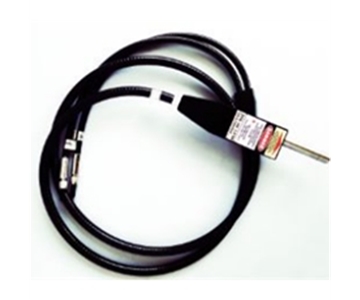
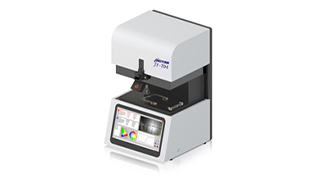
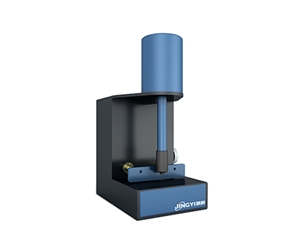
【插入图片:光学反射膜厚仪FILMTHICK-Mapping.jpg |
Cross‑Industry Migration: Micro‑Thickness Gauges and In‑Line Monitoring
Two Extensions: Micro‑Area and Thick Films
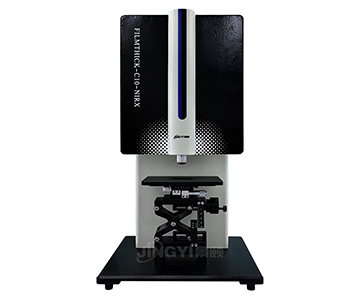
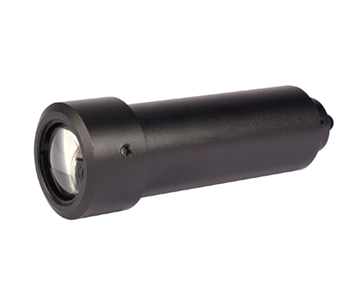
The same optical interferometry and algorithm stack can migrate to a microscopic thickness gauge. For patterned wafers where only line‑edge regions matter, spot size shrinks to micron level, with sub‑micron positioning preventing spot landing on trenches. At the other end, for 10 μm to 250 μm thick films, near‑infrared configuration spreads interference periods, avoiding FFT spectral aliasing.
Lab R&D to In‑Line Production
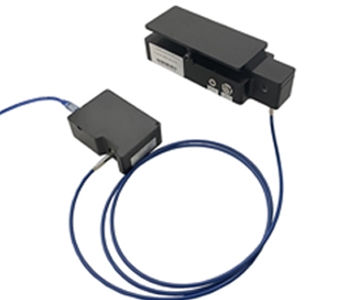
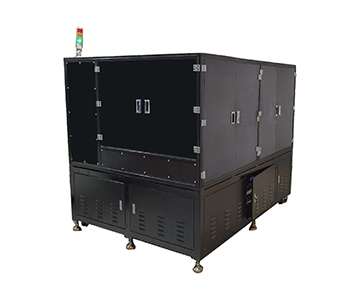
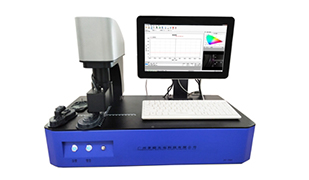
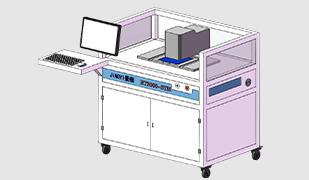
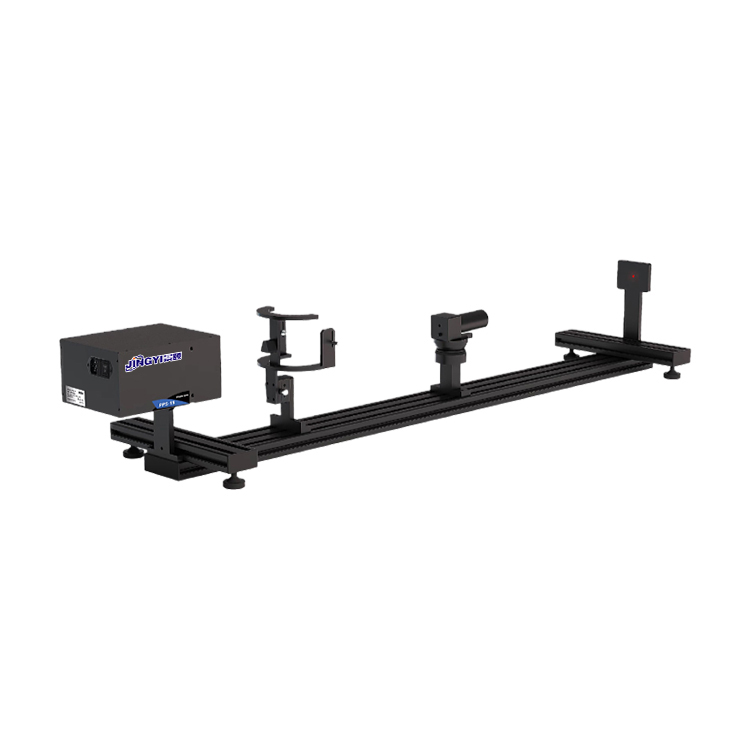
With slight modifications, R‑Theta scanning logic becomes a multi‑probe in‑line system: single‑station response compresses to 0.8 sec, shifting offline sampling forward to 100% in‑line inspection. LCD glass and optical coating roller parts can share the same refractive index database and extremum fitting results, reducing modeling costs during process changeovers.
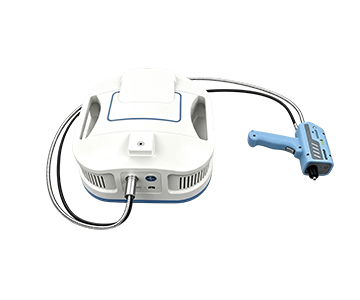
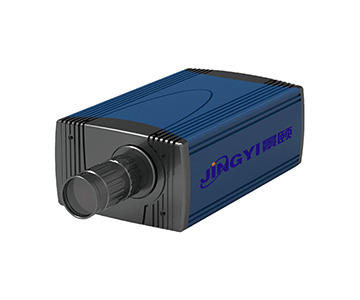
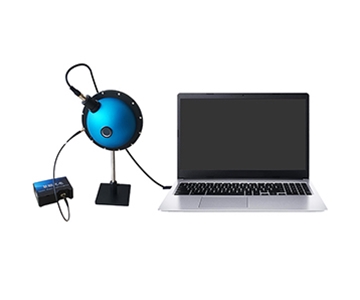
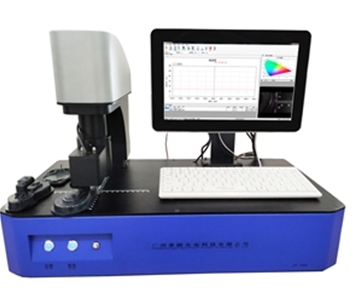
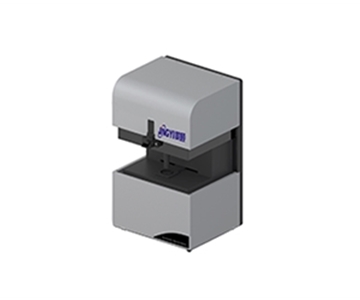
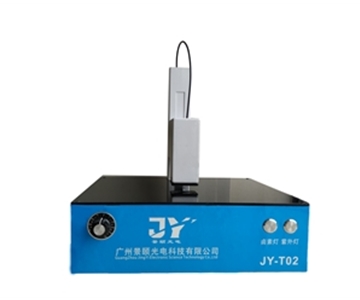
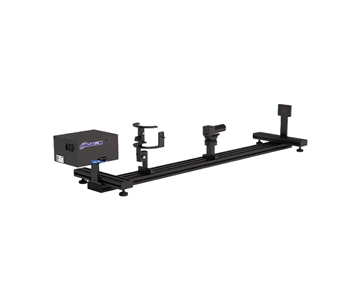
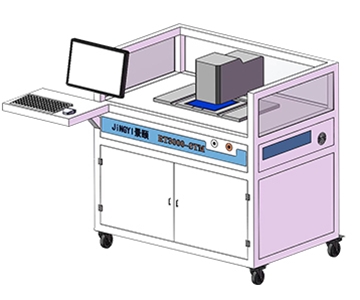
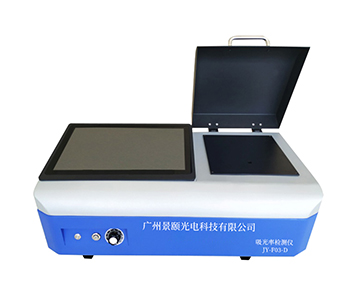
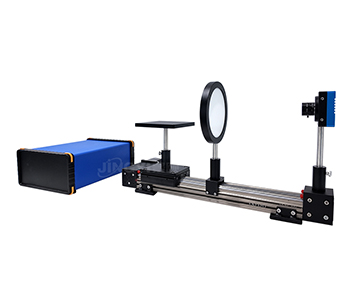
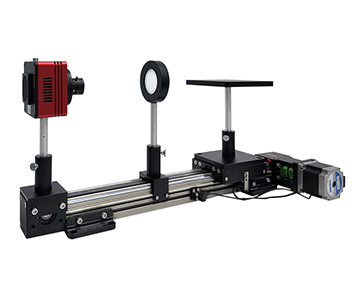
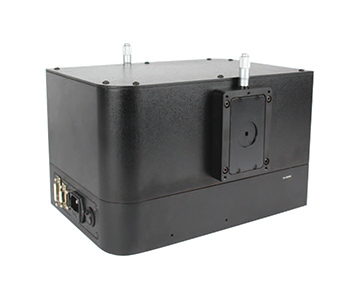
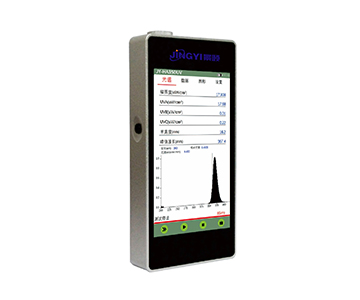
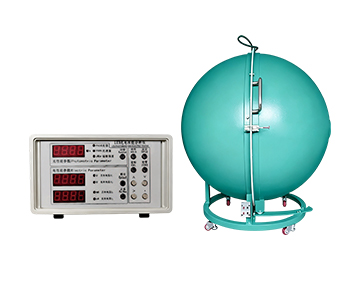
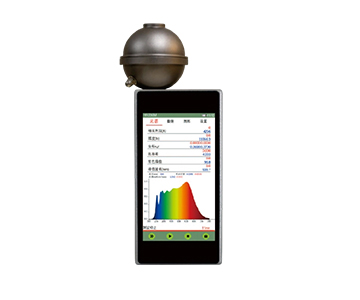
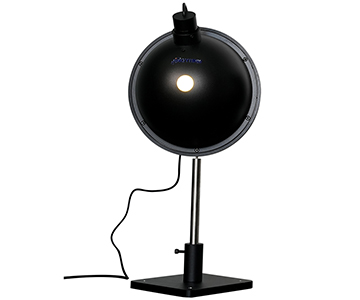
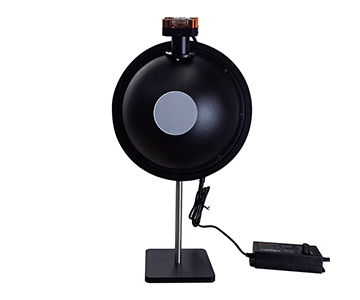
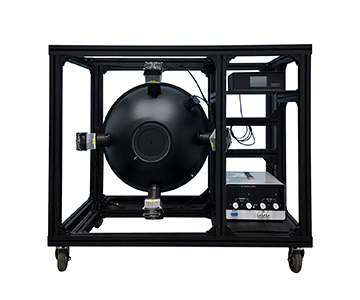
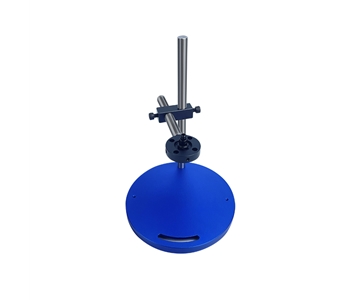
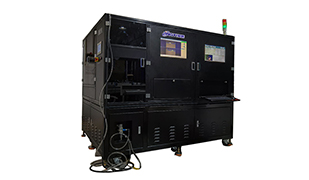
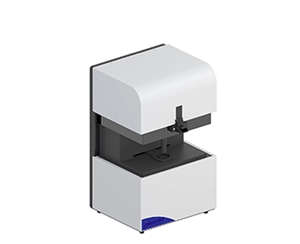
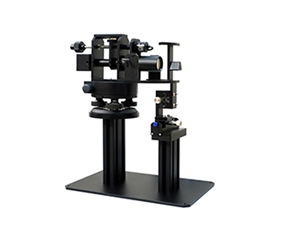
【插入图片:膜厚测量FILMTHICK-C40.jpg |
Applicability Boundaries and Practical Constraints
Optical reflection is not universal. For opaque metal thick layers and strongly scattering rough surfaces, reflected interference fringes attenuate beyond recoverability; eddy current or cross‑section comparison becomes necessary. Additionally, sub‑15 nm ultra‑thin films carry limited information in basic visible bands; extending to UV configuration stabilizes measurements.
Operationally, recipe editing, material library matching, and mapping path planning require process engineer involvement. If a production line only measures fixed single points, deploying full R‑Theta and 3D modeling actually increases maintenance complexity. Procurement should confirm compliance with T/CIET 2298‑2026 to ensure complete metrological traceability, rather than fixating on advertised resolution numbers.
Frequently Asked Questions
Q: How does an optical reflection thickness gauge ensure multi‑point measurement consistency?
A: By fixing the optical head and using polar coordinate sample motion to reduce backlash, combined with vacuum chuck and standard sample calibration. In 100 repeated measurements, maximum thickness range stays within 0.2 nm.
Q: Which sample formats suit R‑Theta scanning?
A: Ideal for 2–12 inch wafers, ring‑shaped, and radial path samples. For square or irregular substrates, XY coordinate stages offer better path utilization.
Q: What role does extremum fitting play in AR coating thickness detection?
A: Extremum method rapidly locates envelope peaks and valleys in the reflection spectrum. Combined with FFT and curve fitting, it simultaneously outputs film thickness, refractive index, and extinction coefficient—well suited for tens‑of‑nanometers thin films.
Q: How should buyers evaluate data repeatability cost during procurement?
A: Look beyond single‑point accuracy. Assess 100‑repeat range, stability, and spot consistency. Require vendors to provide standard sample test records and SPC statistical outputs.
Q: How can I independently verify long‑term stability during acceptance?
A: Use third‑party traceable calibration samples for continuous measurement, recording mean, range, and standard deviation, observing drift over one week. Cross‑check calibration chain against T/CIET 2298‑2026, without relying on vendor‑supplied conclusions.
About This Guide
Data Sources
: T/CIET 2298‑2026 Calibration Specification for Thin Film Interference Thickness Measurement Systems, in‑house validation reports (n=100 measurements on 100nm SiO₂/Si wafers), uploaded product technical documentation.
Author
: Cai Xiaodong, Senior Application Engineer, Jingyi Optoelectronics, 10+ years in optical thin film characterization and spectral systems.
Disclosure
: Jingyi Optoelectronics manufactures optical thickness measurement systems. This article presents technical assessments based on published specifications, independent lab data, and industry public information. No compensation was received from third‑party brands mentioned.
Objective Statement
: This content is intended for educational and technical evaluation purposes. Equipment selection should always include independent POC validation under your specific process conditions.
Last Updated
: November 2026
For detailed specifications and application notes on optical film thickness measurement systems, search "Jingyi Optoelectronics film thickness measurement" or visit our technical library.