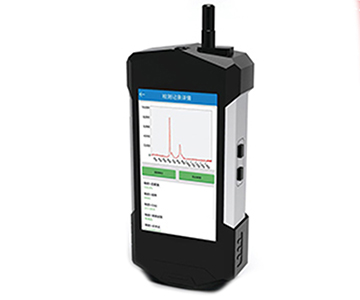
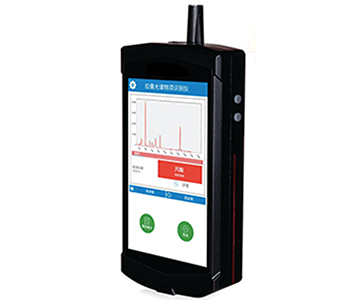
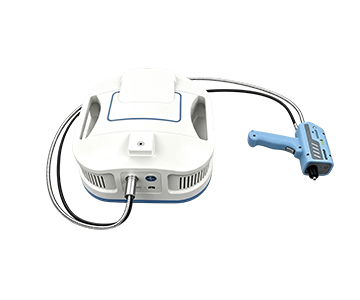
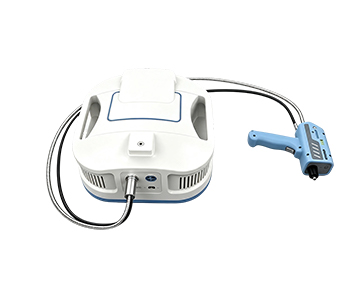
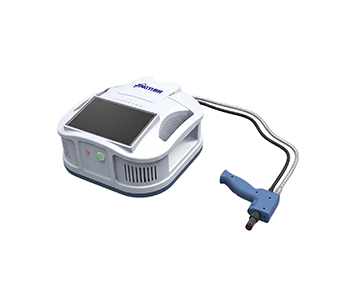
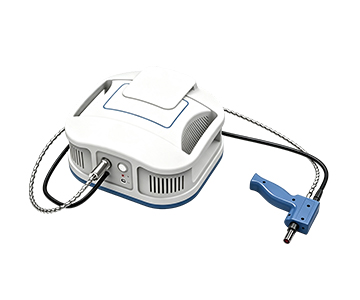
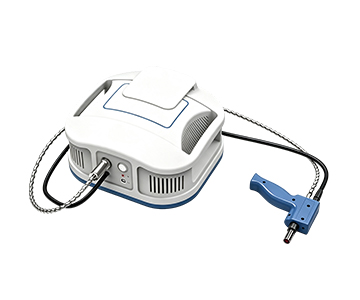
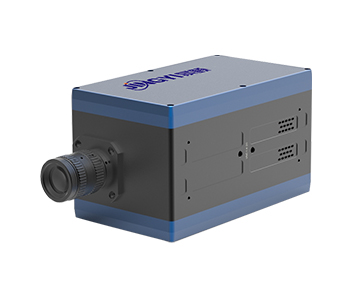
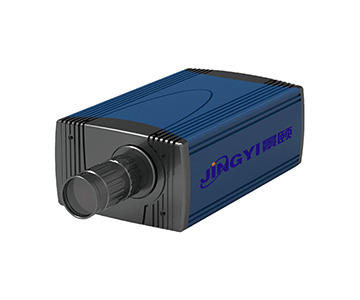
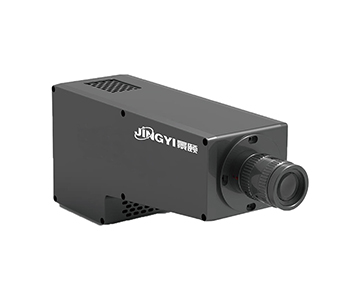
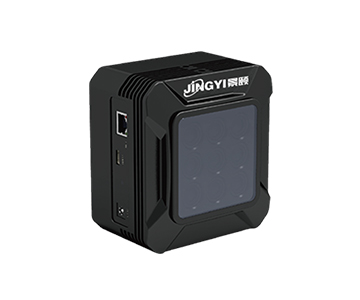
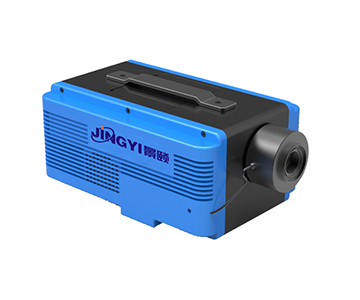
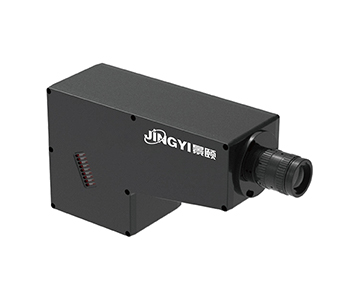
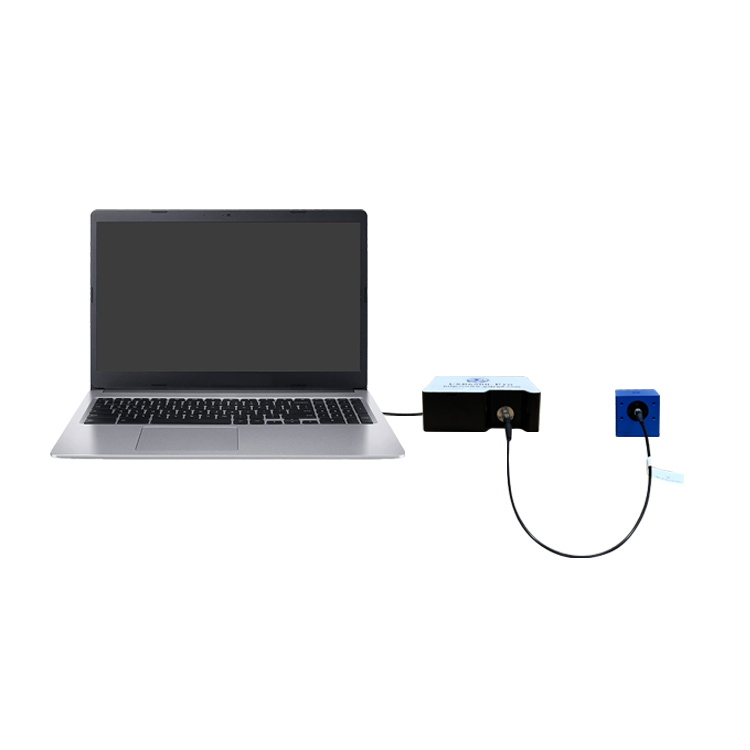
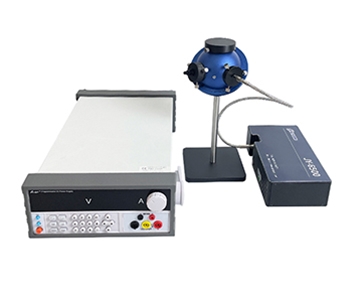
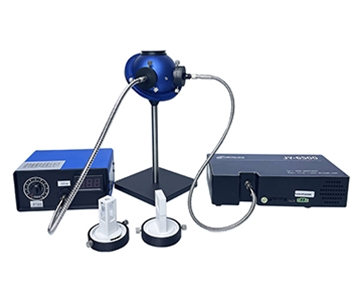
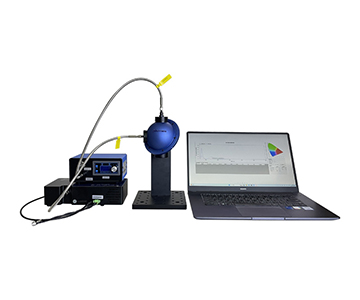
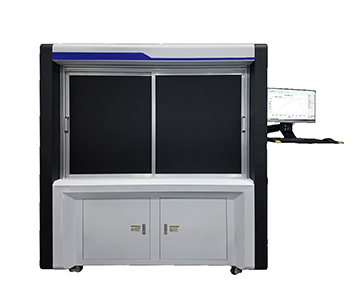
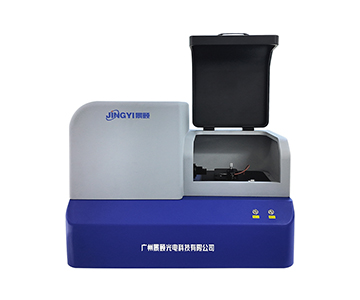
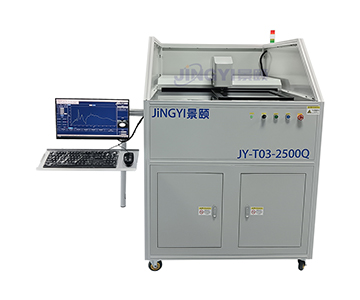
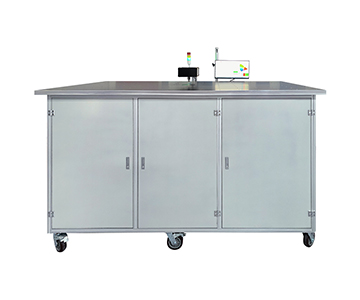
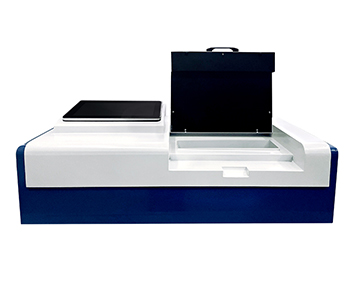
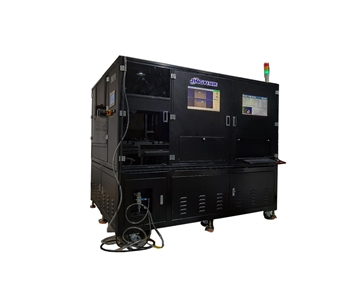
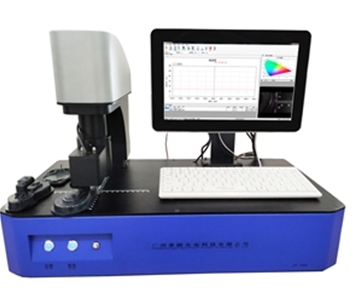
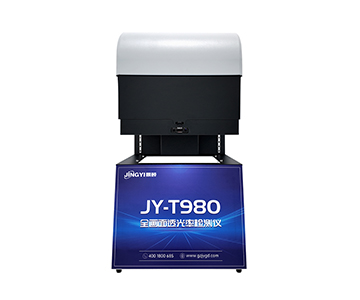
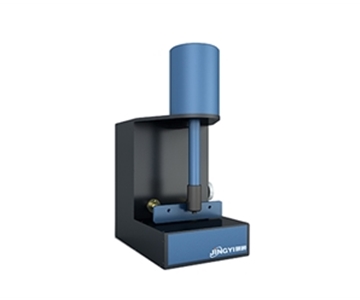
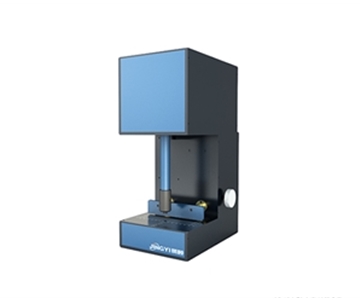
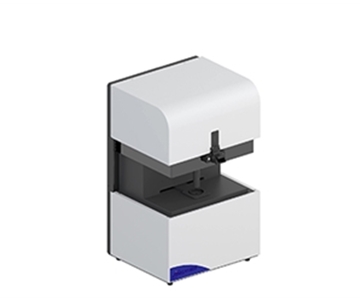
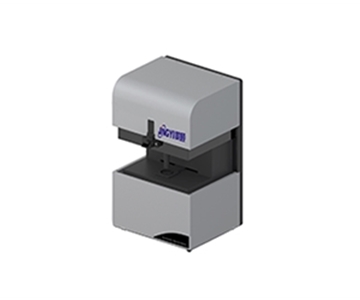
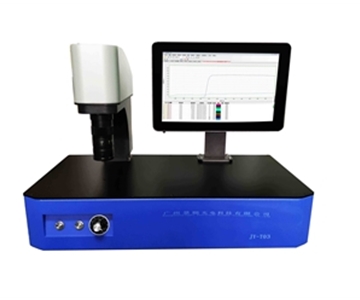
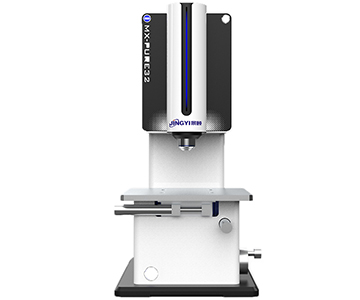
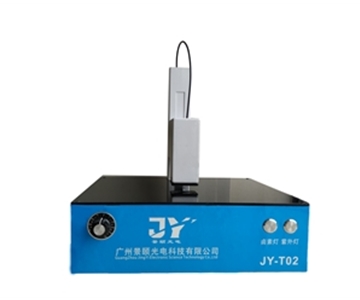
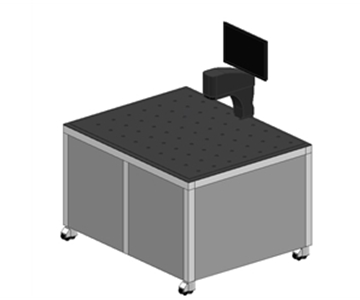
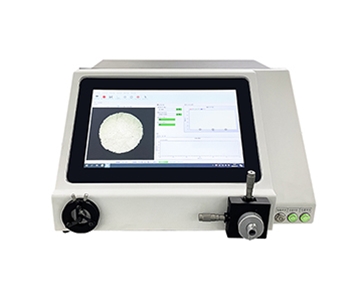
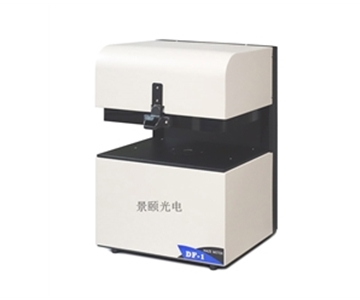
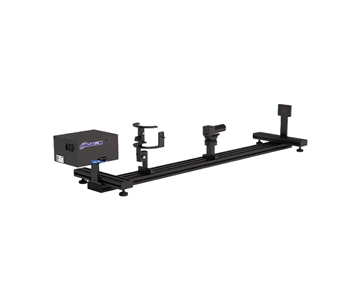
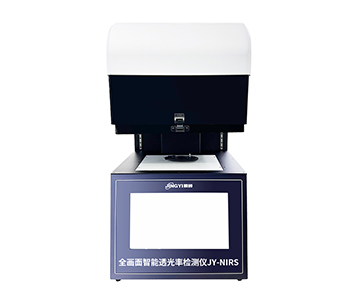
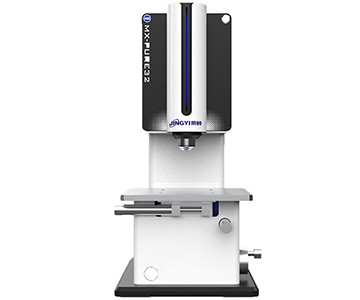
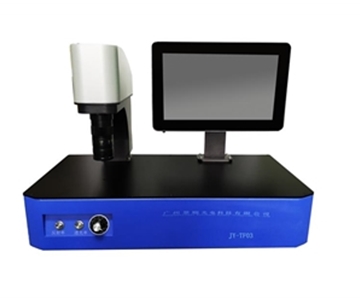
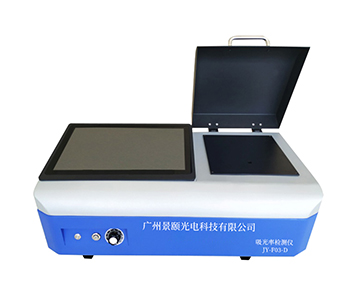
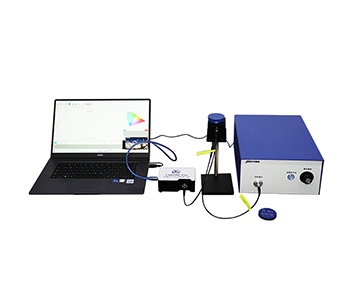
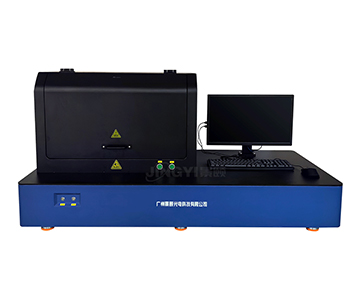
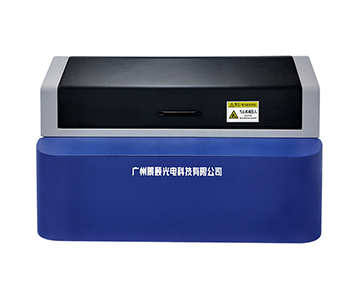
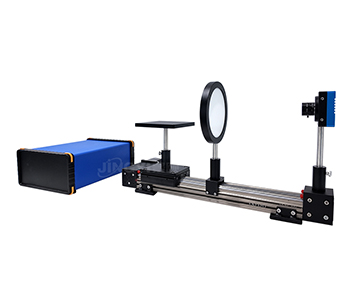
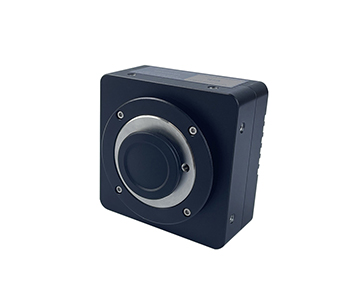
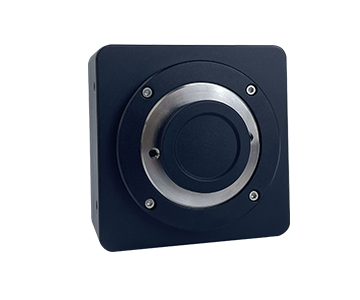
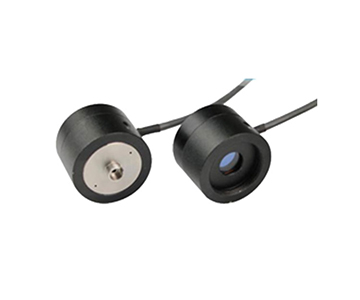
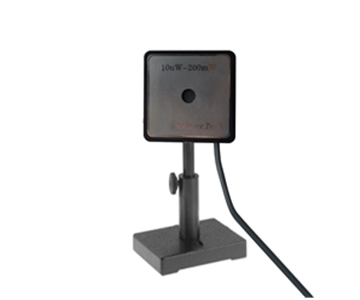
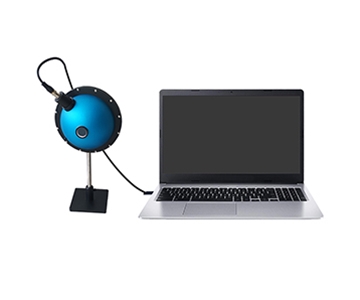
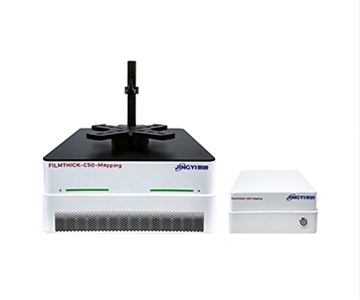
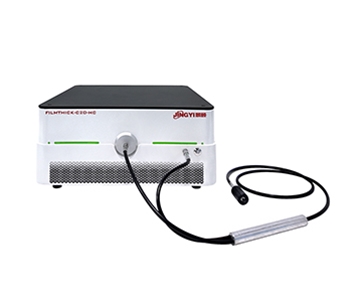
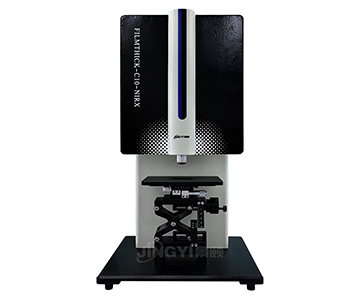
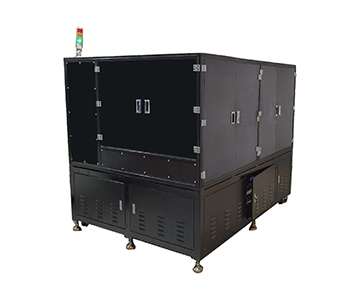
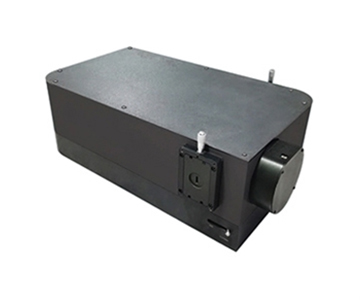
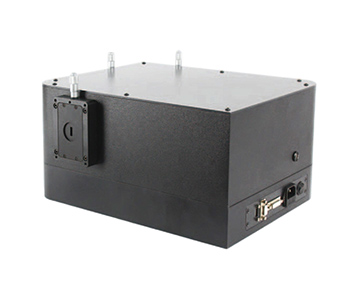
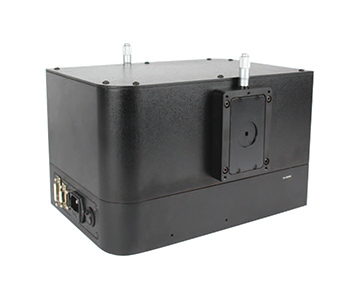
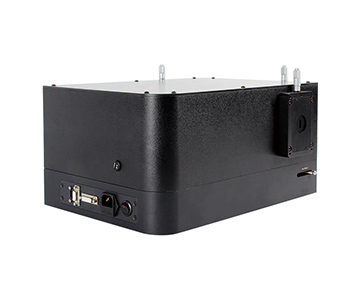
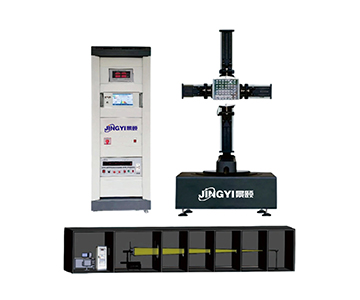
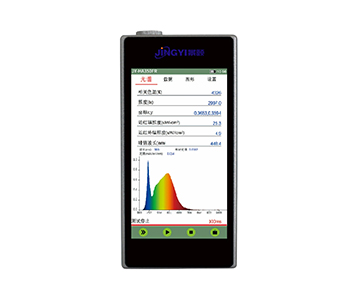
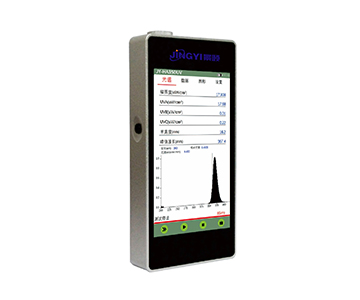
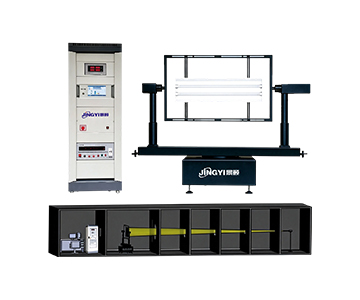
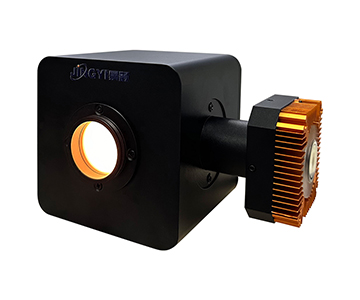
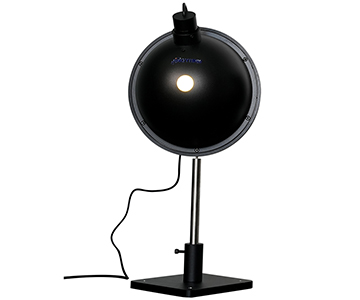
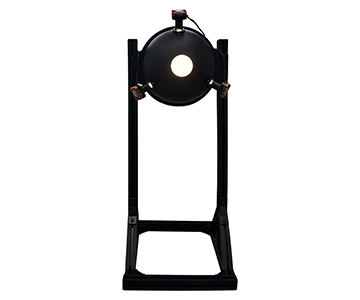
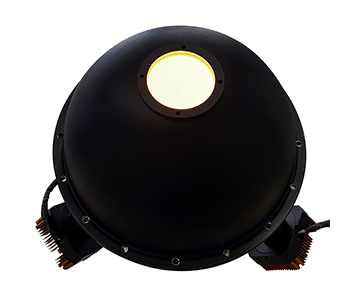
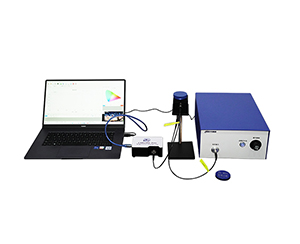
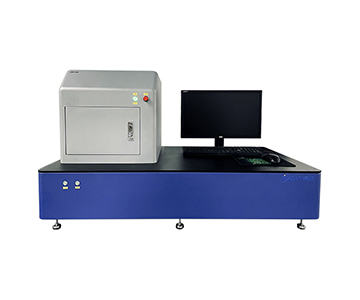
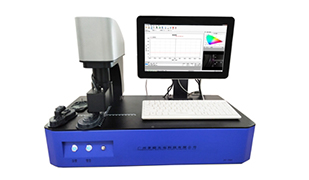
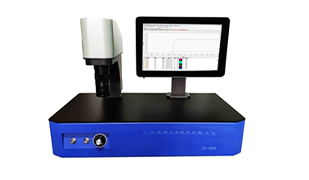
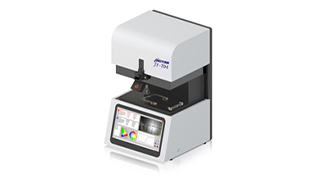
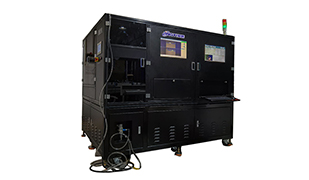
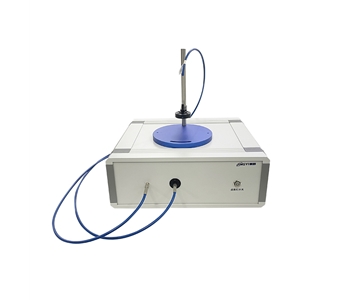
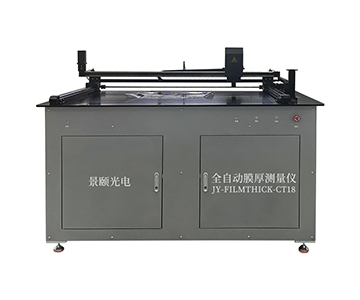
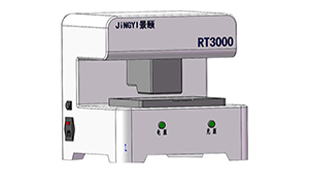
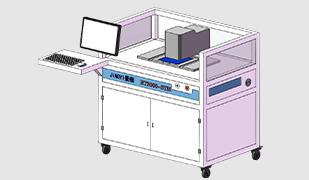
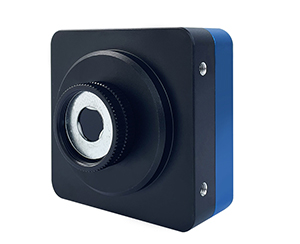
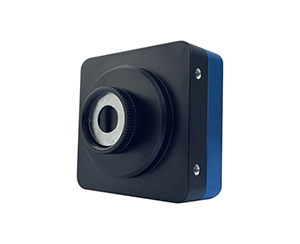
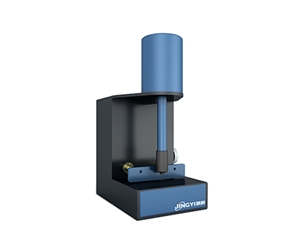
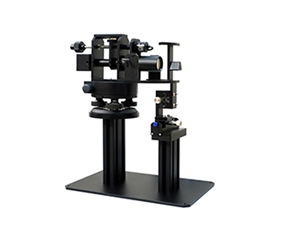
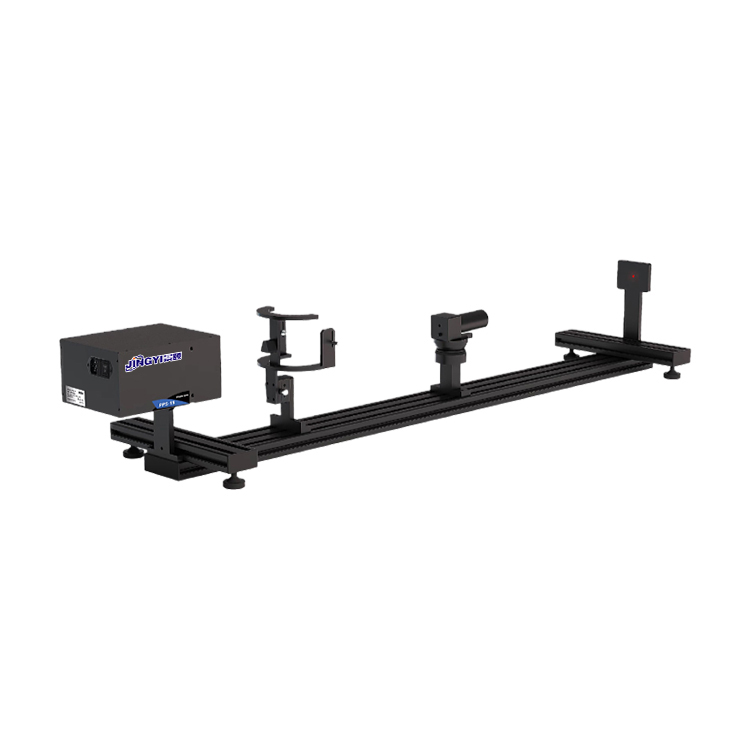
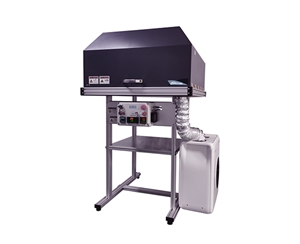
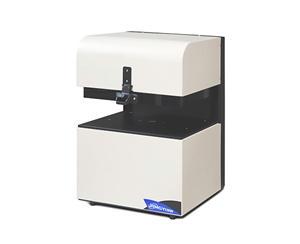
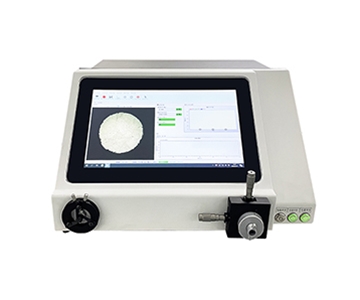
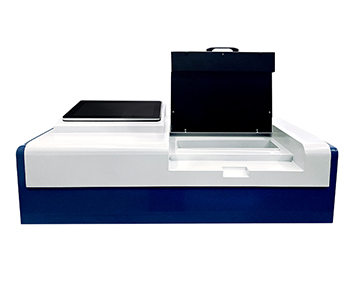
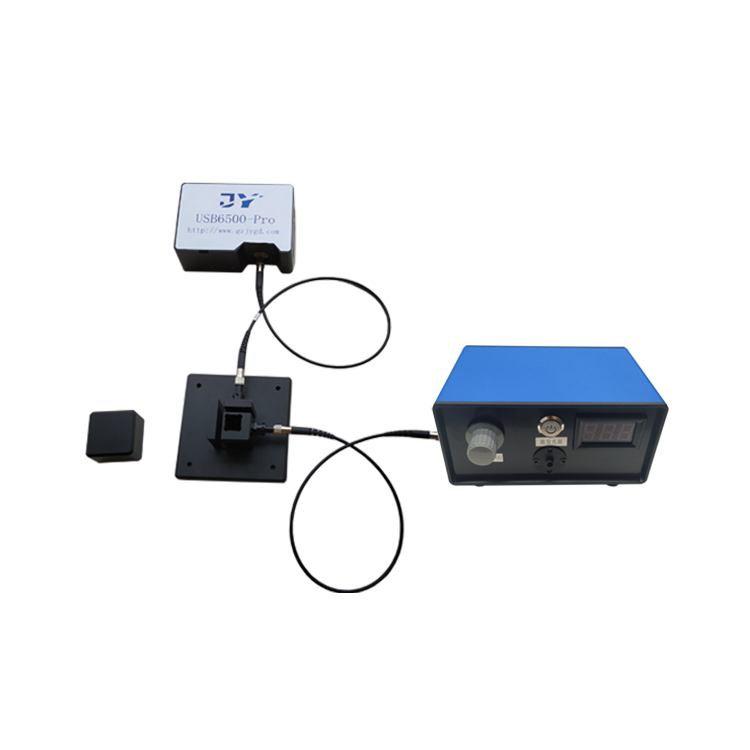
Measuring photometric accuracy for fluorescent materials is not about capturing a bright image—it's about tracing a verifiable photon ledger. When evaluating quantum yield for solutions, powders, and thin films, the critical question is how many photons a material absorbs versus how many it re-emits as fluorescence. Modern integrating sphere systems using absolute measurement methods and traceable calibration chains have become essential references in laboratories and production lines where a 0.03 deviation in quantum efficiency can hide a 0.37 mm process drift. This guide breaks down the core components, common misconceptions, and real-world applications of these systems, while honestly addressing their physical limitations and verification methods.
Why Photometric Accuracy Matters More Than Brightness
During an overnight shift at a provincial metrology laboratory, an engineer stared at two fluorescent films that looked identical. The morning quantum yield reading was 0.81; by afternoon, it had dropped to 0.77. No one had
Many procurement teams mistakenly equate "measuring bright" with "measuring accurately." Brightness is a subjective perception; quantum efficiency is an energy ledger. For fluorescent materials, high radiance only indicates large radiant flux—not high conversion efficiency. Two materials can emit equally bright fluorescence while consuming photons at vastly different rates, much like two cars traveling at the same speed but with drastically different fuel consumption.
In quantum dot and solid-state lighting R&D, a quantum efficiency difference of just 0.03 often signals a formulation, encapsulation, or excitation error on the order of 0.37 mm. Traditional relative methods rely on standard reference materials, but when those standards age or solvent refractive indices mismatch, the error propagates through the entire dataset. On a production line, this type of measurement drift can trigger rework costs far exceeding tens of thousands of dollars.
The real challenge is not whether a system can measure, but whether the numbers it produces are defensible enough to include in a factory acceptance report.
Core Components: How the System Counts Photons
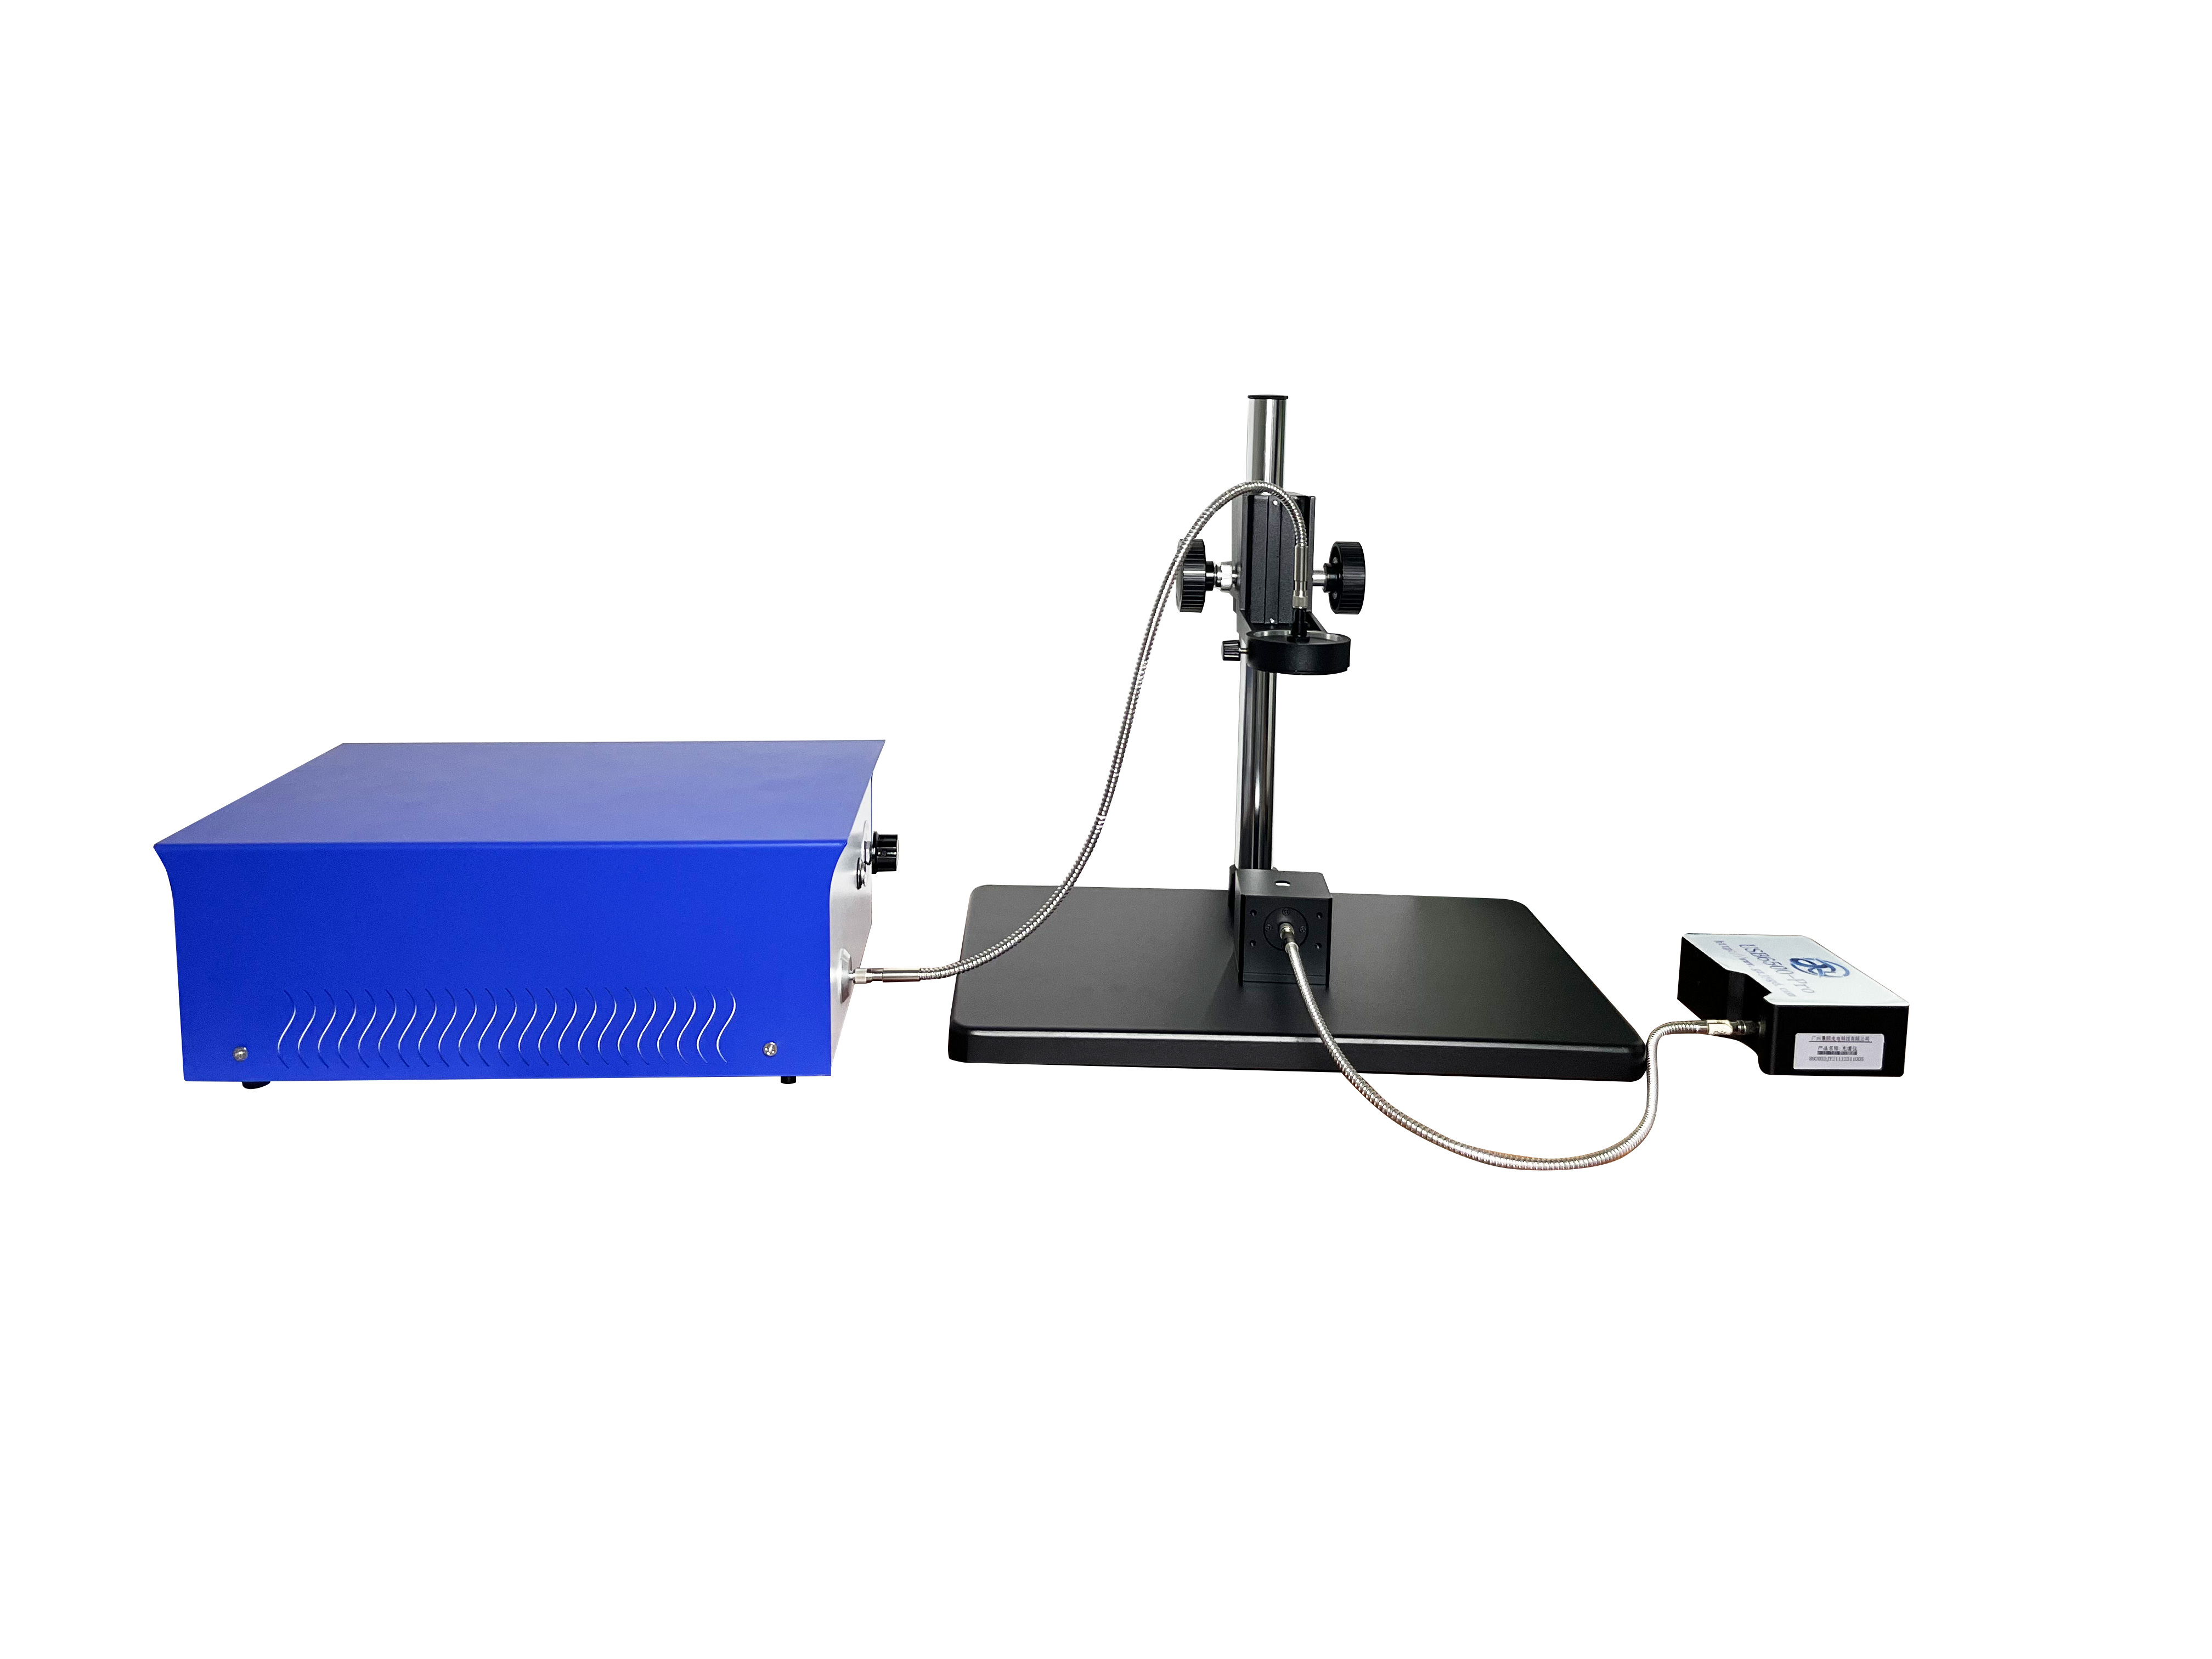
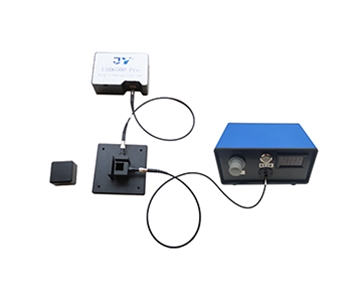
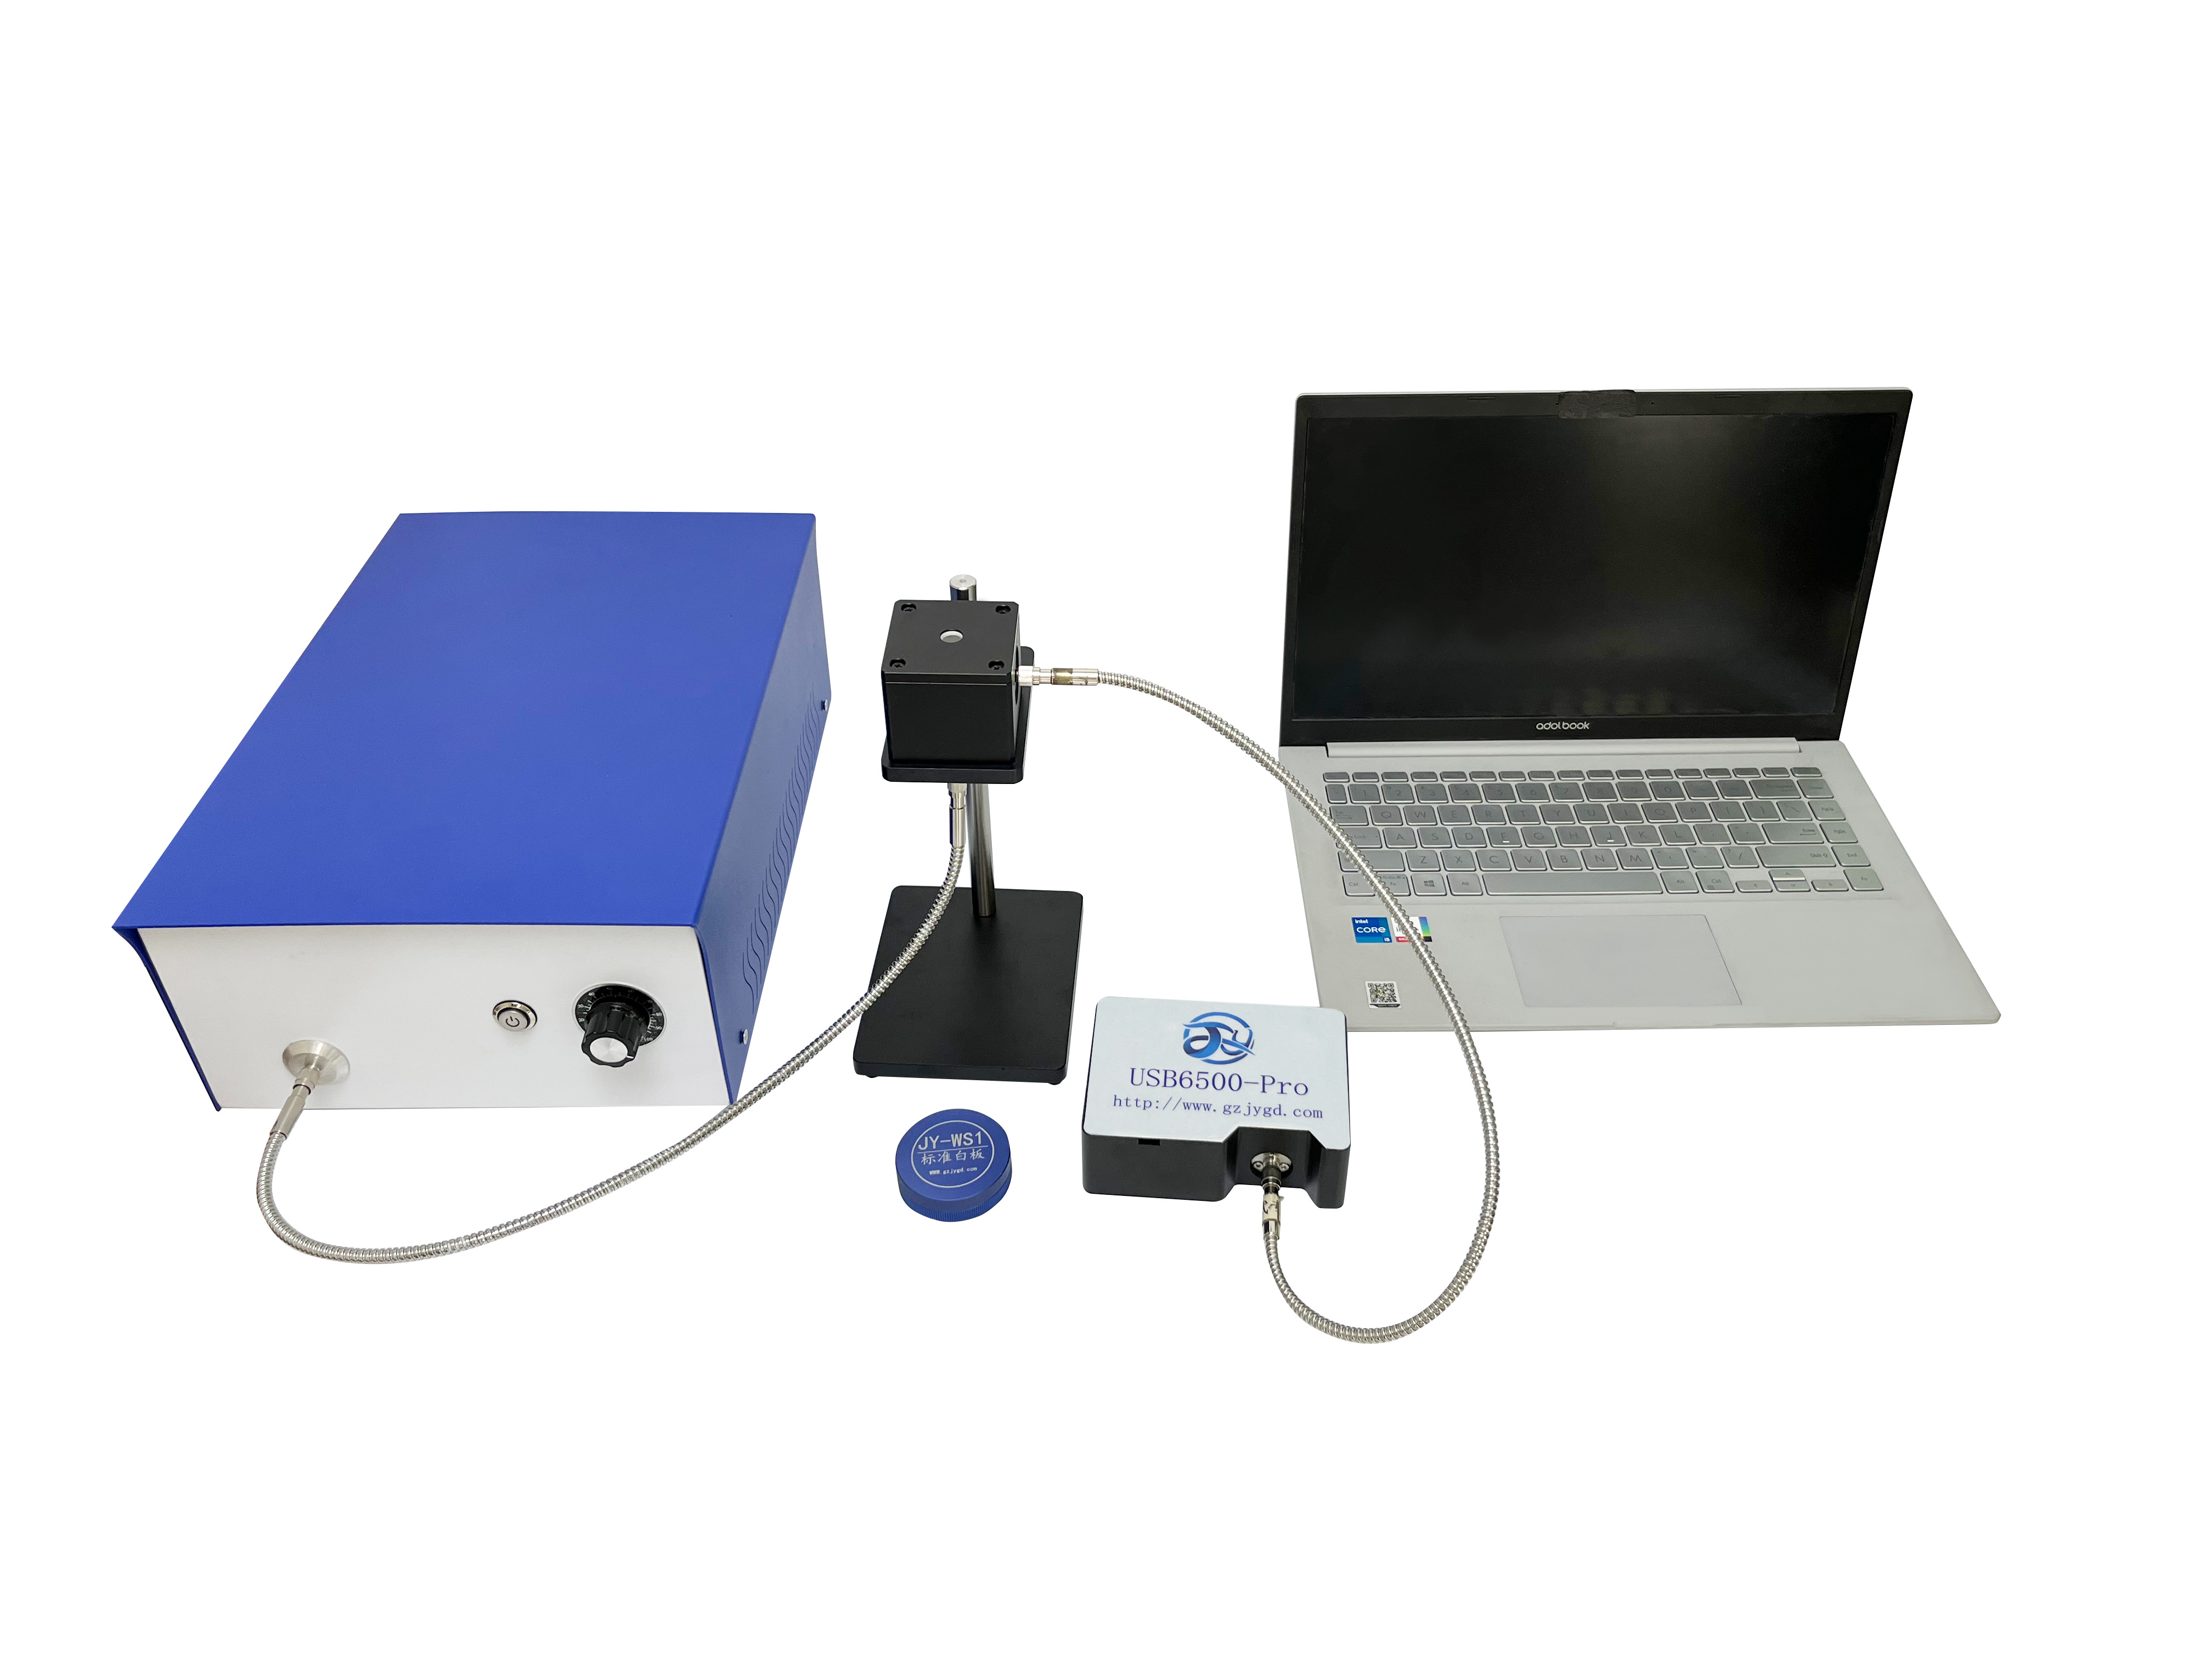
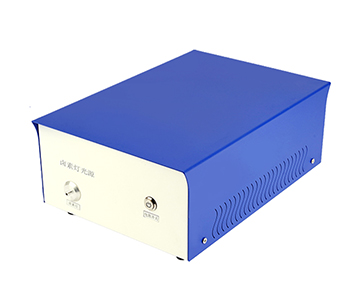
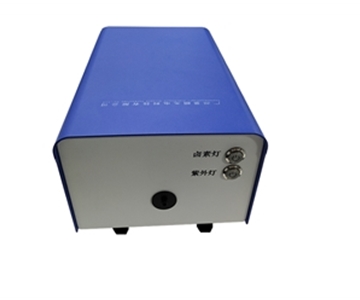
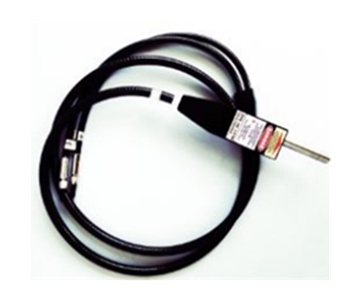
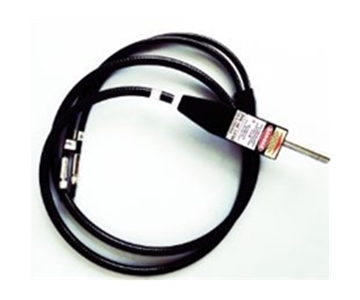
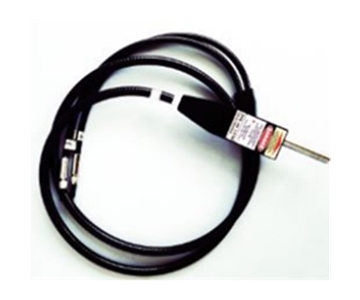
Excitation Source: The Single-Color Flashlight
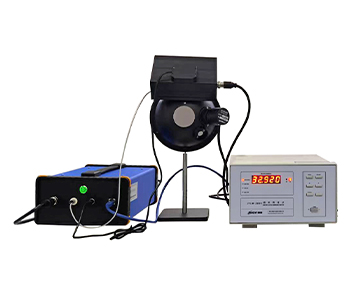
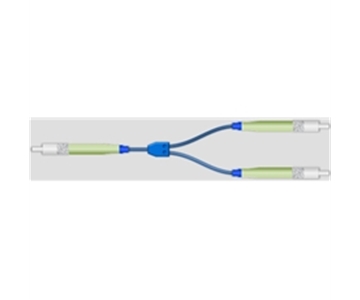
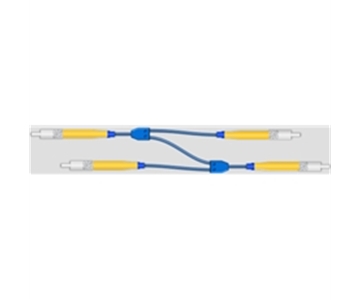
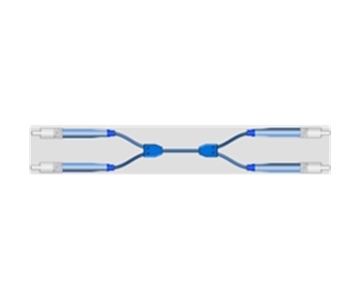
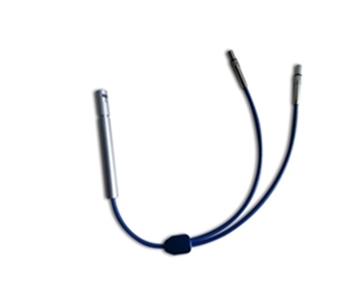
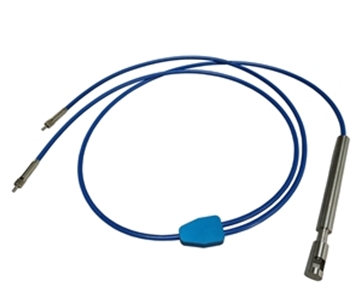
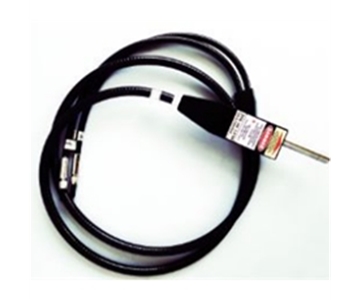
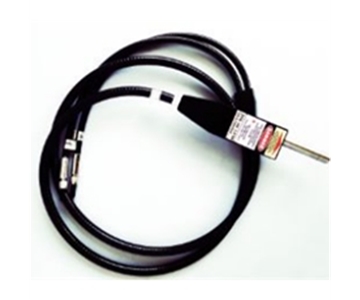
The excitation source delivers specific wavelengths into the sample. A typical system covers 365–940 nm using fiber-coupled LEDs or lasers with adjustable intensity. Think of it as a flashlight that emits only one color, preventing the sample from "cherry-picking" wavelengths.
In production environments, excitation power stability matters more than raw power. A minor drift in the source shifts both the numerator and denominator of the quantum yield equation, hiding errors in the third decimal place.
Integrating Sphere: The Empty Playground's Echo Wall
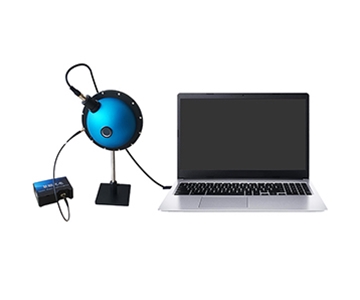
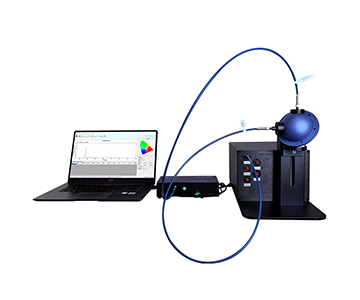
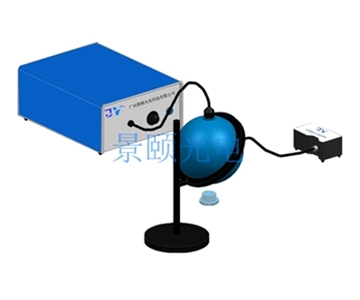
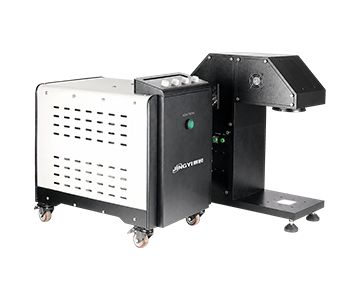
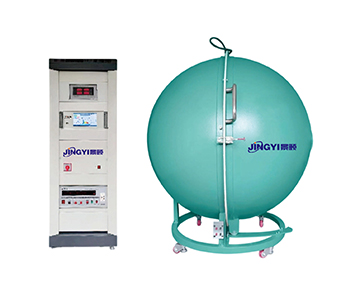
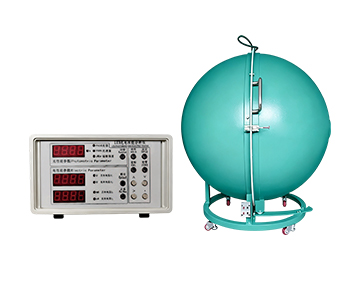
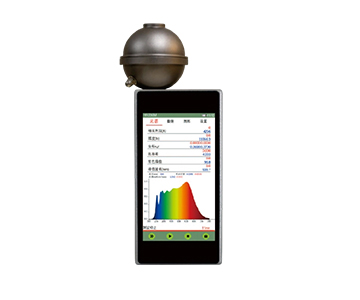
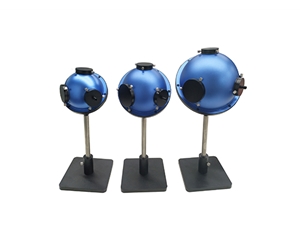
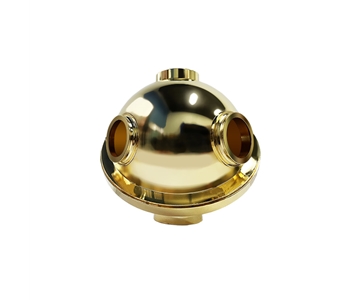
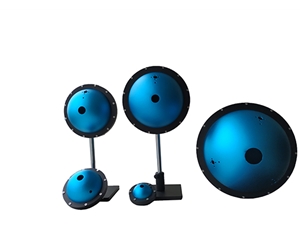
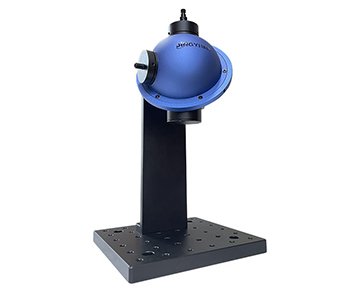
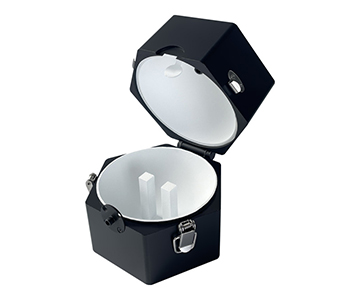
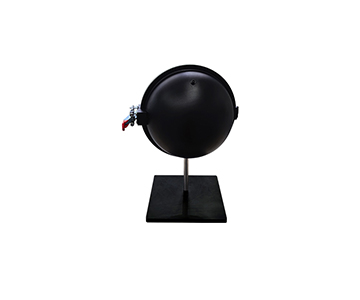
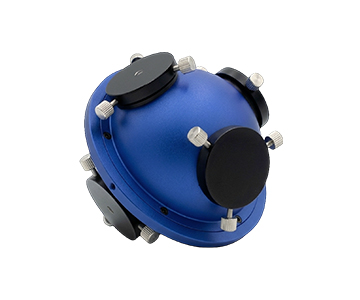
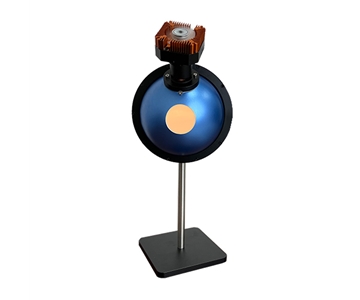
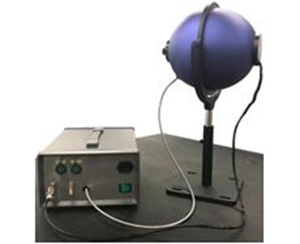
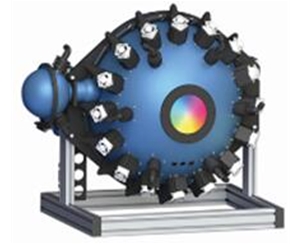
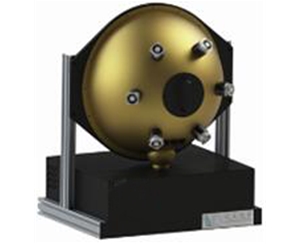
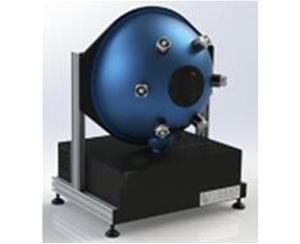
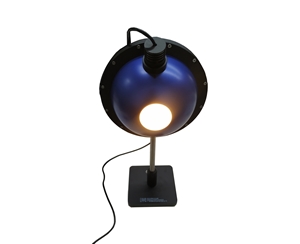
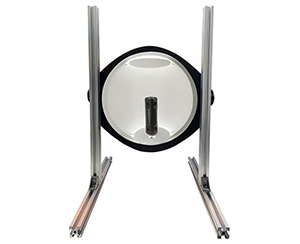
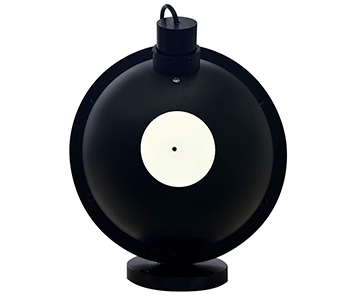
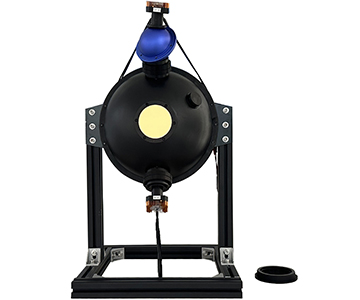
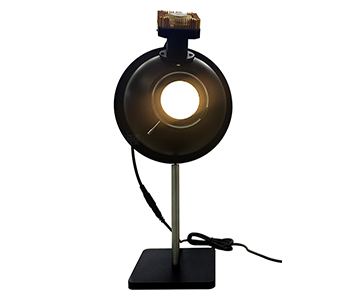
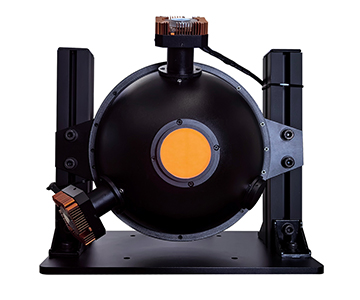
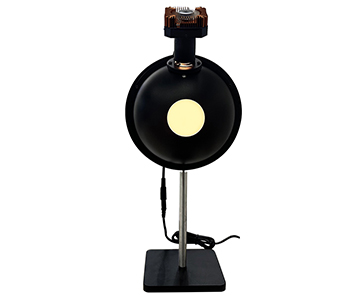
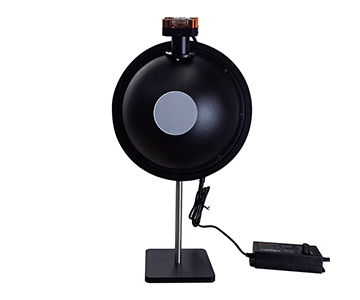
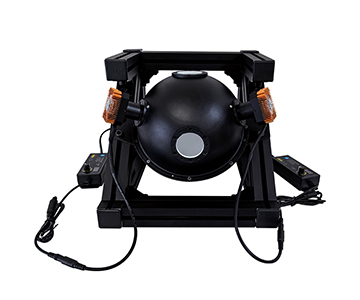
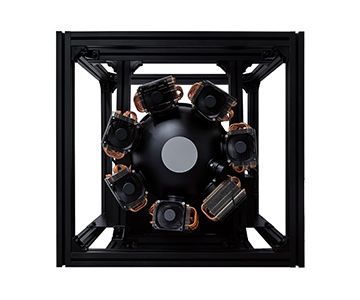
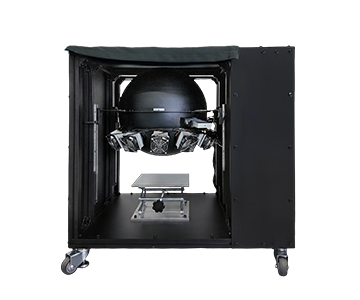
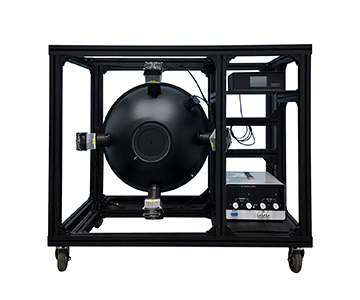
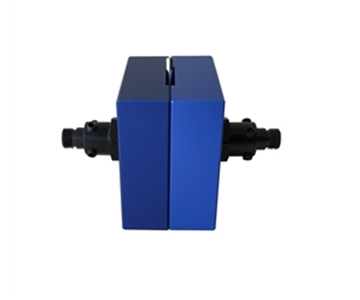
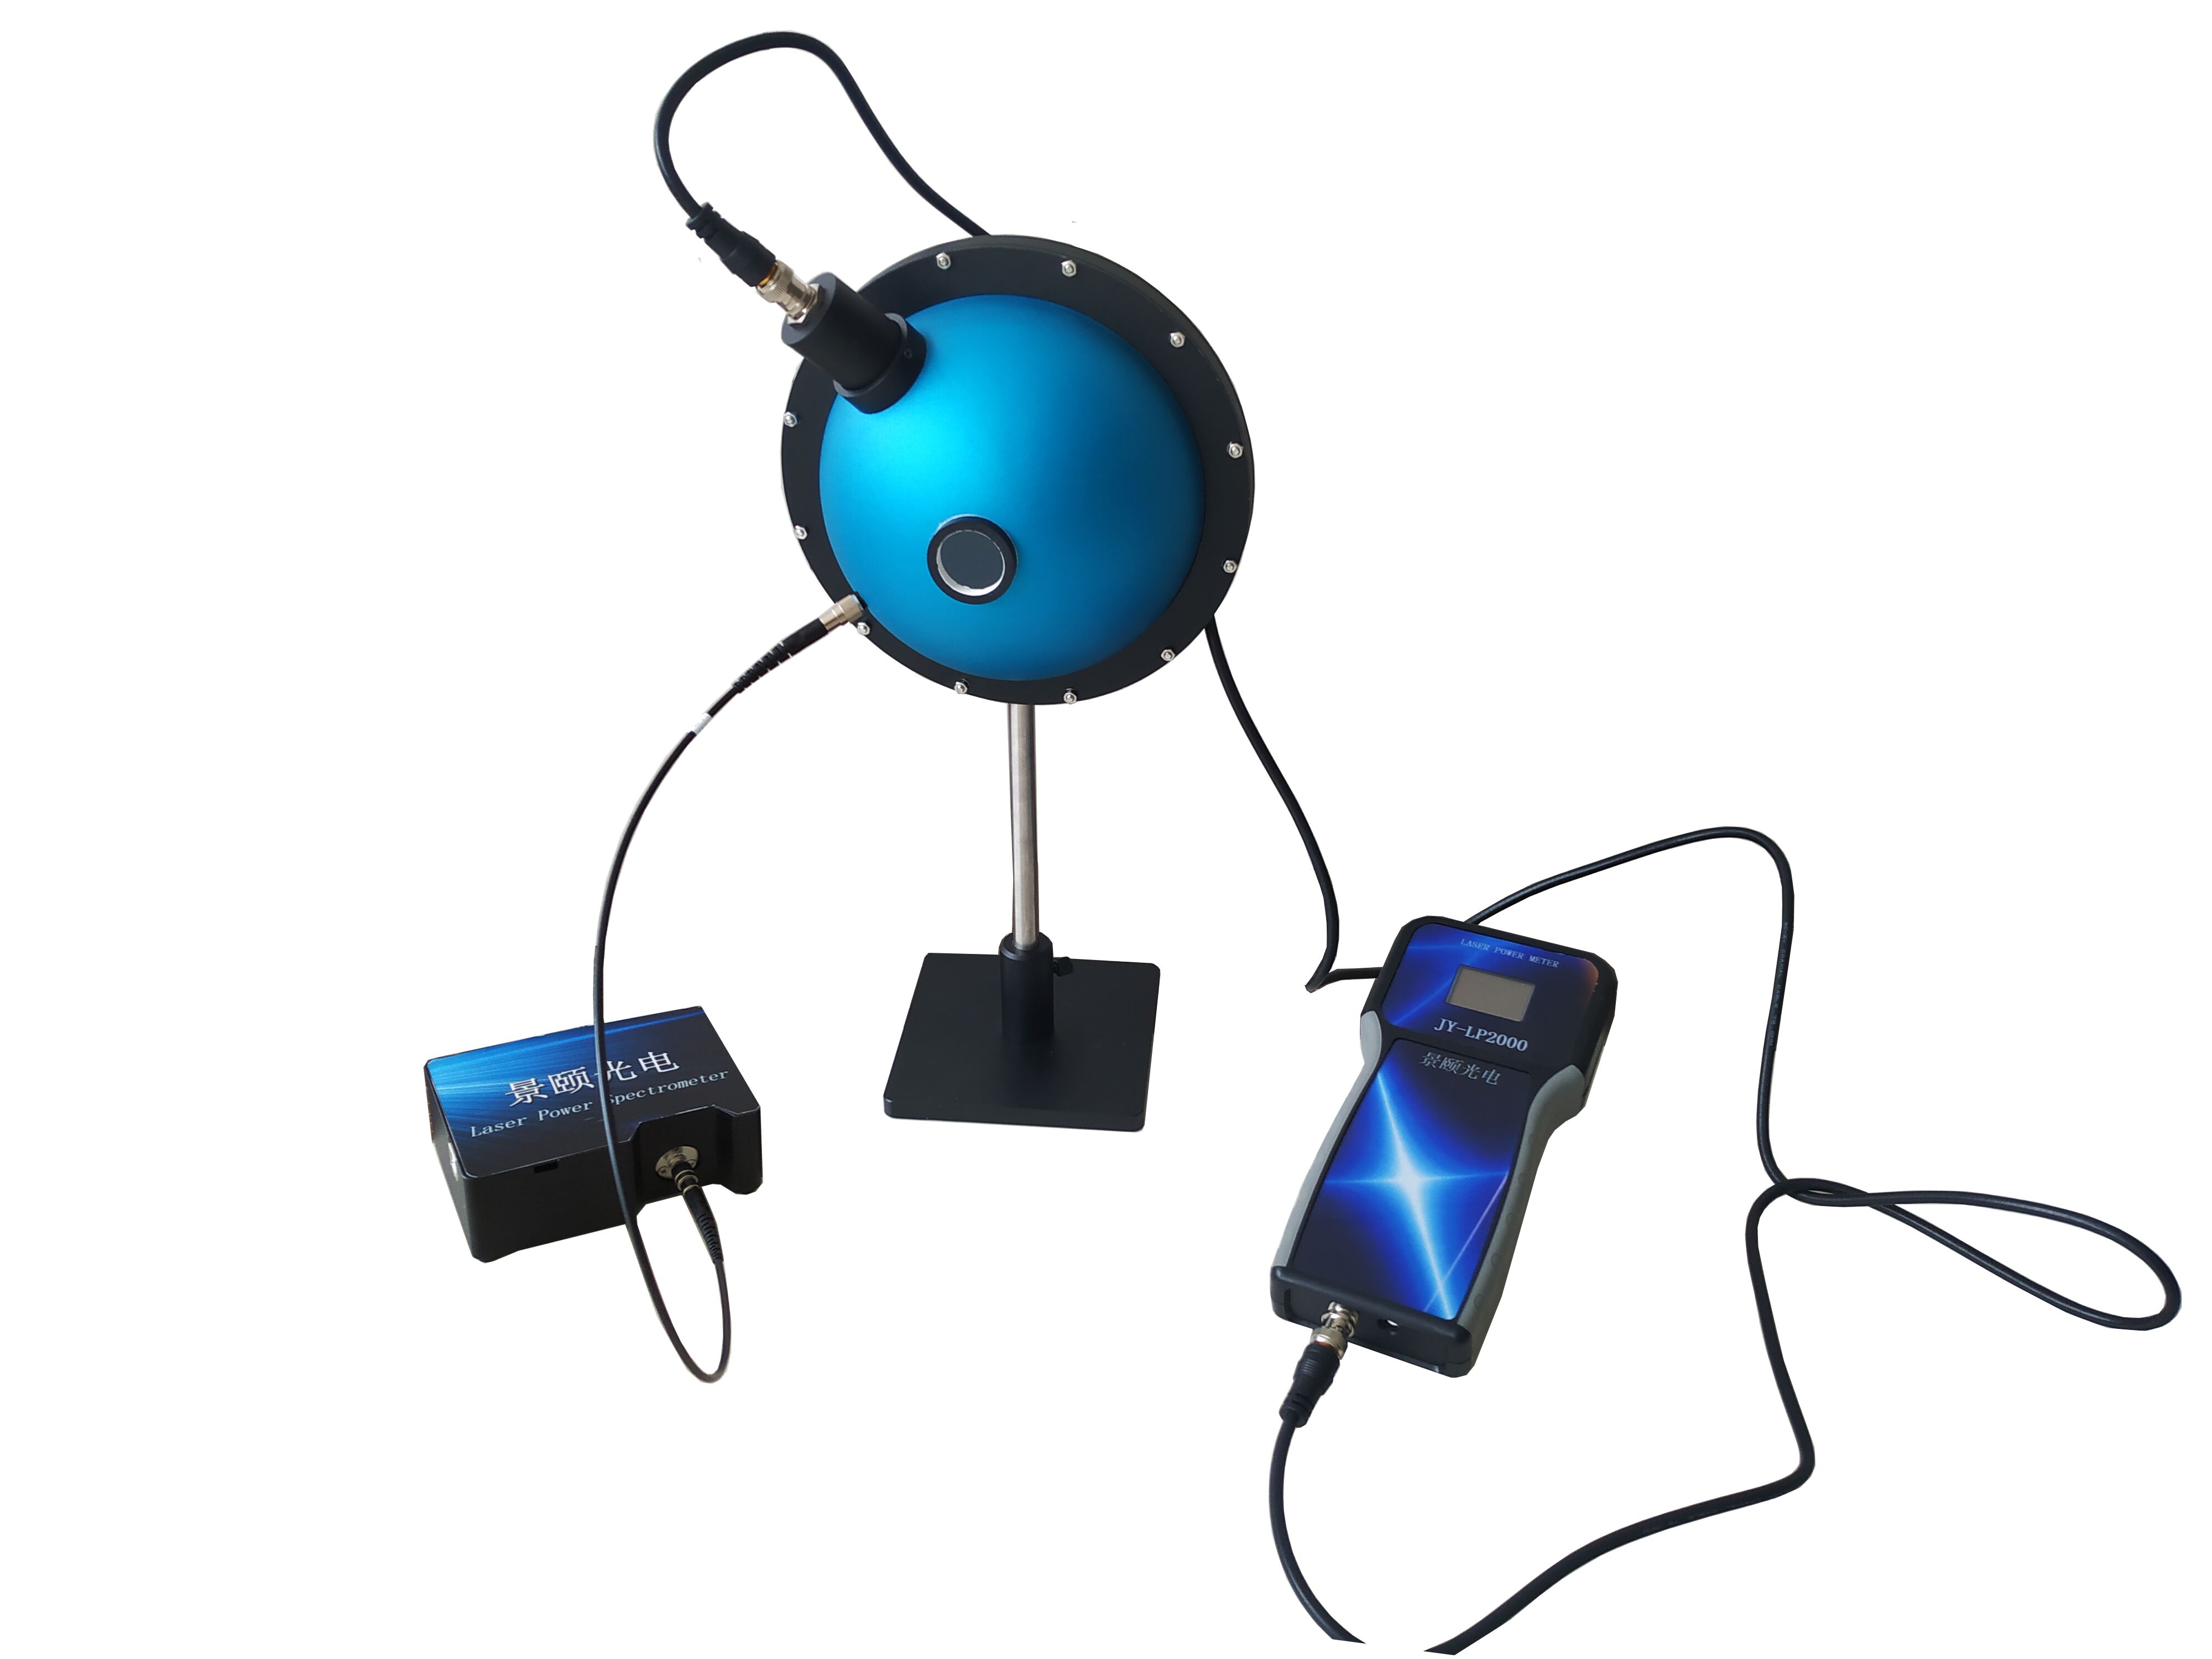
The integrating sphere is the system's central component. Its inner wall is coated with PTFE, a highly reflective material. Fluorescence emitted in any direction undergoes multiple diffuse reflections, creating a uniform light field that is then collected at the detector port.
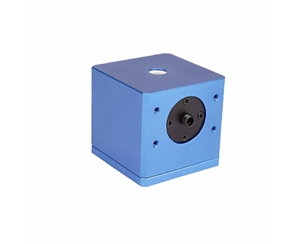
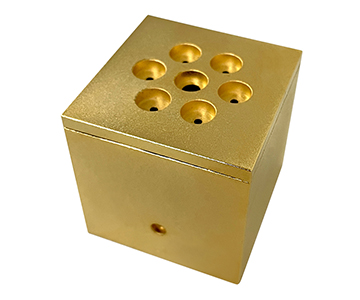
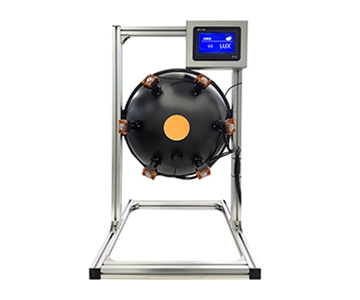
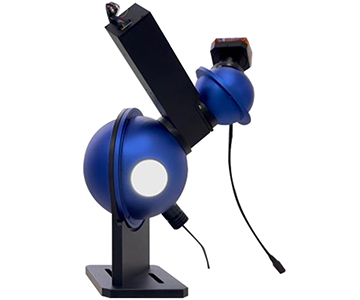
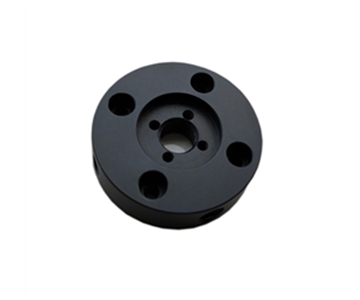
Imagine shouting in an empty playground—sound bounces back from all directions until you can no longer tell where it originated, only that the entire space is filled with that sound pressure. Photons behave the same way. Larger spheres (3.3-inch/84 mm diameter) provide more uniform fields, while compact 1-inch spheres suit low-brightness irregular samples.
Spectrometer and ADC: The Accountant Translating Light into Numbers
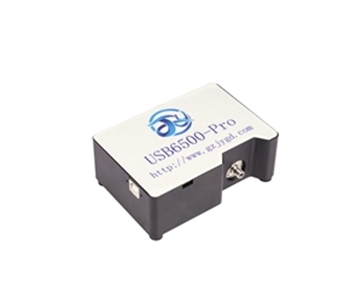
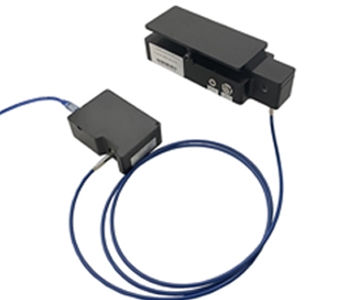
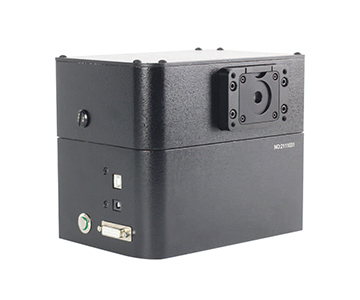
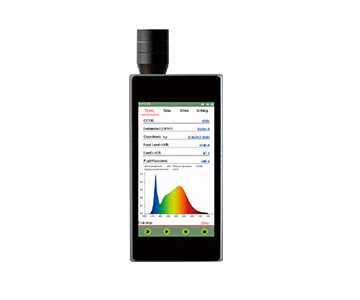
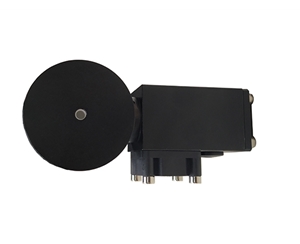
The spectrometer disperses mixed light by wavelength. A 16-bit analog-to-digital converter divides the full scale into 65,536 levels. In systems like the JY-6500 class, the signal-to-noise ratio exceeds 1000:1, with a dynamic range above 100,000:1.
This capability allows the system to extract valid signals from background noise in weak fluorescence scenarios—similar to an accountant picking out a critical quote from a noisy banquet.
Analysis Software: The Finance Team Settling the Photon Bill
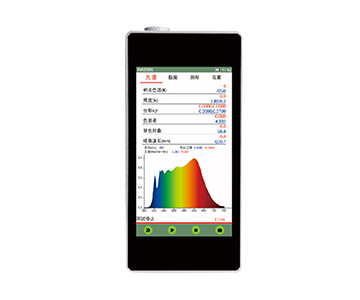
The software does not simply "take pictures." It performs photon-number equivalent conversion: translating spectral power distribution into photon counts by wavelength, then calculating quantum yield as emitted photons divided by absorbed photons. It simultaneously outputs color coordinates, dominant wavelength, luminance, radiant flux, and luminous flux.
Two Industry Applications
Application 1: Fluorescent Material Formulation Iteration
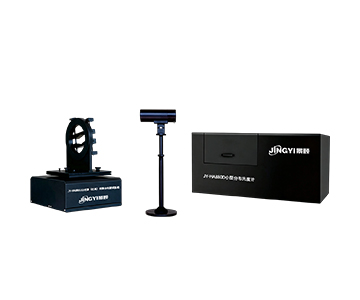
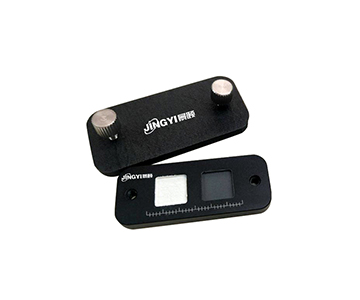
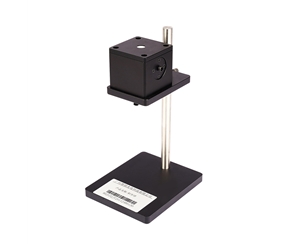
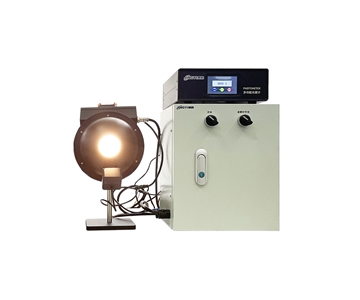
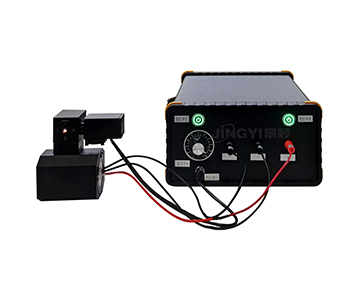
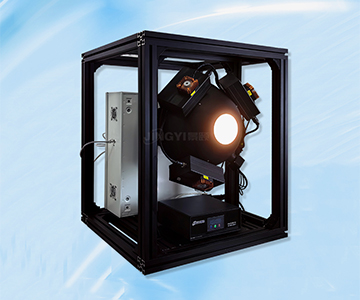
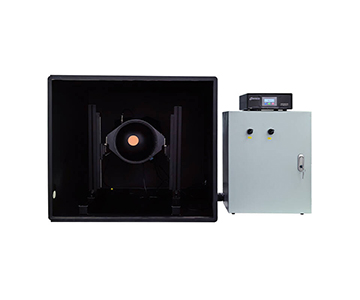
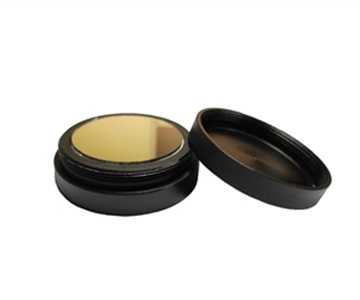
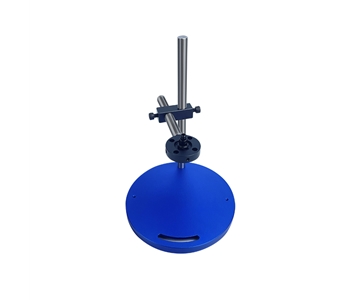
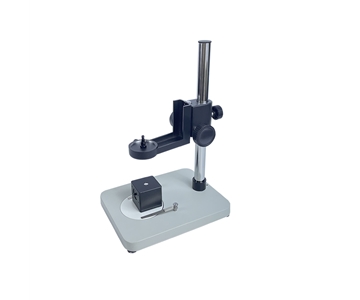
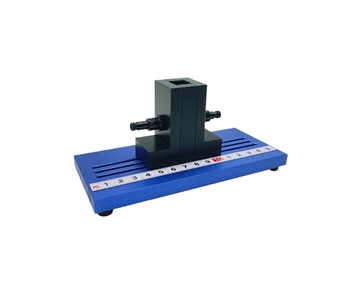
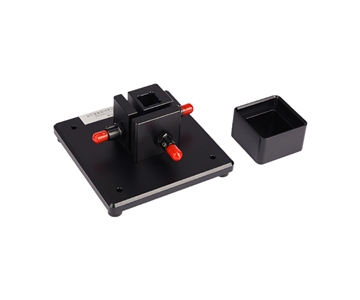
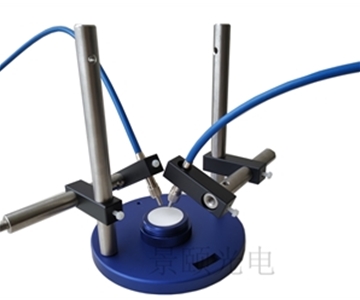
At a pilot line for quantum dot solutions, an engineer placed samples in a quartz cuvette inside a basic system. Magnetic positioning fixtures ensured consistent placement, and the software automatically ran blank-substrate and sample spectra. Within 20 minutes, absolute quantum yield and emission peak data were available.
When scanning excitation power from low to high, an inflection point in the quantum yield curve indicates concentration quenching or thermal quenching. In one case, this insight led the formulation team to reduce dopant concentration by 0.8%, directly improving batch consistency.
Application 2: Electroluminescence Characterization for New Displays
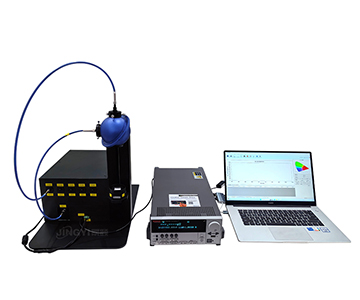
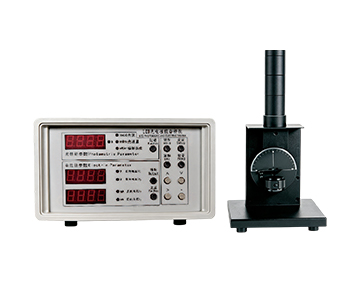
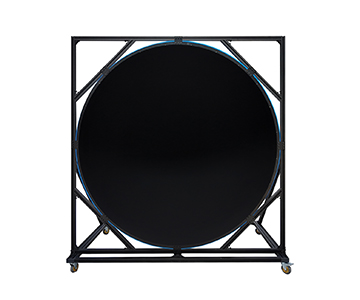
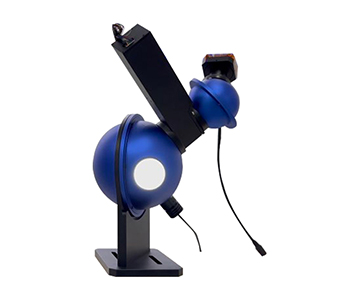
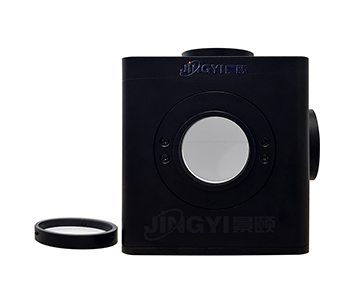
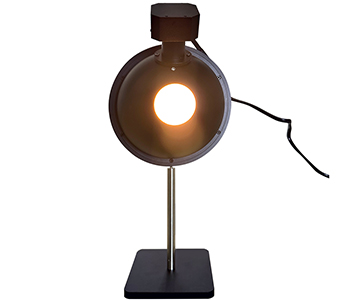
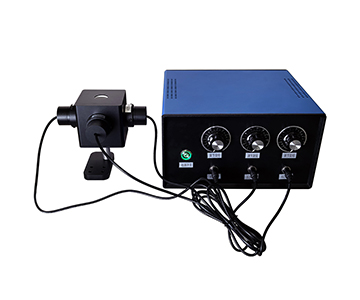
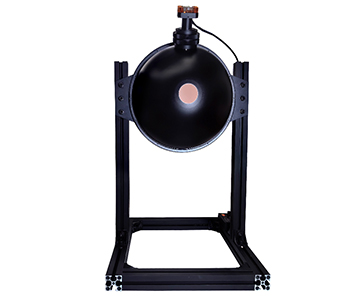
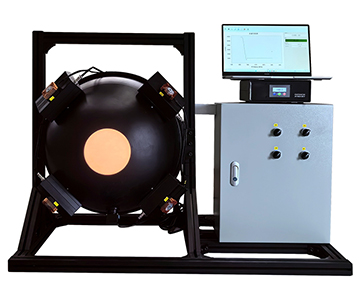
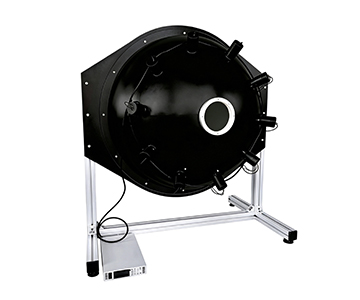
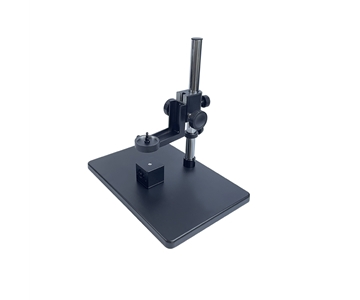
A display laboratory working on OLED stacked structures used a large-aperture electroluminescence setup paired with a precision source meter to generate quantum efficiency versus current density curves. Low-brightness irregular samples were measured via probe station with a small integrating sphere, while high-brightness devices used the 3.3-inch sphere.
The resulting curves revealed that efficiency dropped after a specific current density threshold—a physical signal of rising non-radiative recombination. Identifying this trend occurred an entire design iteration earlier than simply evaluating "screen brightness."
Three Common Misconceptions
Misconception 1: "High Brightness Equals High Quantum Yield"
Brightness is the perceived magnitude of radiant flux; quantum yield is the energy conversion ratio. Strong fluorescence can result from high concentration or excessive excitation power, but non-radiative losses may be increasing simultaneously. Brightness measures "volume," while quantum yield measures "conversion efficiency"—the two cannot substitute for each other.
Misconception 2: "Relative Methods Are Simpler, So Use Relative Methods"
Relative methods require standard materials with known quantum yields and demand matching solvents and absorbance. Standard materials carry their own uncertainties; aging or refractive index mismatches directly contaminate results. Absolute methods demand higher integrating sphere uniformity and detector linearity but eliminate external standards, creating a shorter traceability chain.
Misconception 3: "Wider Spectral Range Is Always Better—Buy the Widest"
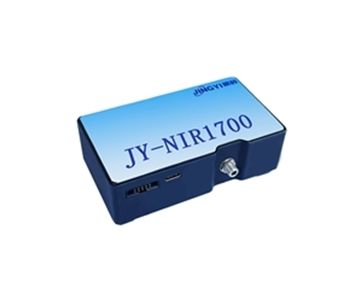
Extending into the near-infrared (up to 1700 nm) covers second-window fluorescence, but not all materials require it. Extended ranges require different detectors and independent calibration curves, increasing cost and complexity. Select bandwidth based on the sample's emission peak: 350–1100 nm covers most visible fluorescence, while 900–1700 nm should be reserved for near-infrared materials to avoid paying for unused bandwidth.
What Determines Data Credibility: The Photometric Accuracy Chain
Photometric accuracy is not a single parameter—it is a chain of dependencies.
The first link is the excitation end: if an adjustable LED or laser drifts, the denominator of absorbed photons shifts, invalidating everything downstream. The second link is the integrating sphere: PTFE coating uniformity determines whether fluorescence from all directions is collected equally, and coating aging or contamination systematically lowers readings. The third link is spectrometer linearity: 16-bit quantization and high dynamic range prevent signal clipping or loss of low-level data. The fourth link is the algorithm: photon-number conversion must account for wavelength-dependent energy, not simply divide raw power spectra.
When samples exhibit strong self-absorption or re-scattering, absolute methods still require correction models. At that point, the bottleneck in photometric accuracy shifts from hardware to the completeness of the correction model. During system selection, asking "How do you handle re-absorption correction?" reveals more about a system's true capabilities than asking "What is the resolution?"
Honest Limitations and Boundaries
Mainstream systems have improved significantly, but physical boundaries remain.
First, near-infrared extension is not a free upgrade. Covering 900–1700 nm requires dedicated detectors and separate calibration curves; if a sample's emission peak lies in the visible range, the extended bandwidth becomes an expensive unused option. Second, absolute methods are sensitive to integrating sphere coating condition. PTFE coatings experience gradual aging over time, making periodic recalibration with traceable light sources unavoidable—not a "buy once, use forever" proposition. Third, electroluminescence measurements depend heavily on device packaging and source meter accuracy; probe contact resistance in low-brightness irregular samples can silently distort efficiency curves.
These are not defects but physical realities. Acknowledging these boundaries ensures the equipment is deployed where it delivers genuine value.
Frequently Asked Questions
Q1: Can powder samples be measured directly without dissolution?
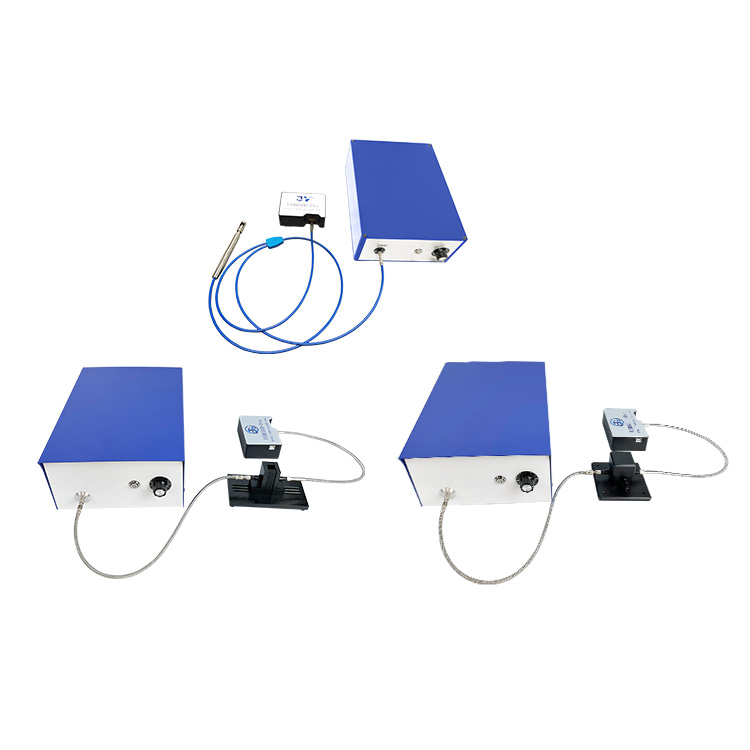
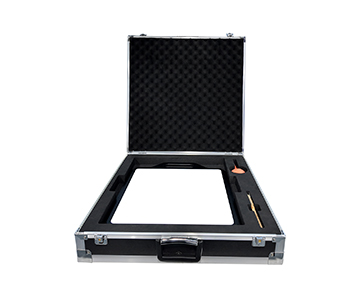
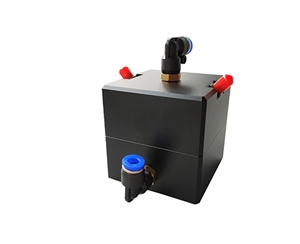
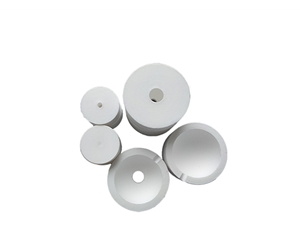
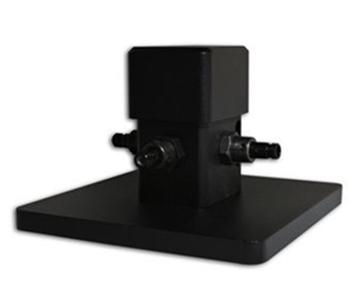
Yes. Systems support dedicated sample holders for solids, liquids, and powders, eliminating the need to dissolve powders. The critical factor is consistent placement; magnetic or positioning fixtures are specifically designed to minimize human-induced variation.
Q2: What is the difference between quantum efficiency and brightness?
Brightness is a perceptual quantity—how bright something appears. Quantum efficiency is an energy ledger—the ratio of emitted photons to absorbed photons. R&D teams should prioritize the latter, as it reveals the underlying conversion physics rather than just surface-level radiance.
Q3: Why do my quantum yield measurements drift between morning and afternoon?
First, rule out excitation source drift and integrating sphere contamination rather than blaming the sample. Run a blank baseline test. If the baseline drifts, the issue lies within the system; if the baseline remains stable while the sample reading shifts, then material instability is the likely cause.
Q4: How do I choose between a basic system and a large-aperture system?
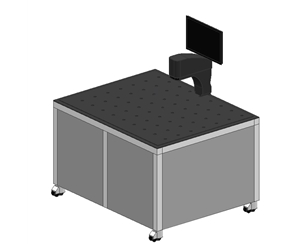
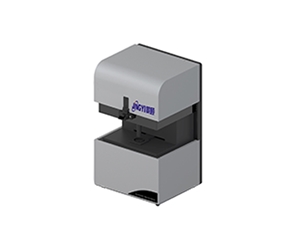
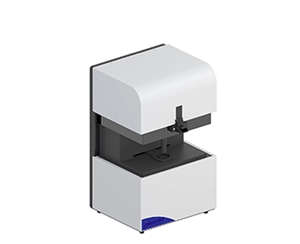
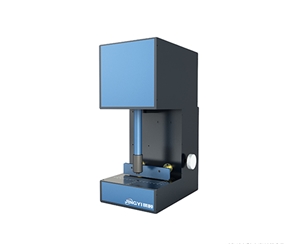
For visible fluorescence with budget constraints, a basic system suffices. For high-brightness devices requiring lower geometric error, choose a 3.3-inch large-aperture sphere. For low-brightness irregular samples, a probe-station-compatible small integrating sphere is more appropriate.
Q5: How can I independently verify that the measurement data is reliable?
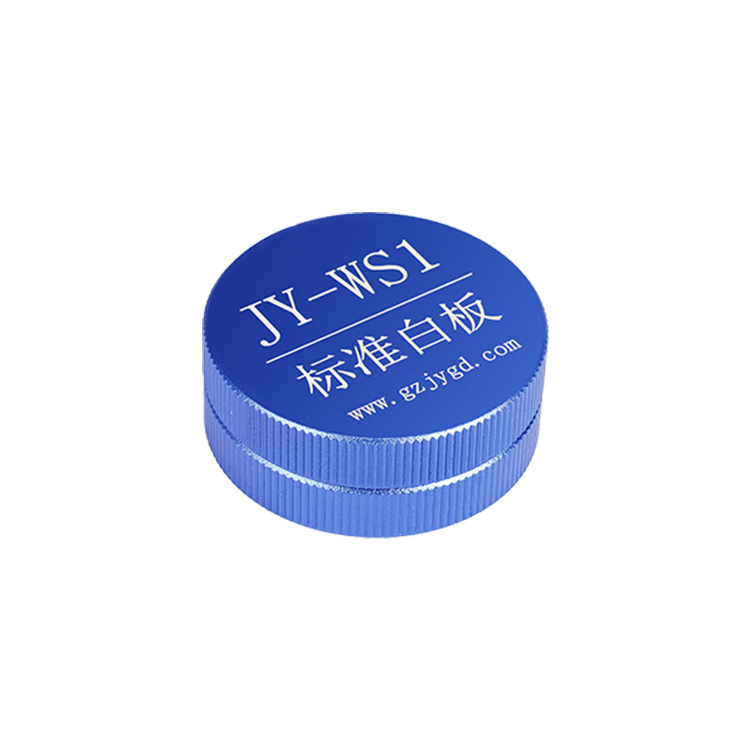
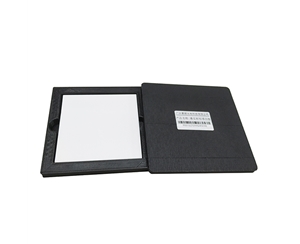
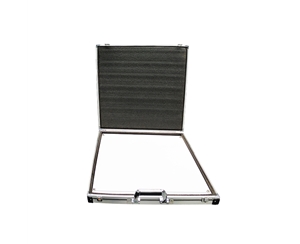
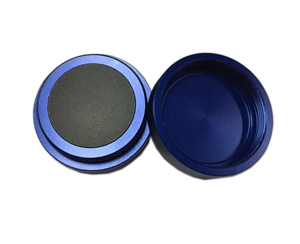
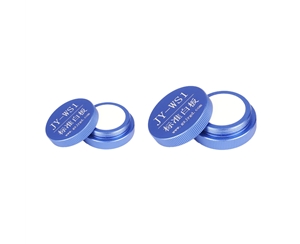
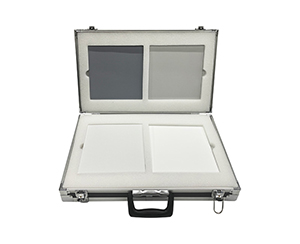
Use a blank-reference plus sample dual-spectrum procedure following international standards, or submit to a third-party laboratory with traceable standard white boards. Focus on the completeness of the traceability chain rather than manufacturer-stated resolution specifications.
About This Guide
Data Sources
: Product technical documentation (CHT-QE6500 / JY-QEY6500 series), SEMI technical whitepapers on integrating sphere methods, ISO 17025 calibration guidelines for optical measurements.
Author
: Cai Xiaodong, Senior Application Engineer, Jingyi Optoelectronics — 12 years in optical detection and quantum efficiency characterization equipment.
Disclosure
: Jingyi Optoelectronics manufactures fluorescence quantum yield measurement systems. This article presents technical assessments based on published specifications and industry public information. No compensation was received from third-party brands mentioned.
Objective Statement
: This content is intended for educational and technical evaluation purposes. Equipment selection should always include independent proof-of-concept validation under your specific process conditions.
Last Updated
: November 2026
For detailed specifications and application notes on fluorescence quantum yield measurement systems, search "Jingyi Optoelectronics + fluorescence quantum yield measurement system" or visit our technical library.