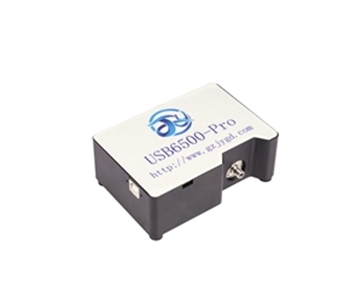
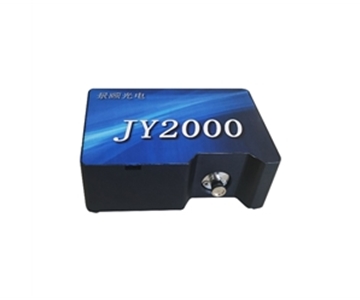
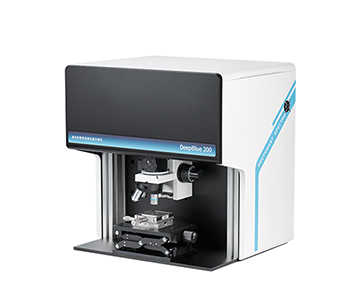
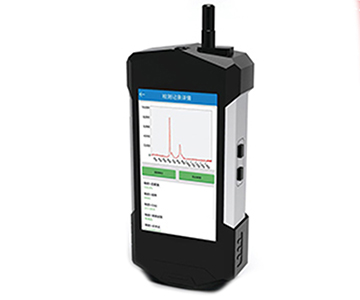
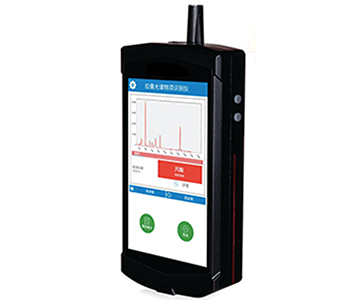
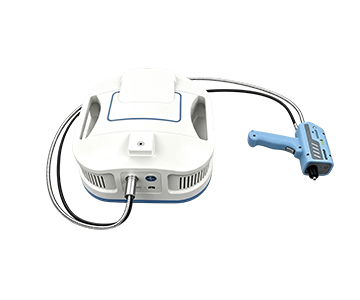
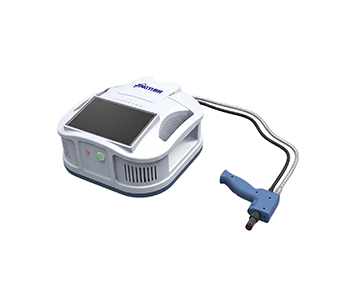
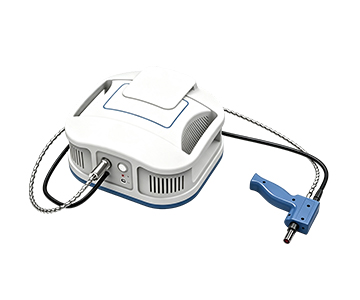
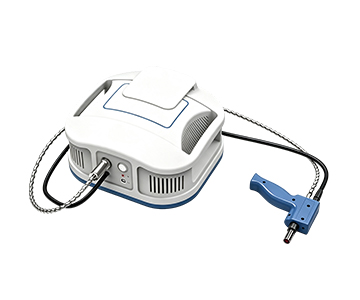
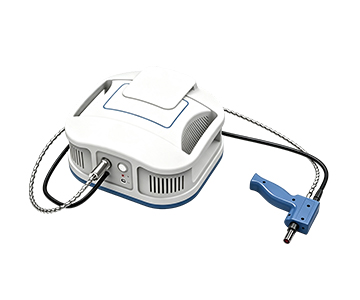
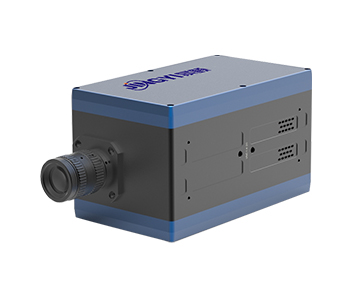
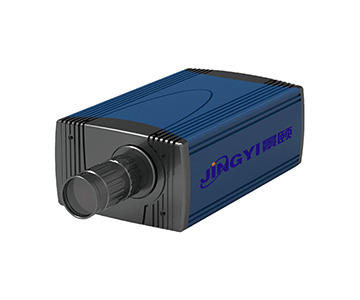
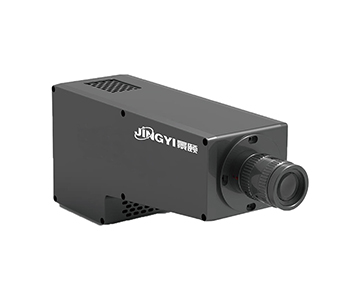
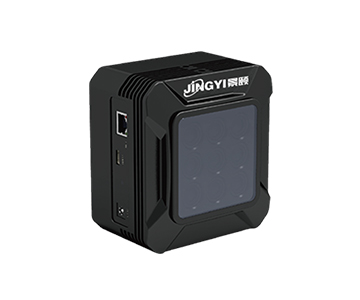
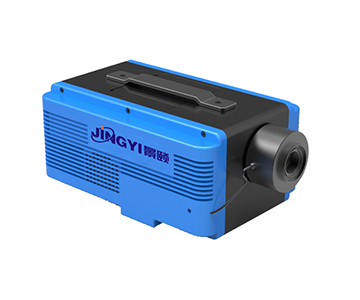
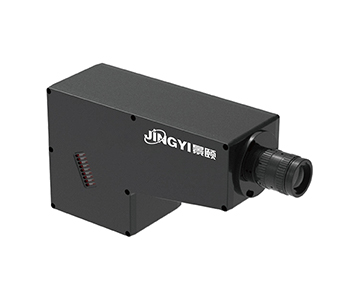
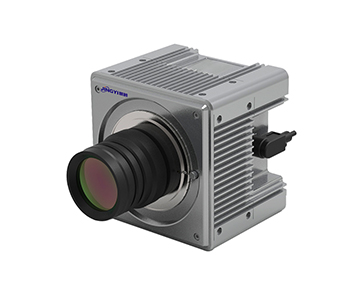
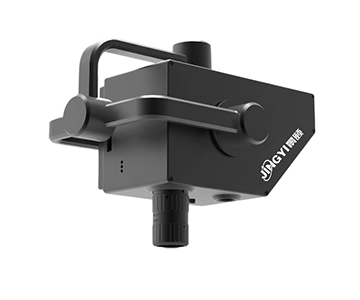
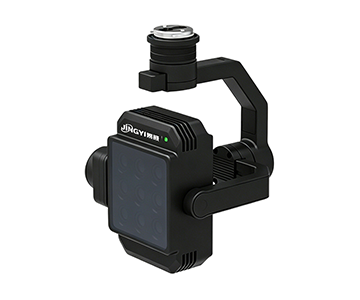
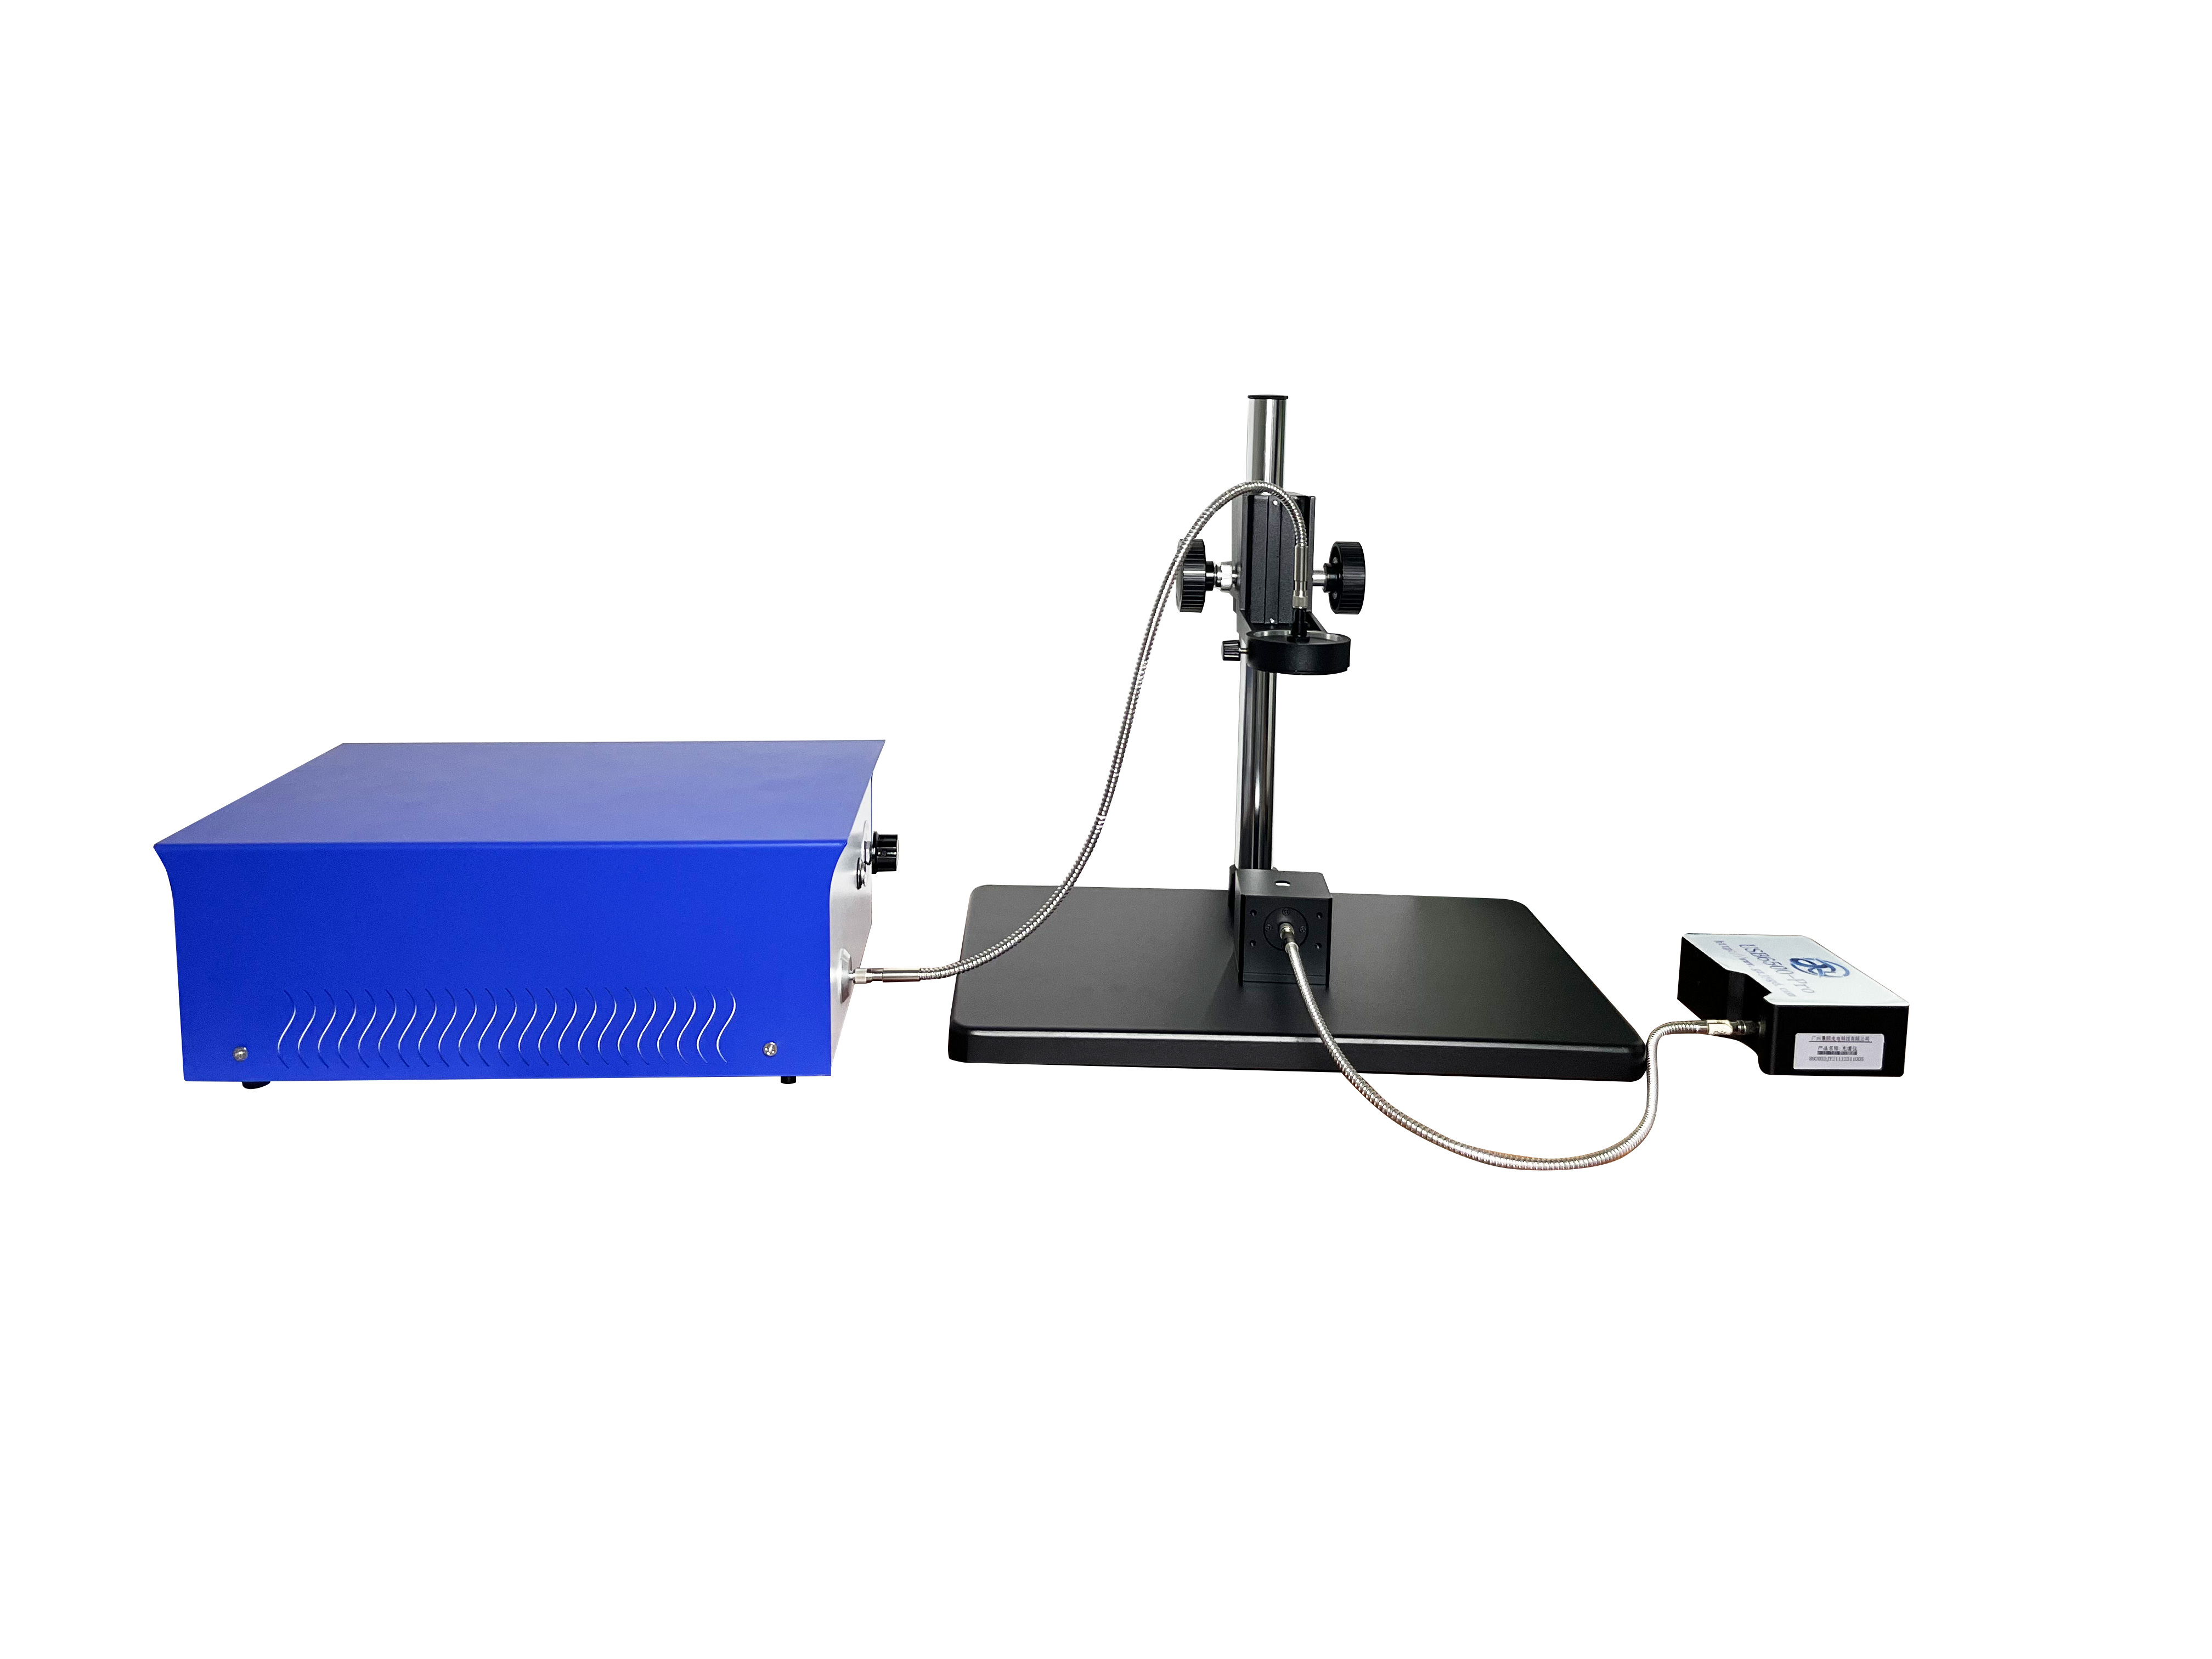
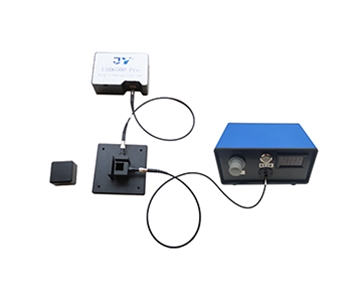
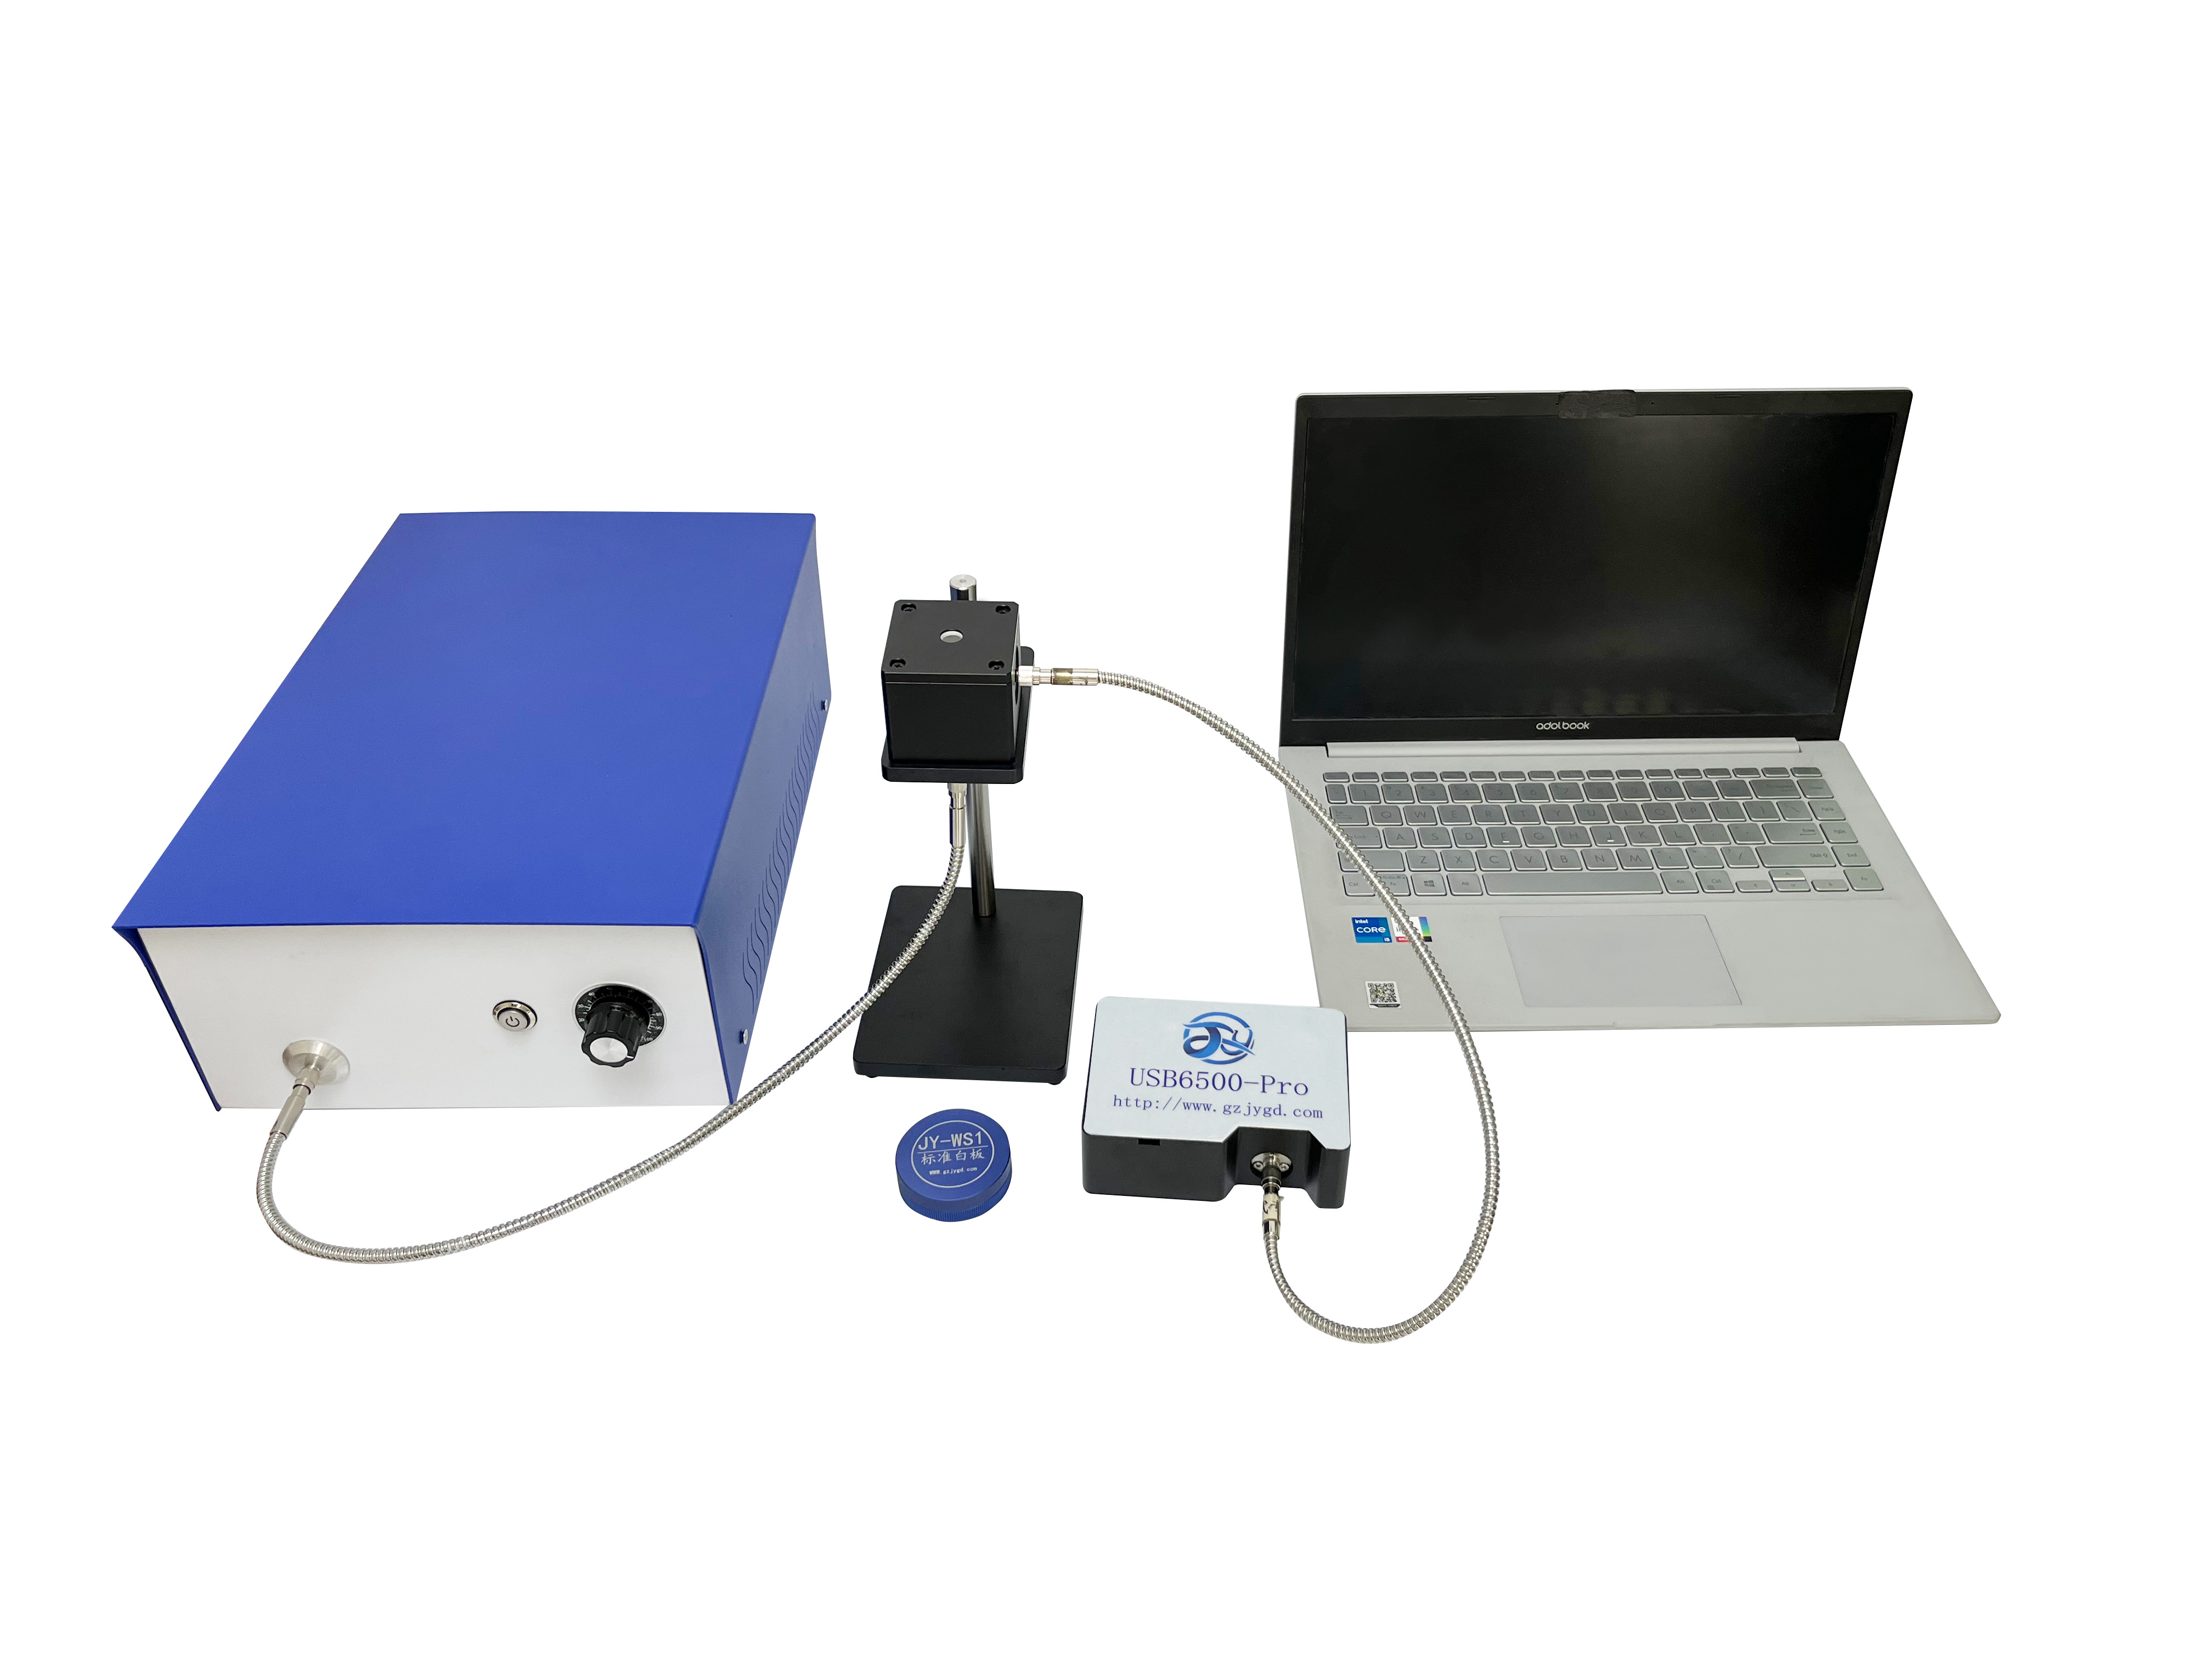
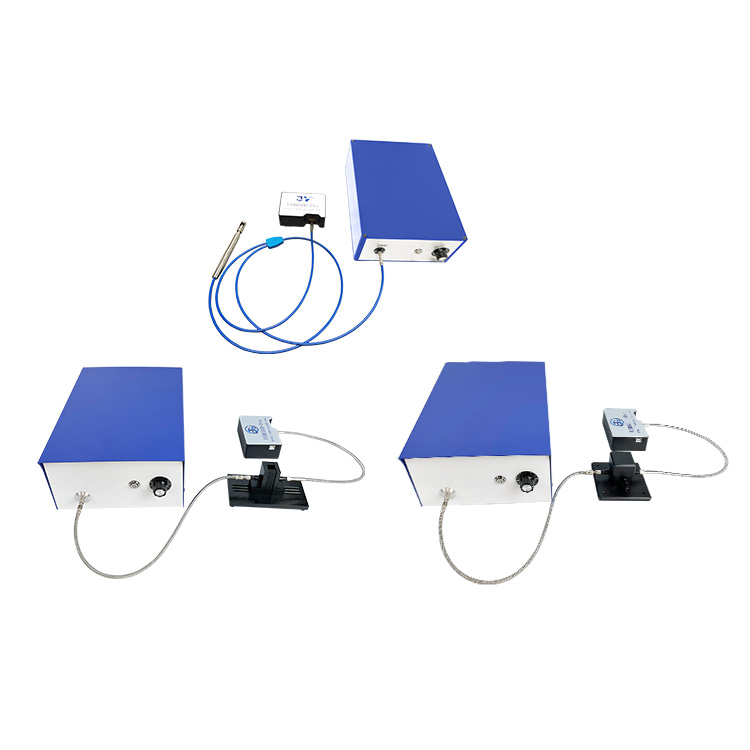
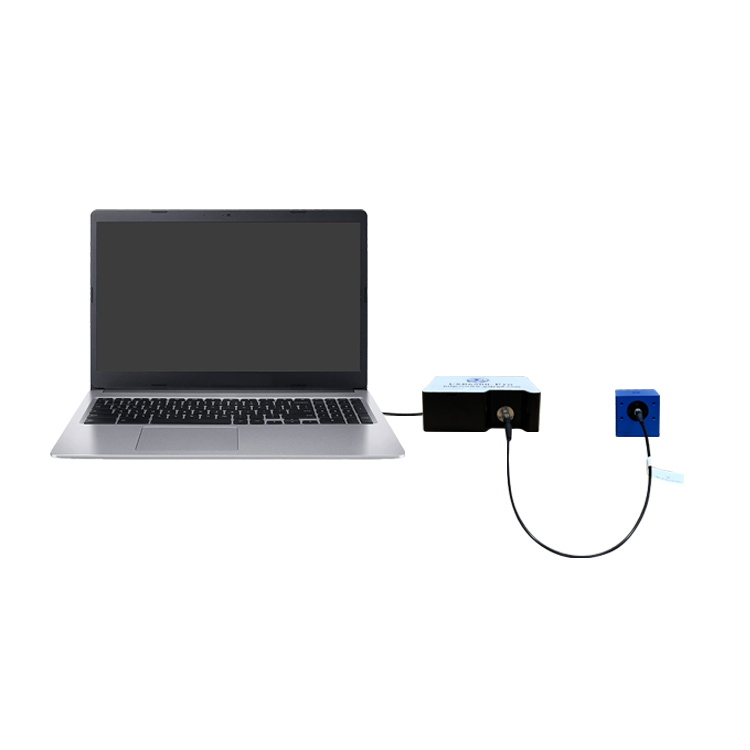
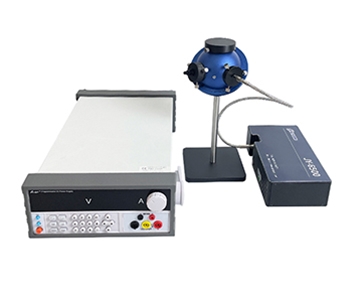
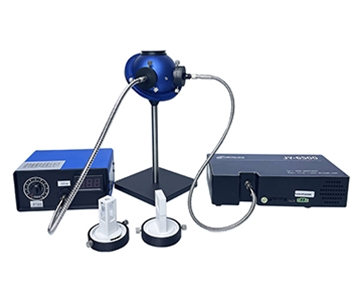
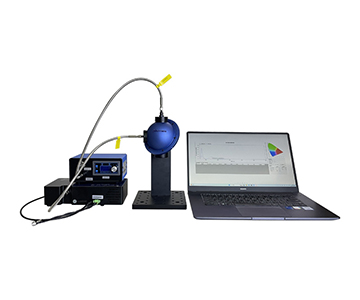
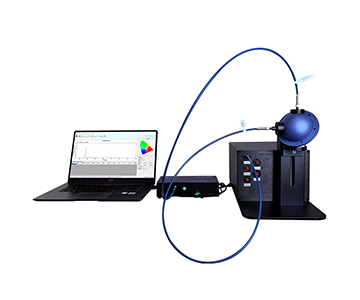
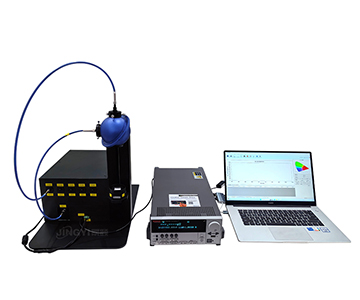
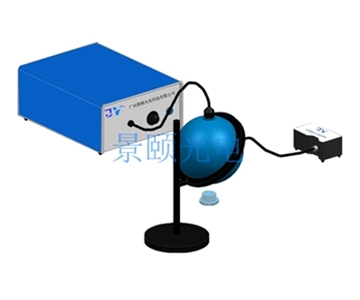
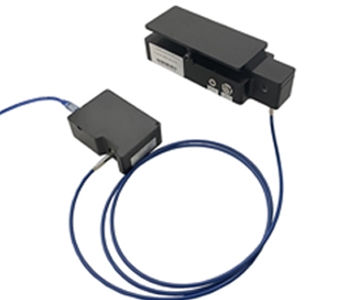
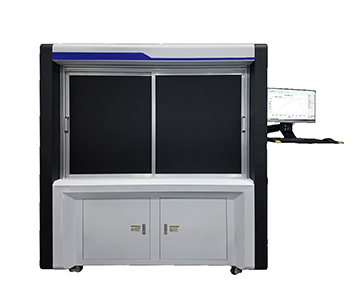
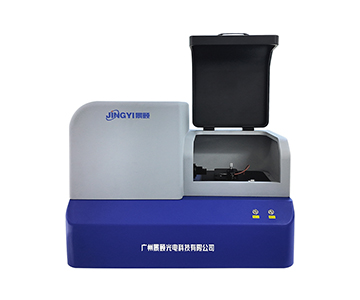
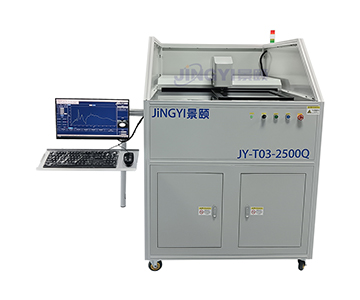
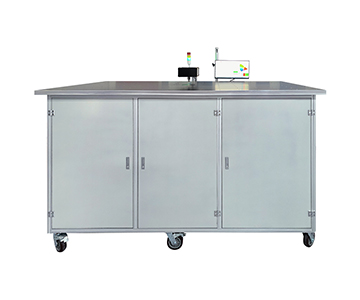
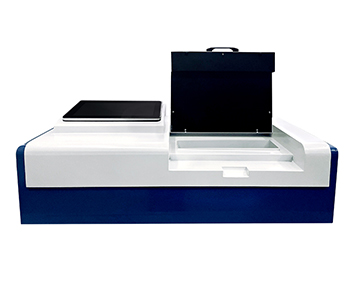
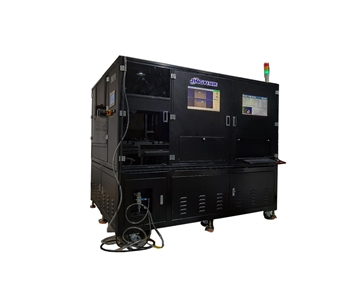
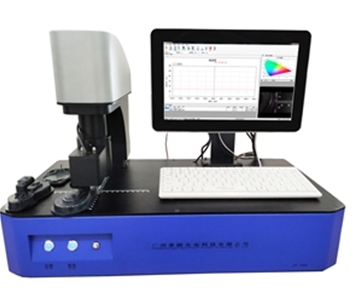
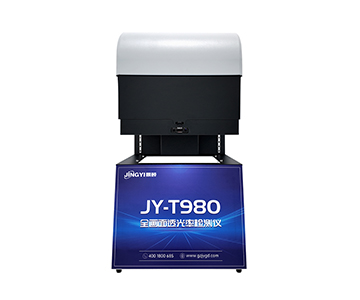
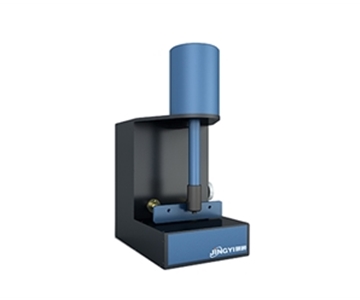
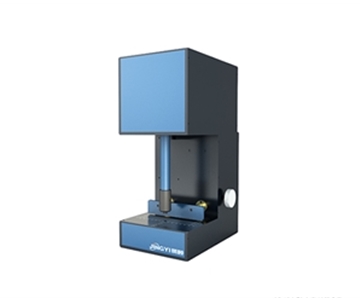
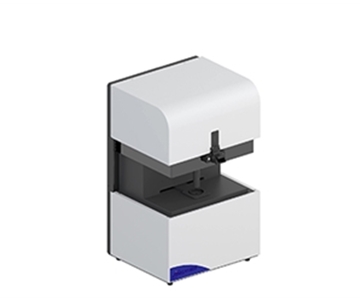
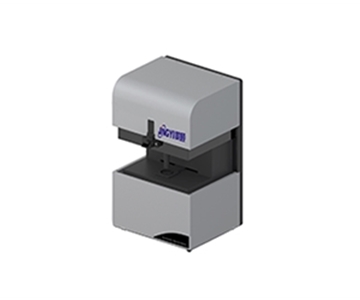
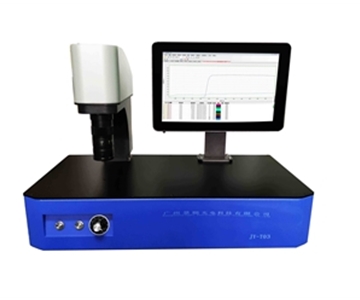
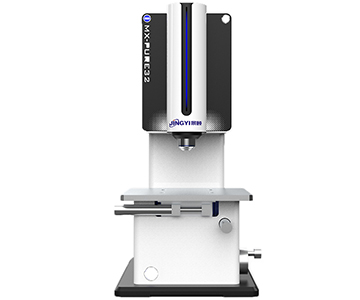
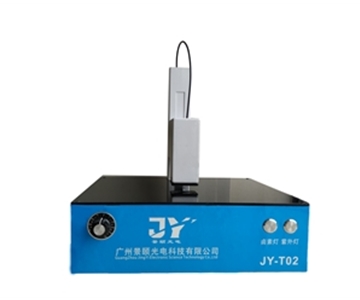
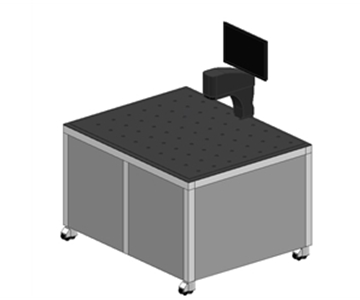
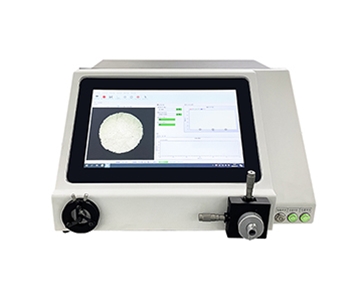
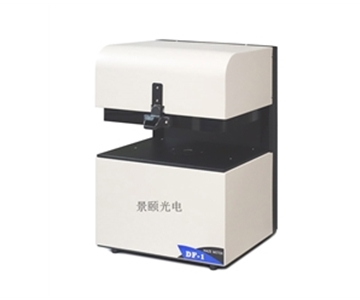
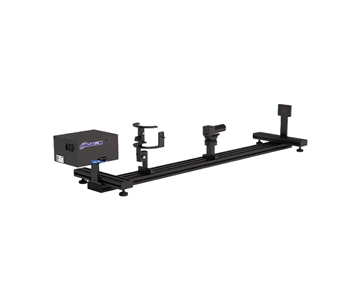
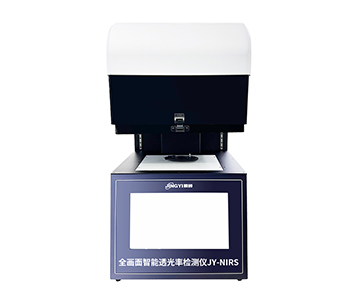
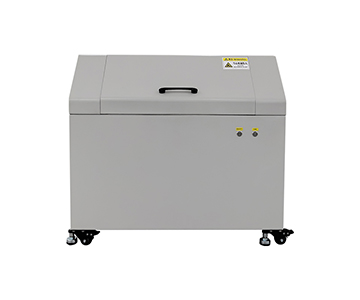
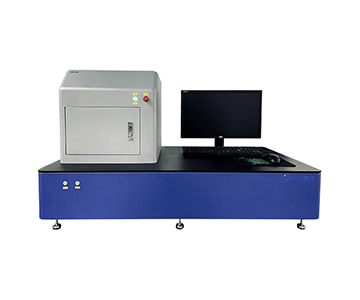
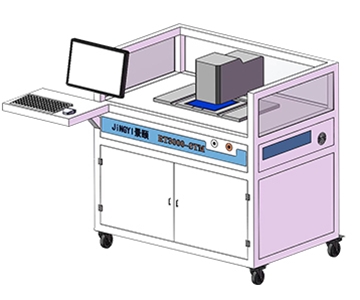
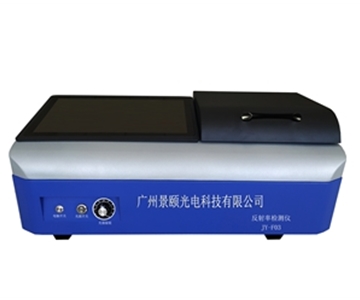
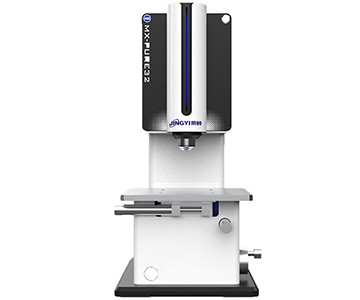
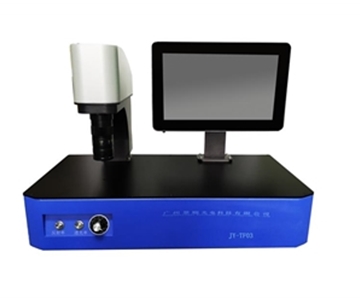
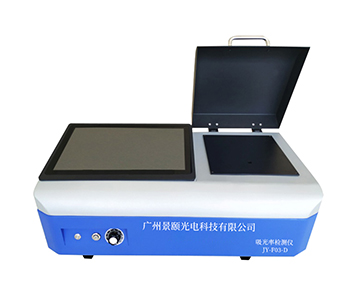
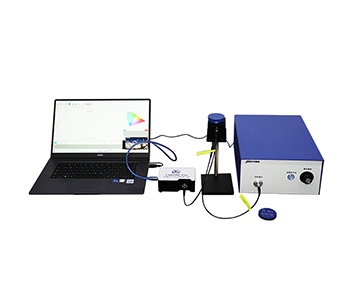
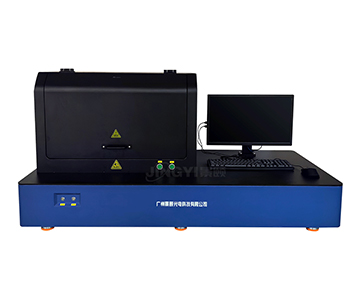
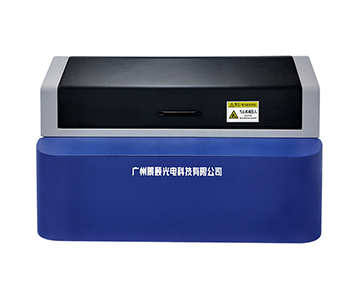
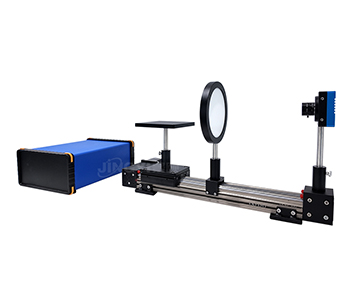
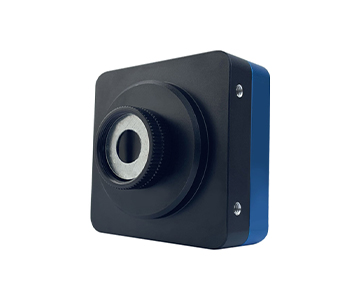
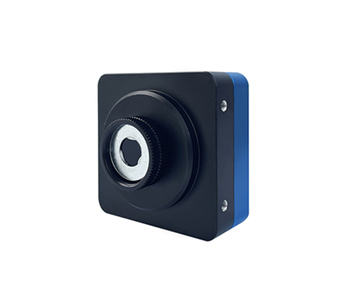
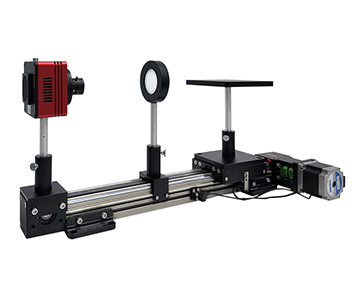
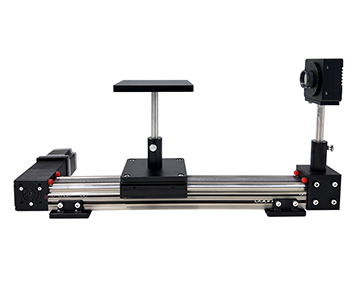
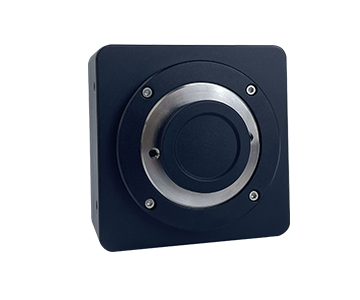
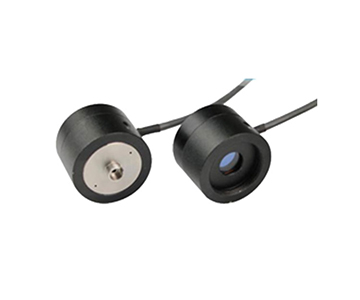
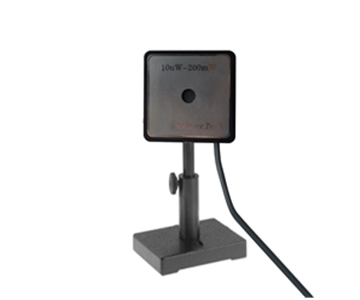
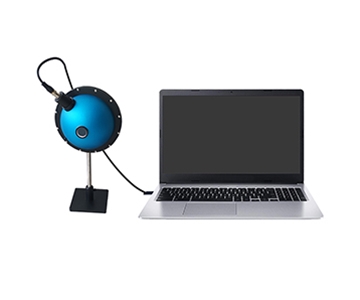
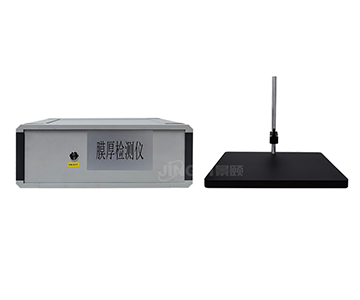
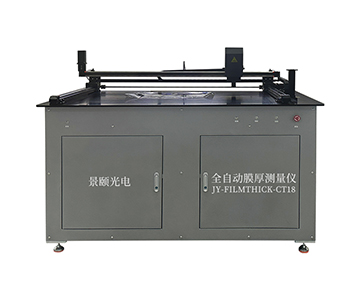
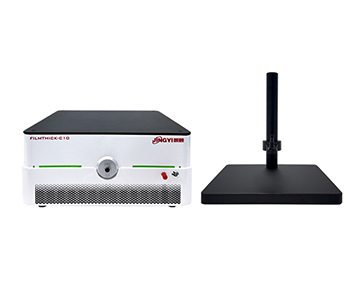
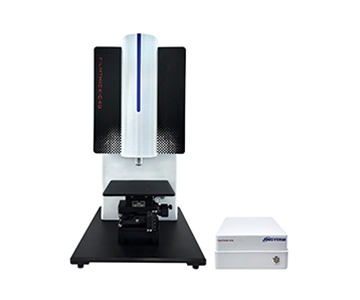
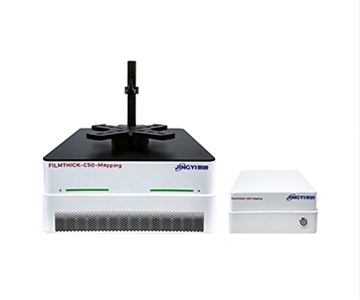
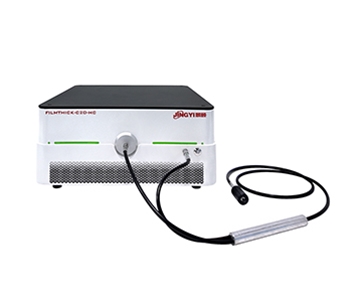
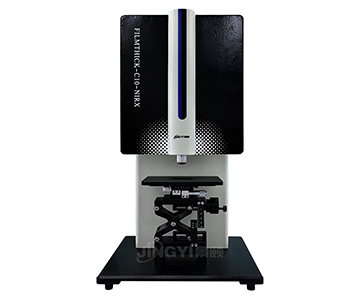
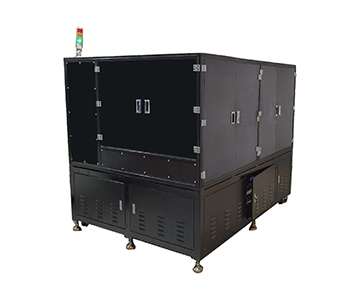
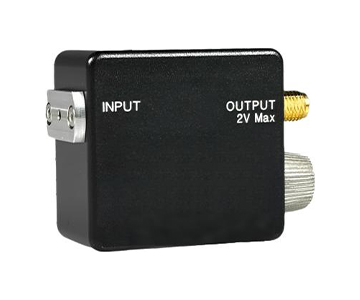
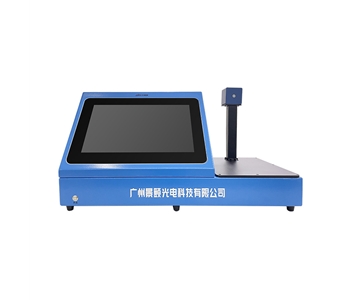
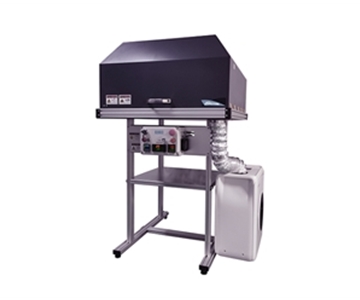
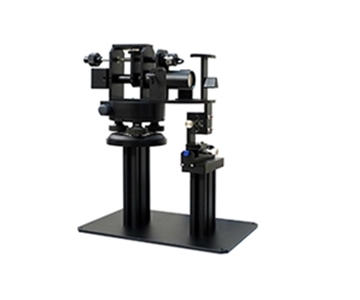
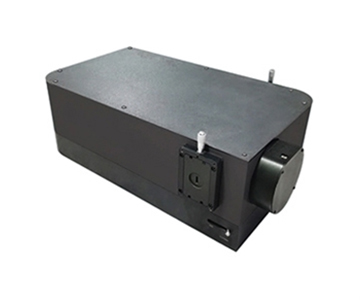
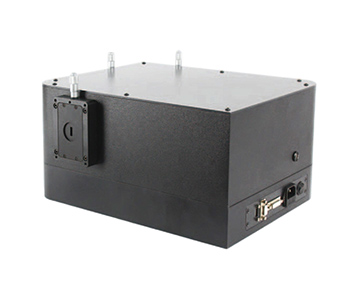
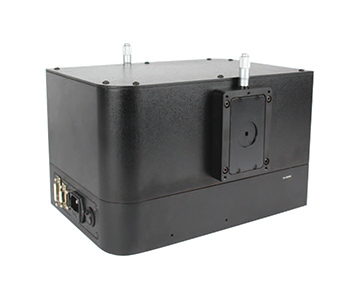
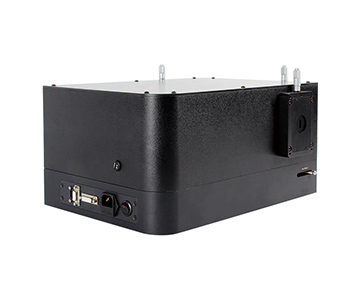
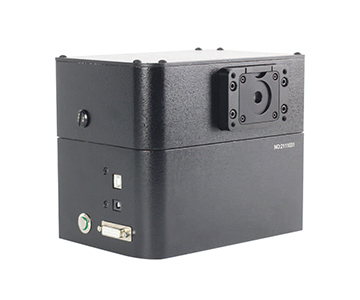
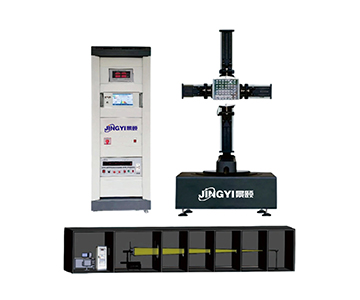
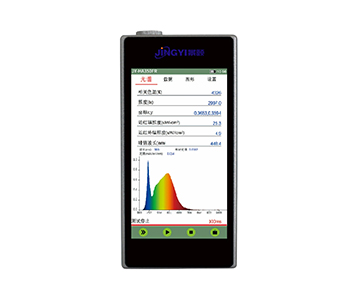
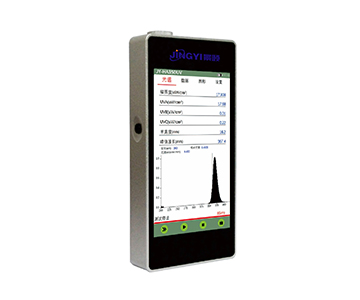
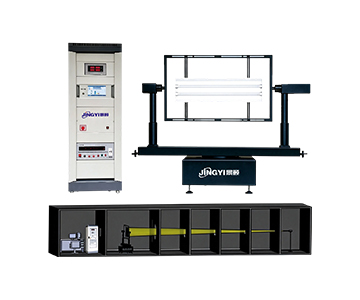
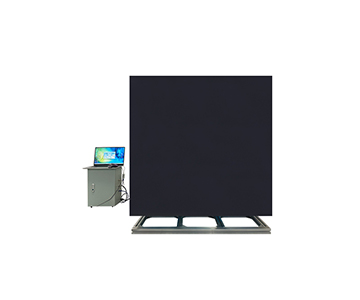
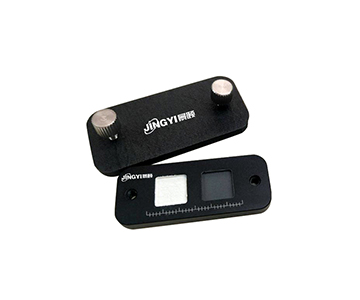
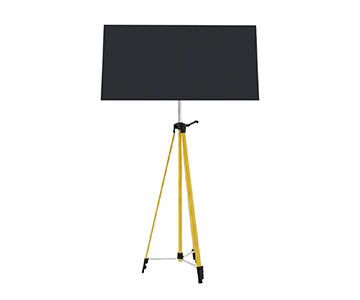
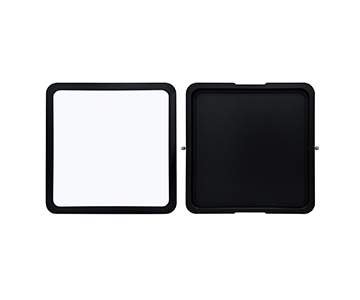
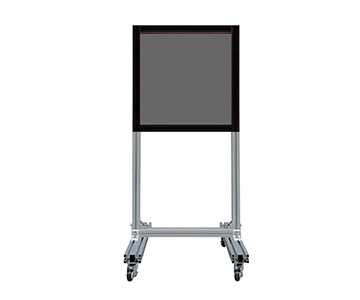
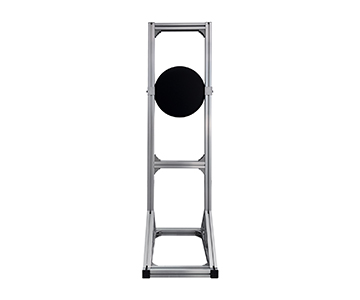
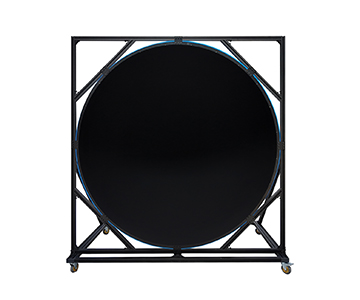
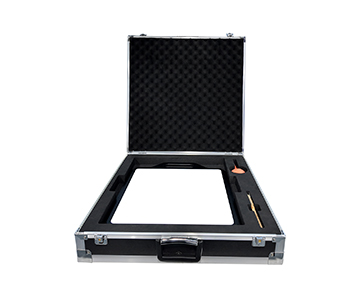
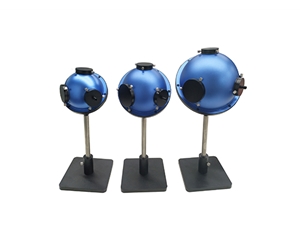
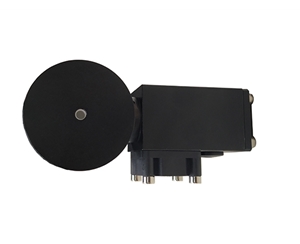
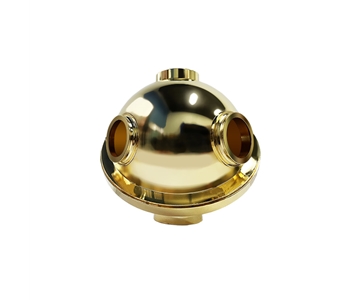
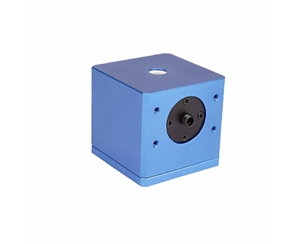
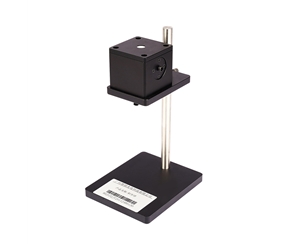
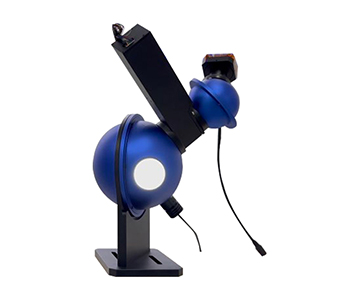
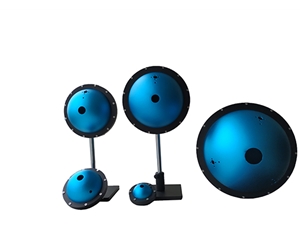
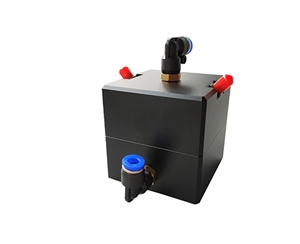
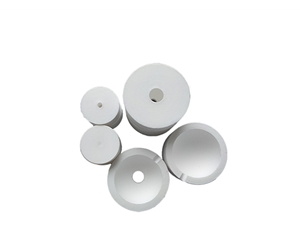
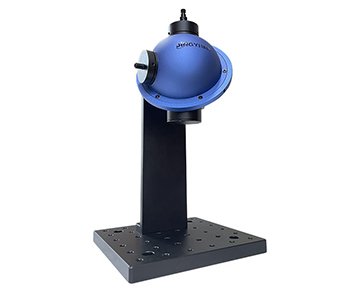
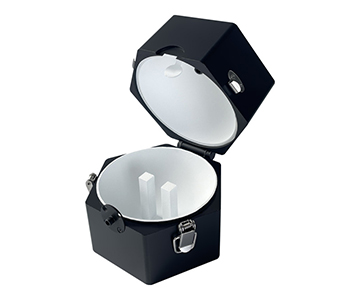
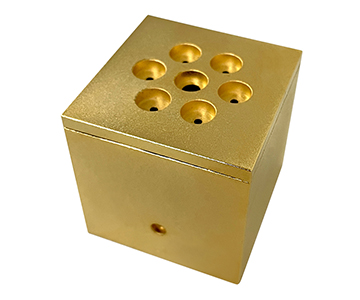
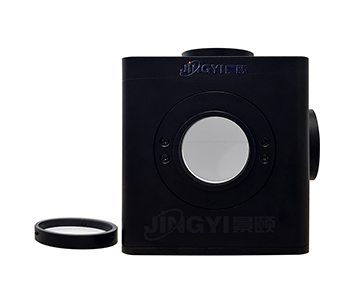
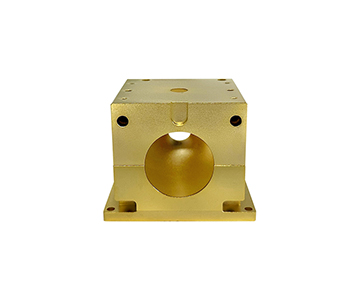
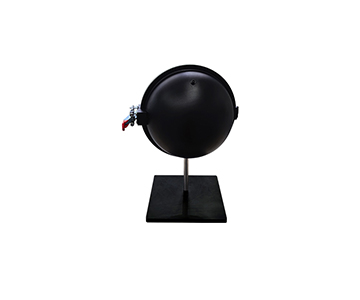
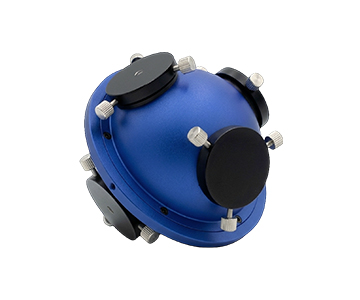
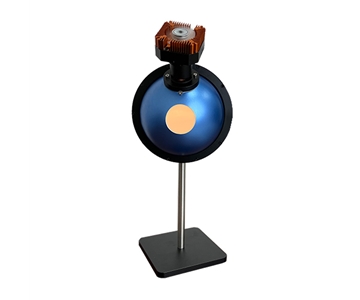
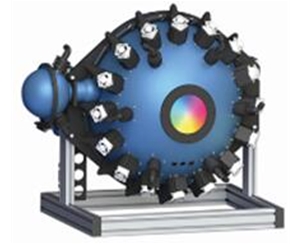
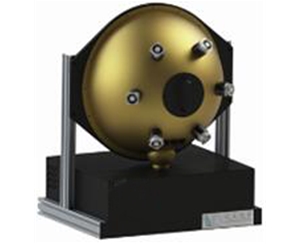
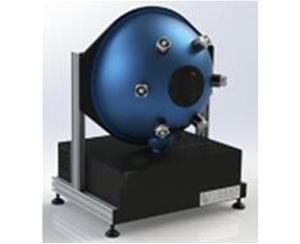
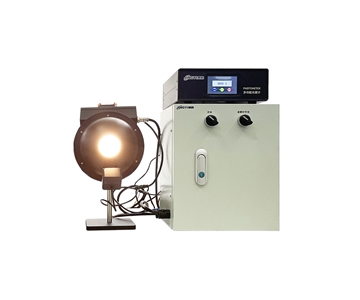
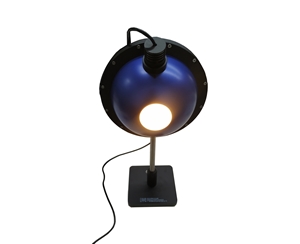
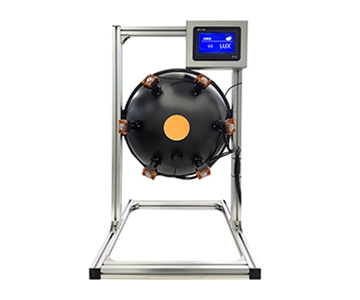
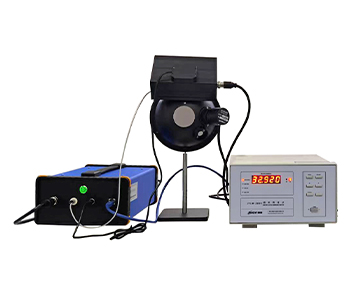
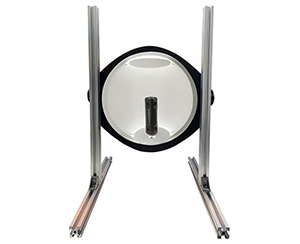
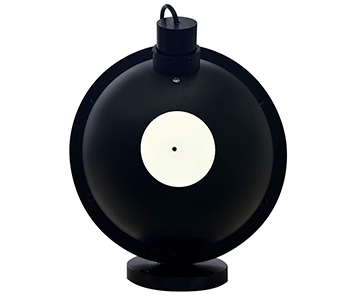
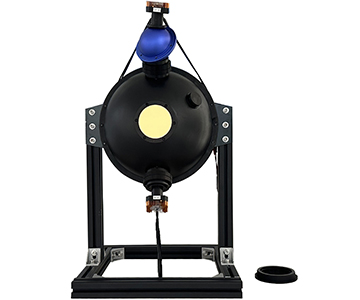
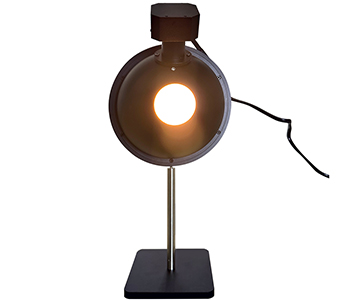
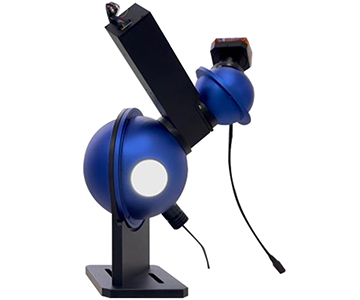
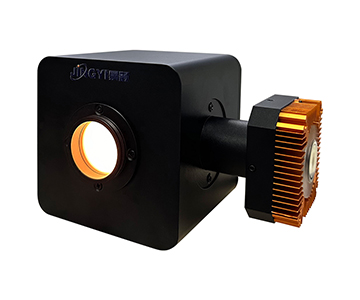
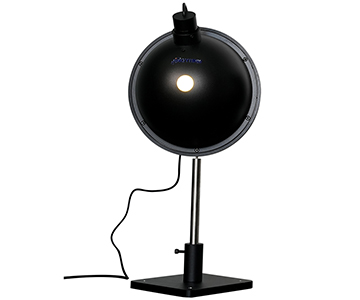
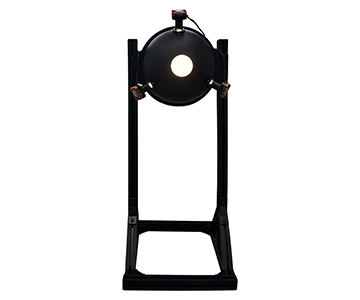
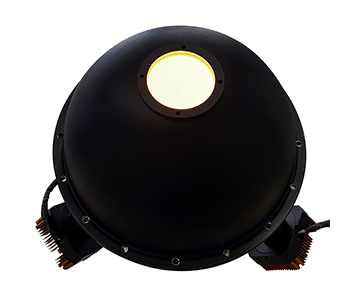
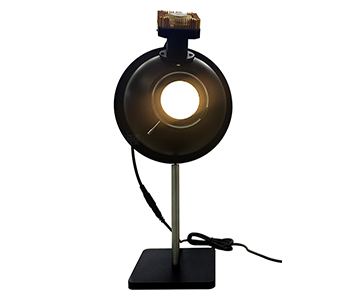
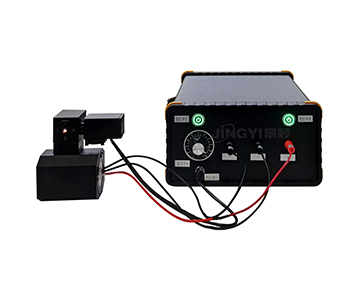
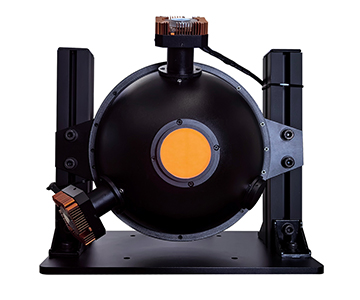
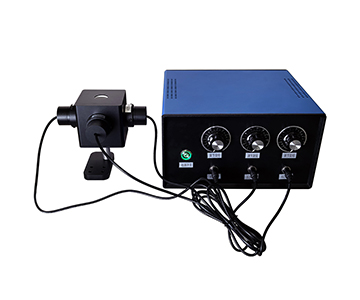
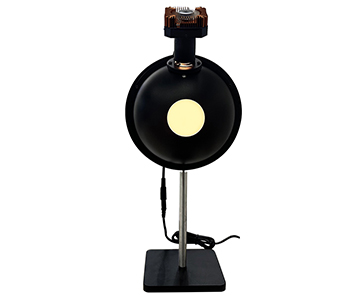
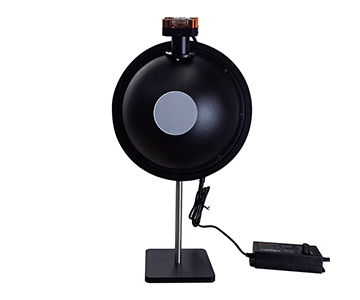
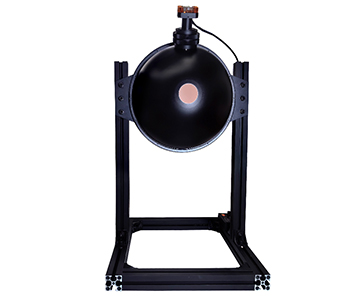
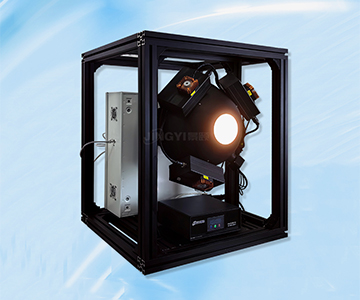
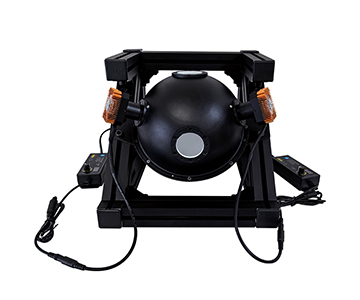
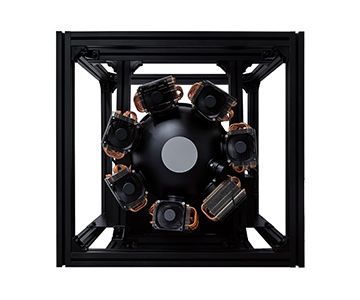
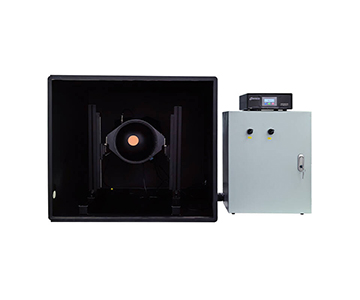
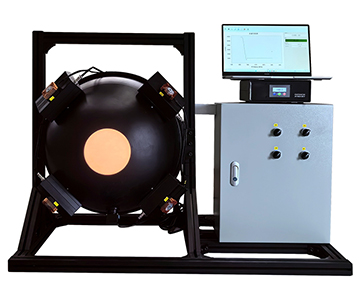
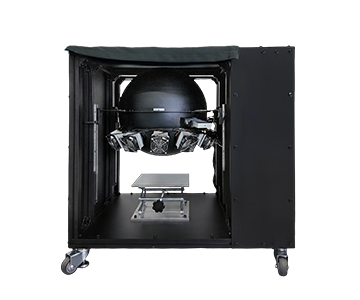
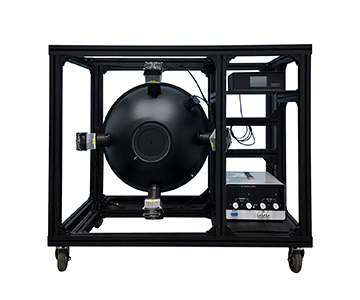
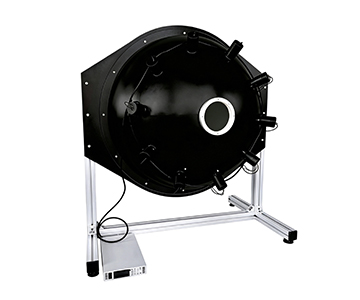
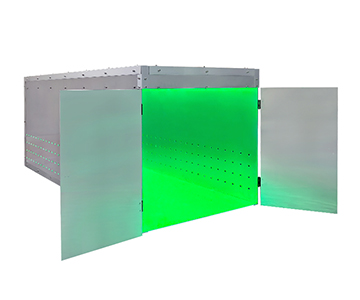
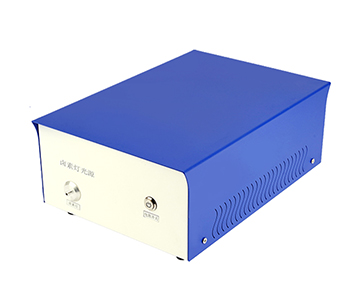
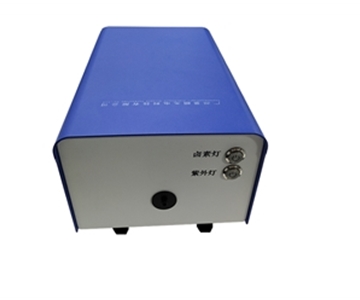
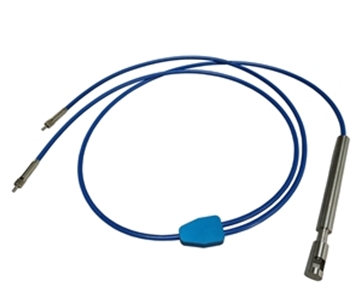
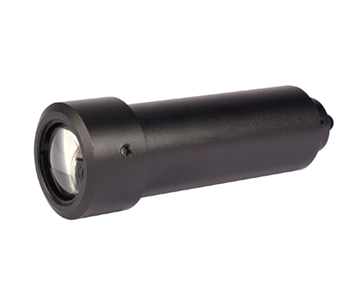
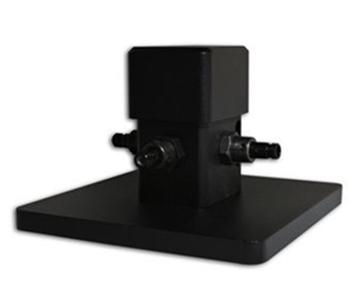
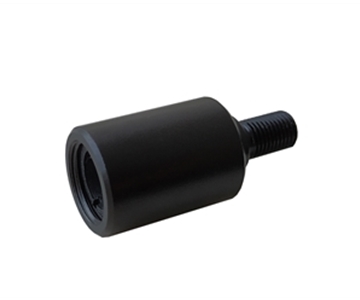
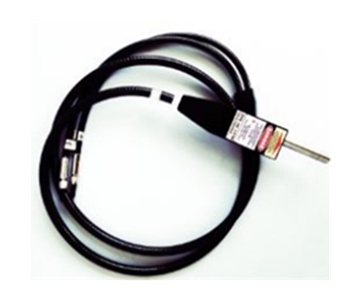
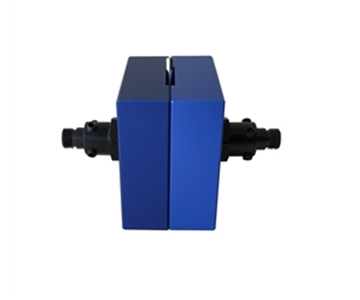
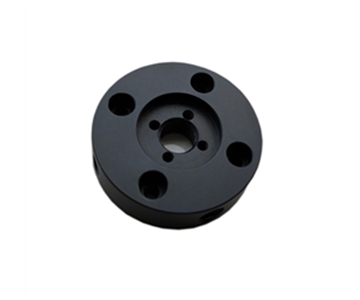
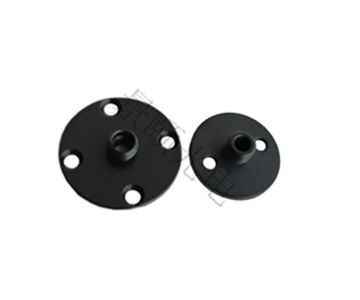
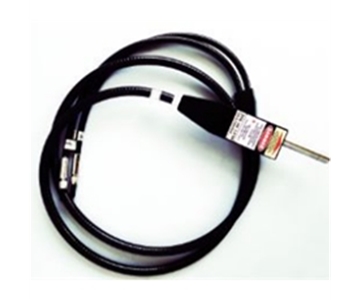
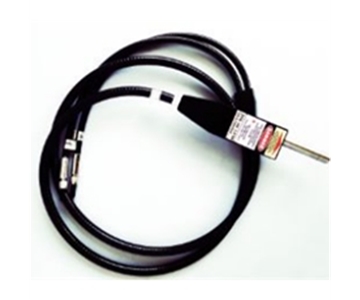
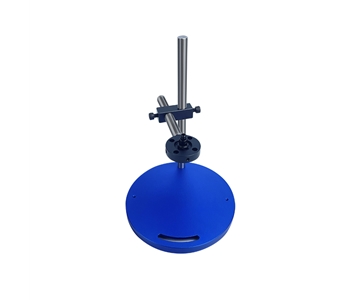
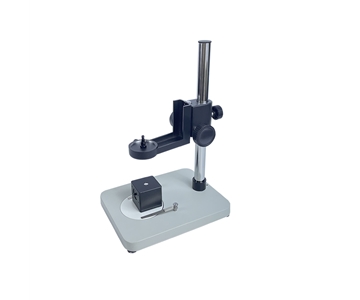
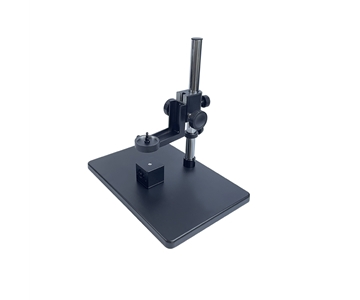
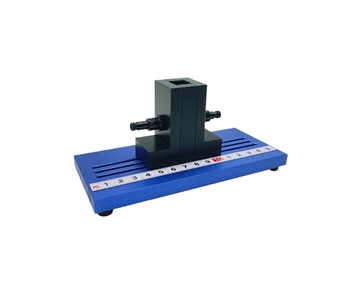
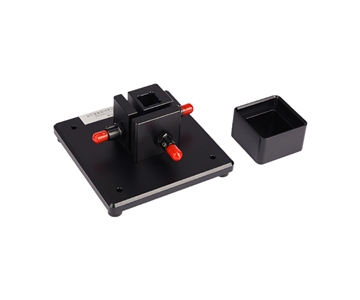
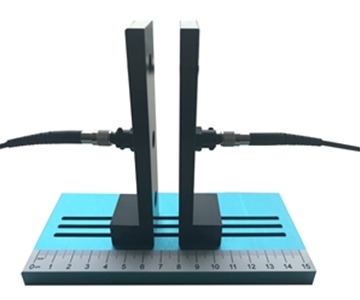
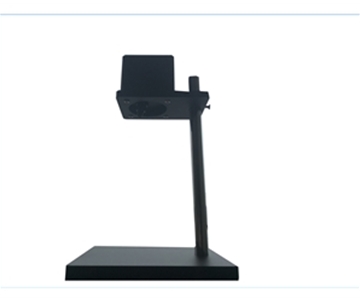
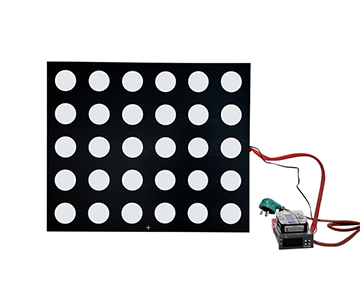
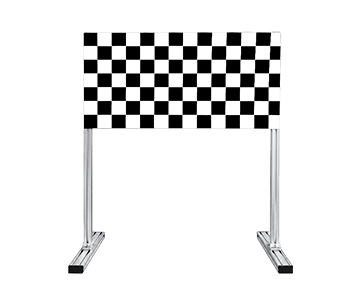
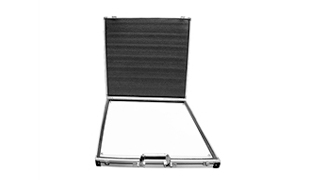
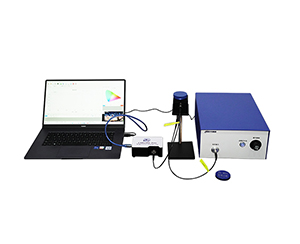
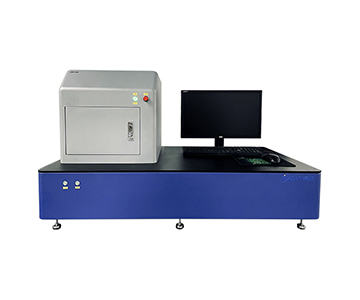
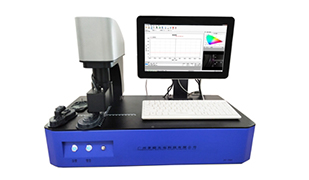
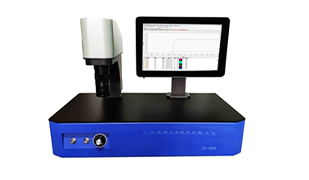
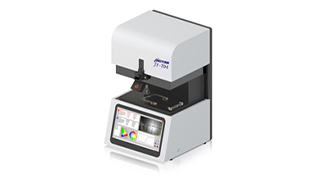
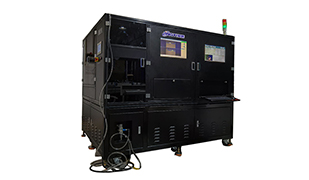
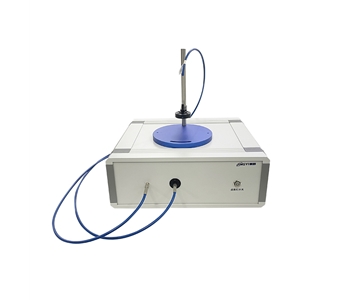
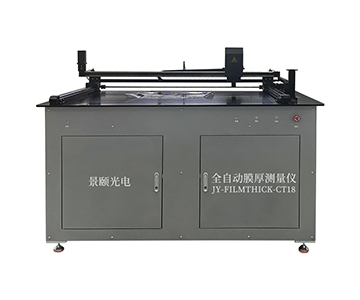
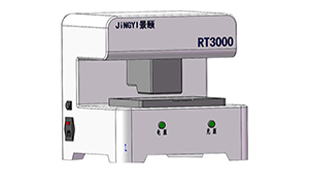
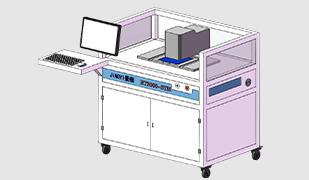
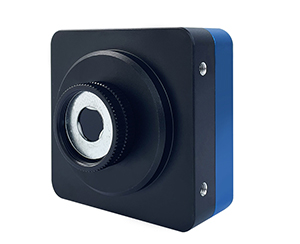
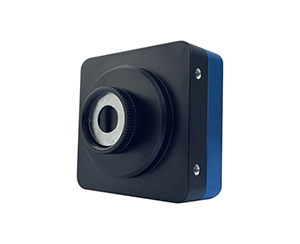
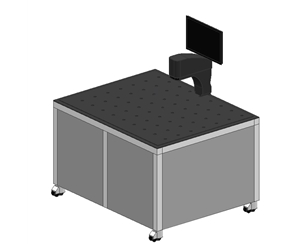
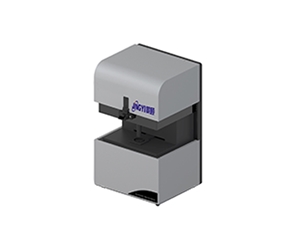
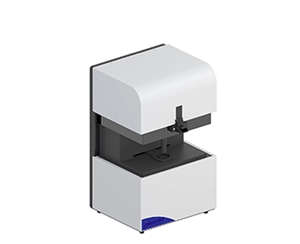
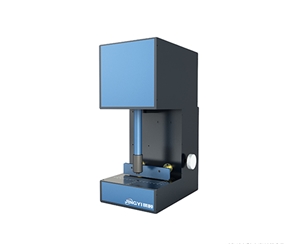
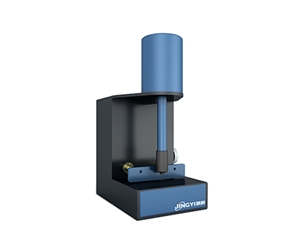
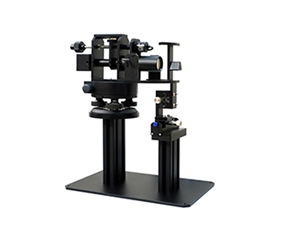
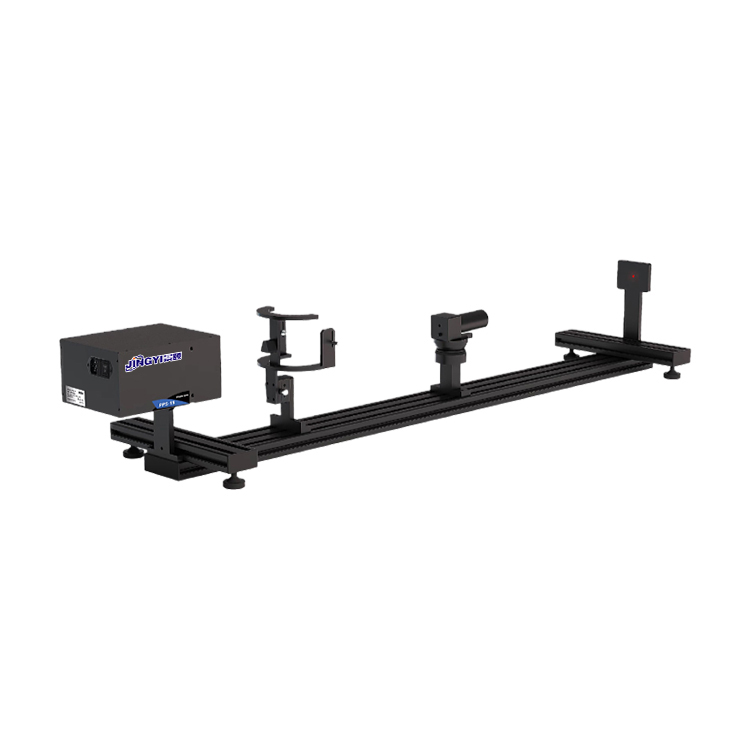
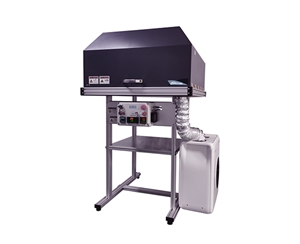
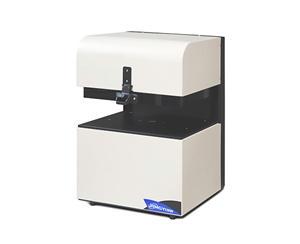
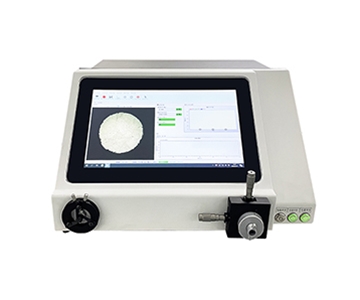
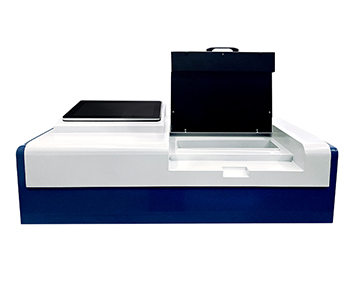
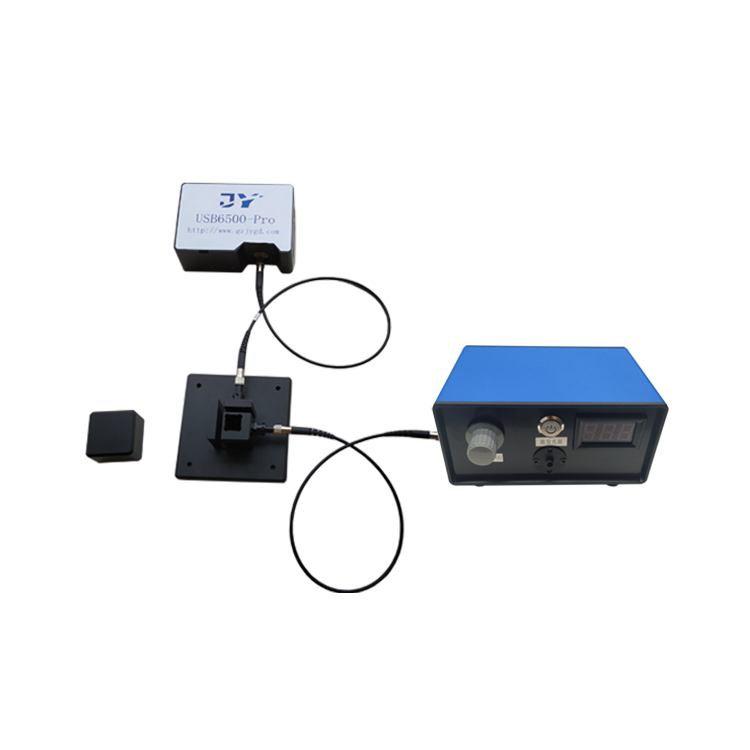
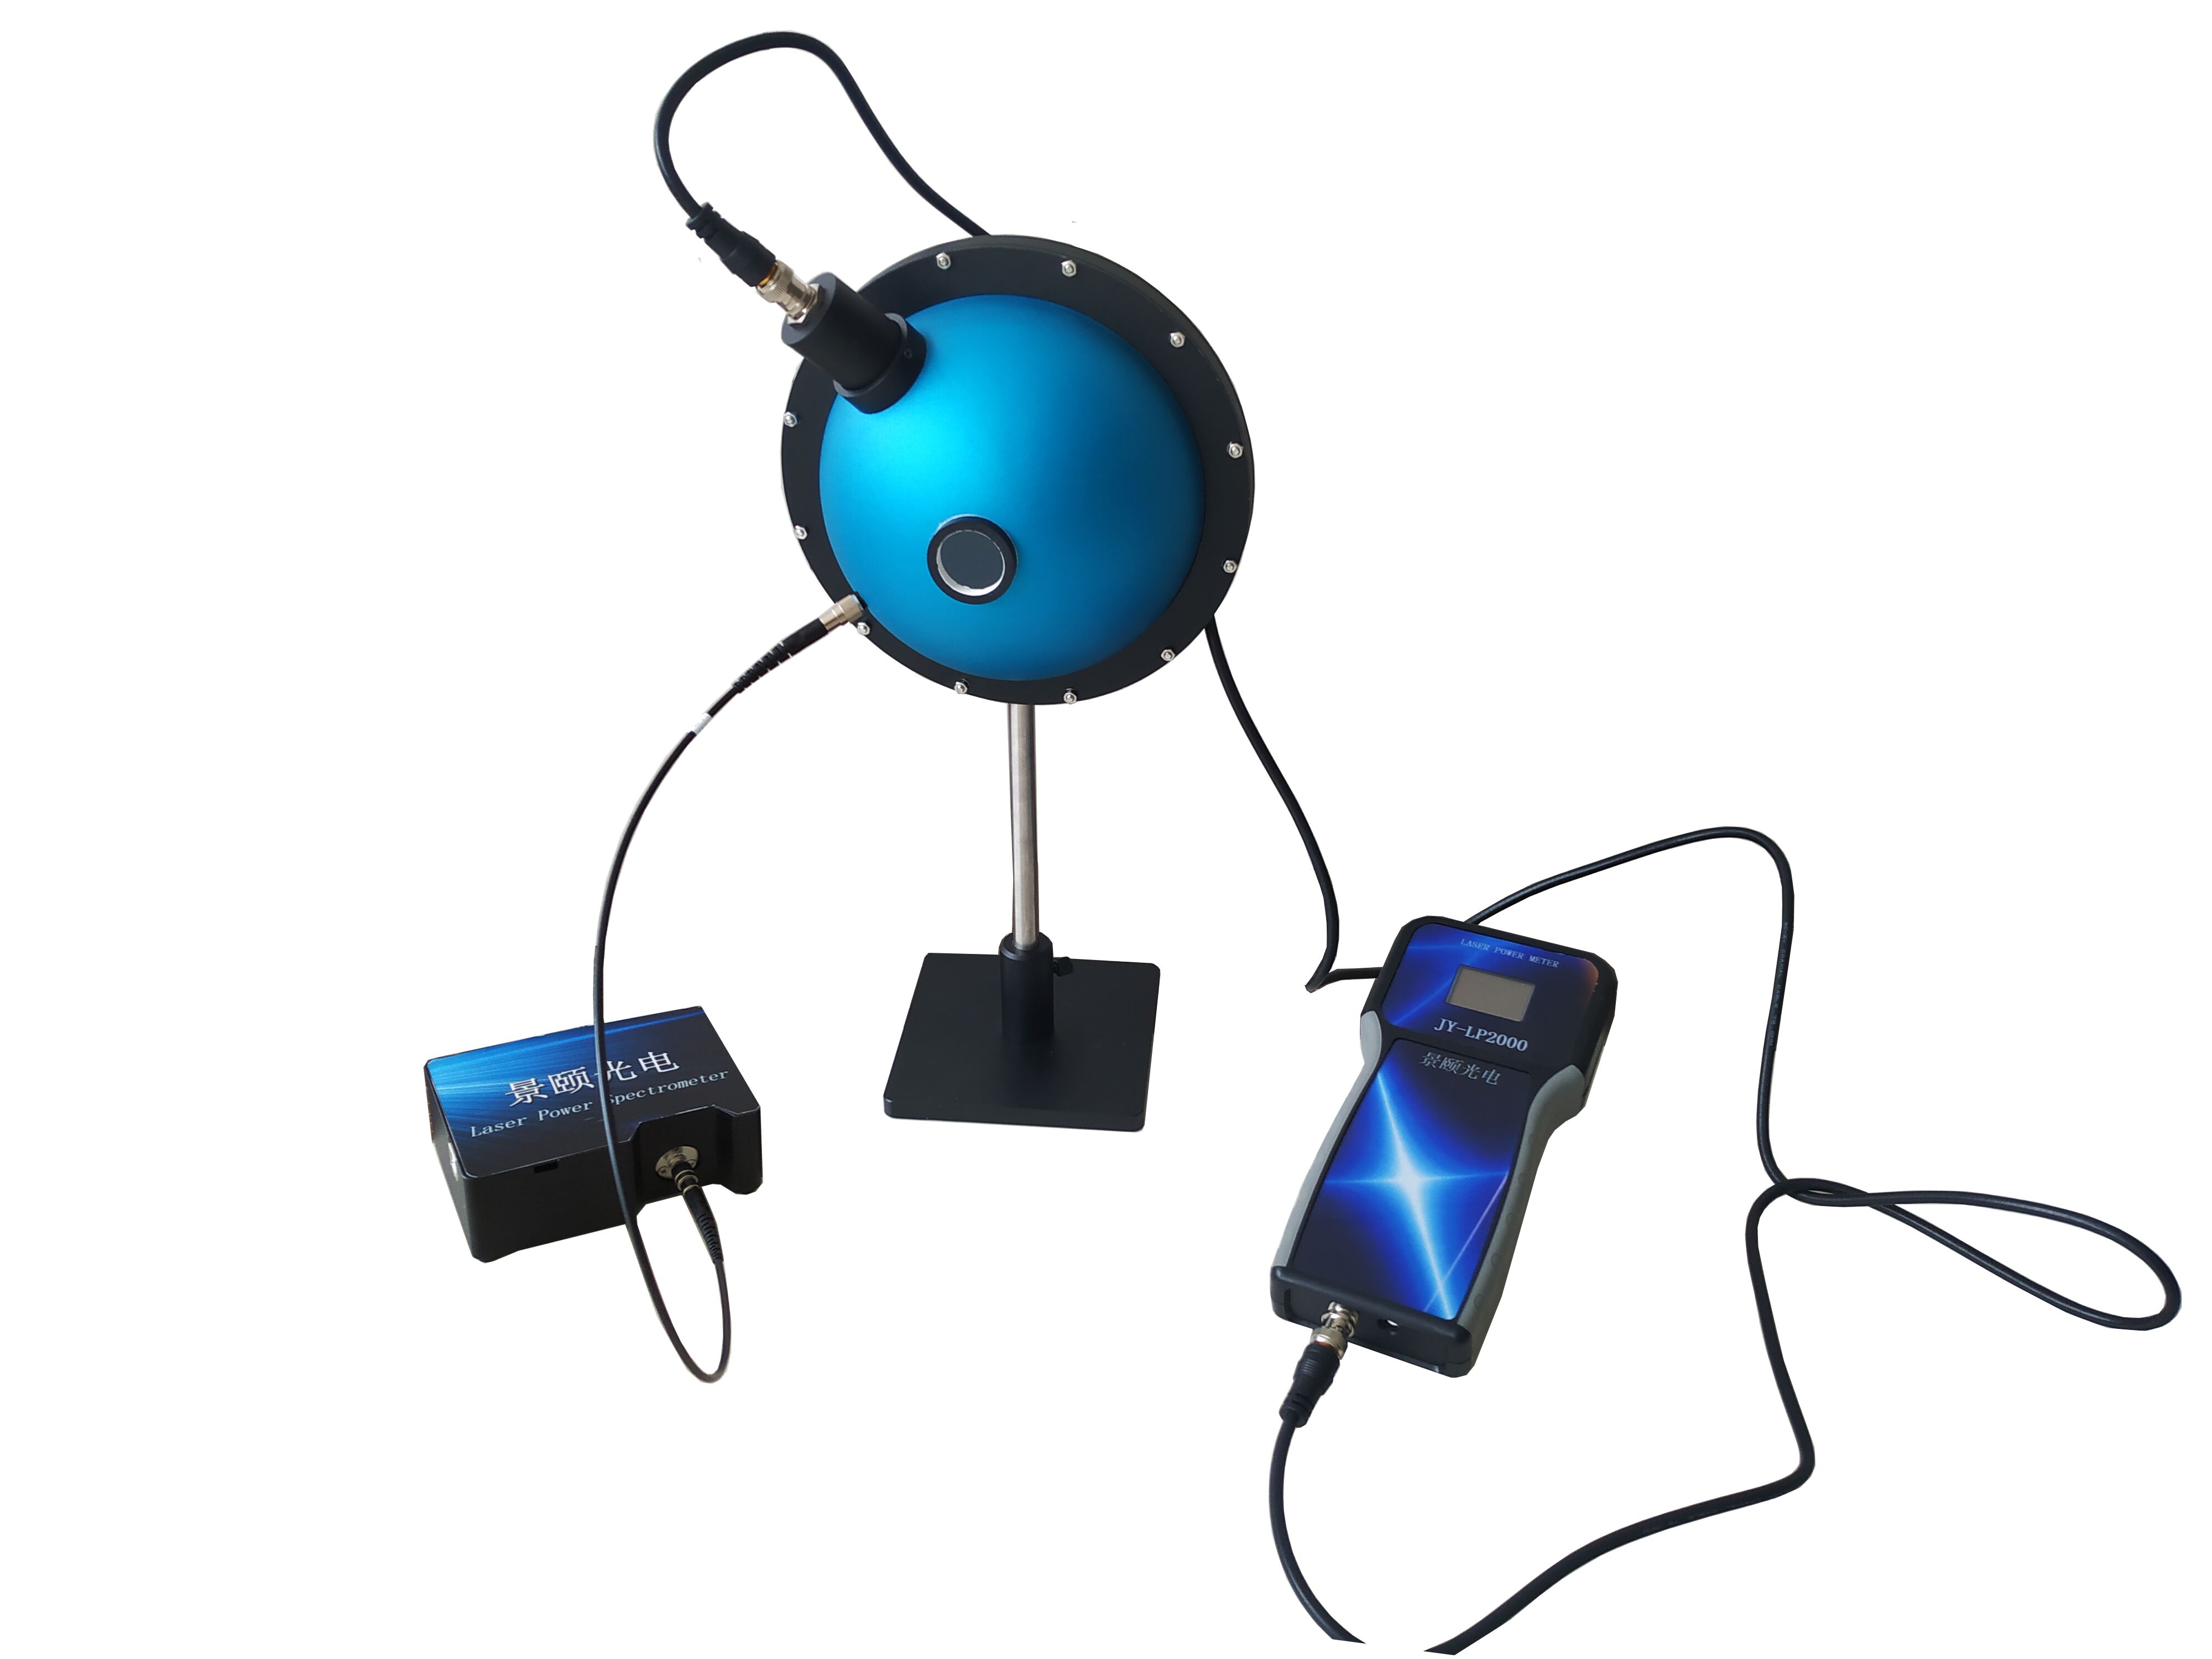
A large-aperture beam profiler functions like a CT scanner for laser beams—it does not speak, but it reveals exactly where the beam widens, skews, or loses energy symmetry. In laser quality control, systems with 22.4 mm sensing targets and wide-temperature tolerance provide traceable data under thermal drift, vibration, and high-power conditions. Covering UV to mid-infrared wavelengths, these instruments capture 2D energy distribution to analyze beam diameter, centroid, ellipticity, and power fluctuation. For semiconductor, optical communication, and automotive electronics production, maintaining measurement consistency through attenuator configurations and uncooled detection directly supports yield rates and optical alignment accuracy.
What a Beam Profiler Actually Does
A beam profiler is an industrial instrument that translates “laser beam he
Why Production Lines Need Laser “Imaging”
Many assume a laser device only needs to “emit light” to pass quality checks. In reality, a seemingly straight infrared beam inside an optical transceiver module can shift its centroid by 0.37 mm during an overnight qualification run. That microscopic drift slashes fiber coupling efficiency, triggering batch rework. One optical component manufacturer absorbed $21,300 in scrap costs from a single incident traced to uncorrected centroid wander.
Traditional visual inspection or generic industrial cameras only confirm presence of light. They miss critical details: beam width variation, ellipticity, tailing, or dual peaks. These parameters directly govern process outcomes. In automotive electronics and semiconductor packaging, the environment is never a恒温洁净实验室. Vibration, particulate, and temperature swings are constant. Seeing “light” is trivial; measuring reliably under stress is the real challenge. The value of a beam quality analyzer lies in continuous monitoring, logging every jitter as data points that feed process control.
Core Components: How the System Reads Light
Sensor: The Fine-Grained Film
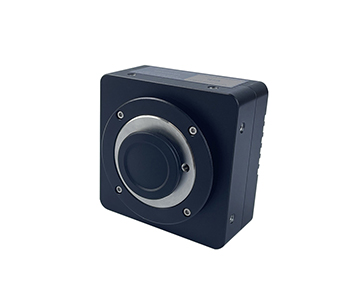
The sensor acts as the “film” of the system. Pixel size determines resolution—smaller pixels capture finer energy gradients at beam edges. A mainstream large-aperture device achieves 3.2 μm pixels, preventing subtle energy slopes from blurring into uniformity. Across a 22.4 mm square target, this equates to sampling the entire beam with an extremely fine grid. In production, large spots, far-field divergence, and line beams are captured in a single frame without repositioning the unit.
Attenuator: Sunglasses for High-Power Lasers
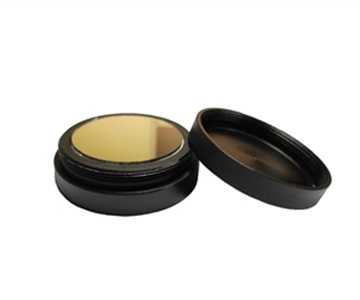
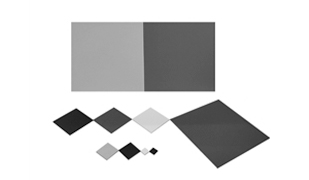
Laser power often reaches watts or higher; direct exposure saturates or damages the sensor. An attenuator works like sunglasses, dimming the beam before the sensor reads its shape. Certain systems include adjustable attenuation stacks, extending power handling to kilowatt levels. This protects the detection surface before precision is even discussed—essential for high-power laser welding or range-finder source inspection.
Analysis Software: The He
Hardware captures a “photo of light”; software translates it into engineer-ready language: major/minor axis, centroid coordinates, ellipticity, Gaussian fit, 2D/3D pseudo-color contours. It plots power fluctuation curves and calculates pointing stability. In R&D labs, users see not just a static image but a continuously updating beam he
Real-World Applications
Semiconductor Laser Coupling: A Process Engineer’s Night Shift
At a semiconductor OSAT facility, a process engineer needed to couple a laser output into single-mode fiber. Slight beam deviation spiked coupling loss. Using a large-target system, he monitored centroid coordinates in real time while adjusting collimating lenses with 3D energy maps. When the measurable range spans tens of microns to over twenty millimeters, both near-field modes and far-field divergence trace to the same device. Coupling consistency improved markedly; the batch no longer exhibited the “bright but disconnected” anomaly.
Automotive Infrared Sensing: Mid-Wave Detection on the Line
An automotive infrared module plant required verification of long-wave infrared emitter spot uniformity. Ambient temperature fluctuations from HVAC cycling introduced thermal drift that rendered visible-light cameras useless. An infrared-configured profiler with an uncooled detector captured thermal signals in the 8–14 μm band, with thermal sensitivity better than 35 mK, identifying minute energy non-uniformities. On the automotive sensor line, the “thermal fat or thin” of infrared spots became quantifiable—no more guessing by feeling the housing temperature.
Three Common Misconceptions
Myth 1: Higher Pixel Count Means Better Accuracy
Incorrect. High pixel density only increases sampling density; the true lower bound is pixel physical size and noise. Small pixels paired with a small target cannot contain large beams. The correct approach: first check the measurable beam diameter range, then evaluate pixel size. Large spots demand large targets; micro-spots demand fine pixels. It is a trade-off, not a pixel-stacking contest.
Myth 2: A Visible-Light Camera Is Good Enough
Standard industrial cameras lack attenuation paths, beam analysis algorithms, and cannot output ISO-compliant fit parameters. They report “light here” but cannot diagnose “whether this light is he
Myth 3: Poor Environment? Fix It in Post-Processing
Temperature and humidity shifts cause lens micro-deformation and detector dark current drift; dust and vibration directly contaminate the optical path. Software can compensate partially, but cannot recover clipped energy information. For automotive LiDAR parameters, Jingyi Optoelectronics participated in drafting T/CITS 231—2025 “Technical Requirements for Automotive LiDAR,” which defines test methods for beam pointing and detection consistency. Within that framework, the evaluated system prioritizes repeatability under thermal drift and vibration boundaries—conditions no software patch can fully reverse.
Environmental Boundaries: Where the System Reaches Its Limits
Presenting any instrument as omnipotent undermines procurement decisions. Large-target CMOS may still suffer dark current and mechanical micro-displacement in extreme cold or heavy vibration. Uncooled infrared avoids cryogenic maintenance but faces frame-rate and thermal response latency limits when capturing fast transient spots. Additionally, Ethernet or USB power with IP40 protection suits clean or semi-clean workshops—not direct exposure to outdoor rainstorms. Lens interfaces, attenuator cleaning, and fan noise are all maintenance costs that production lines must budget for. Acknowledging these boundaries prevents treating a beam profiler as a mythically maintenance-free device.
Frequently Asked Questions
Q1: How does a beam profiler differ from a power meter?
A power meter outputs total energy without distinguishing distribution. A beam profiler analyzes shape, centroid, ellipticity, and stability, identifying “beam shape defects.” The two are complementary, not substitutes.
Q2: Do I need separate devices for UV, visible, and infrared?
Band response depends on the detector chip. UV to visible can use large-pixel CMOS; near- and mid-infrared require InGaAs or uncooled detectors. Cross-band applications typically demand separate instrument configurations.
Q3: What is the smallest spot size measurable?
It depends on pixel size and optical magnification. The evaluated system reaches a lower limit around 25–170 μm; smaller spots require microscope objectives. Always calibrate with a standard aperture before actual measurement.
Q4: How can production procurement control validation costs?
First filter by wavelength and measurable diameter range. Then request repeat measurement data under identical light sources. Focus on centroid drift and frame rate meeting inline cycle time—avoid blindly chasing maximum resolution.
Q5: How can I independently verify that a beam profiler is not overstated?
Conduct blind tests using a known-diameter standard beam or calibrated attenuator, comparing three repeated results. Cross-check standard compliance and metrological traceability chains to confirm reports align with published test methods such as ISO 11146.
Conclusion and Further Resources
A beam profiler is not a camera for taking pretty laser pictures; it is an industrial instrument that converts beam he
About This Guide
Data Sources
: Uploaded product technical documentation, ISO 11146:2005 (Test methods for laser beam widths, divergence angles, diffraction-limited factor), T/CITS 231—2025 (Technical requirements for automotive LiDAR).
Author
: Cai Xiaodong, Senior Application Engineer, Jingyi Optoelectronics, 12 years in industrial precision measurement and beam analysis equipment.
Disclosure
: Jingyi Optoelectronics manufactures beam profiling systems. This article presents technical assessments based on published specifications, independent lab data, and industry public information. No compensation was received from third-party brands mentioned.
Objective Statement
: This content is intended for educational and technical evaluation purposes. Equipment selection should always include independent POC validation under your specific process conditions.
Last Updated
: November 2025