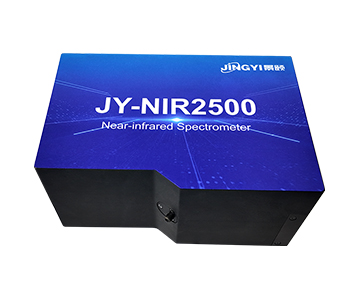
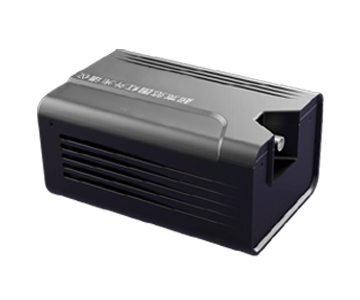
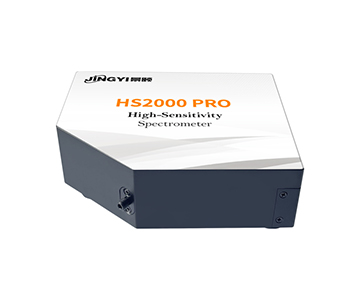
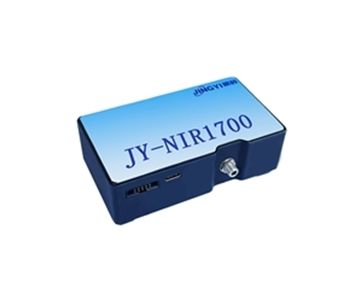
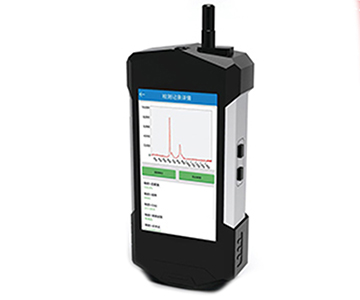
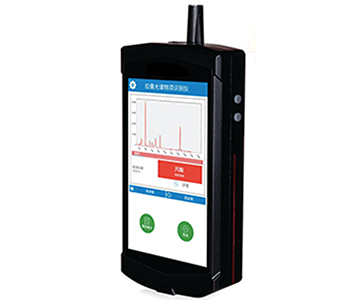
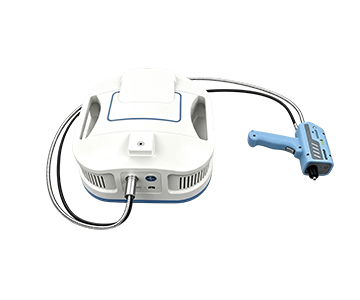
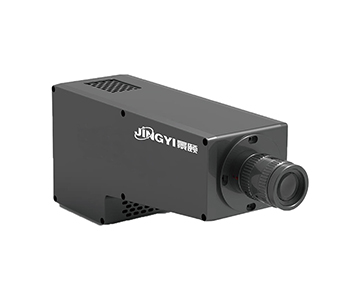
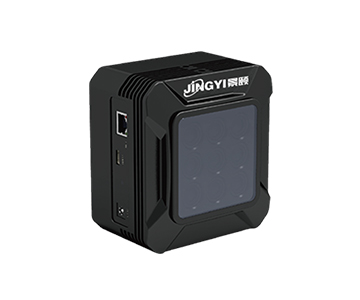
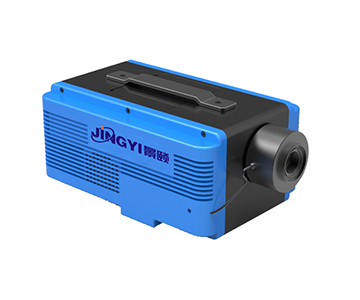
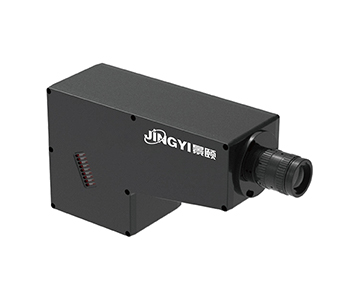
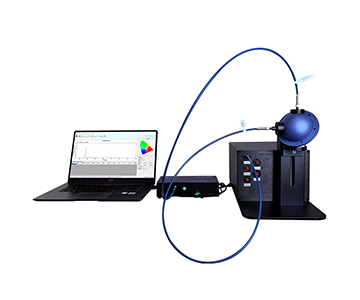
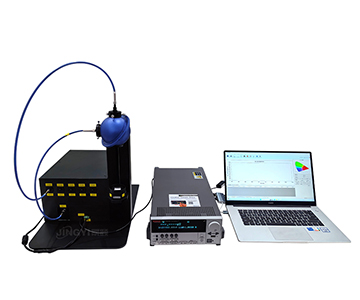
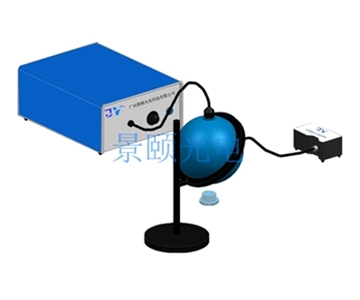
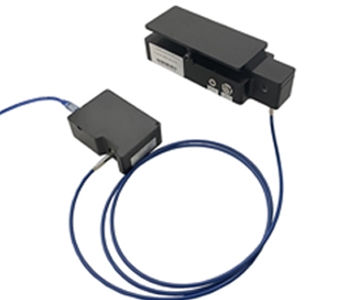
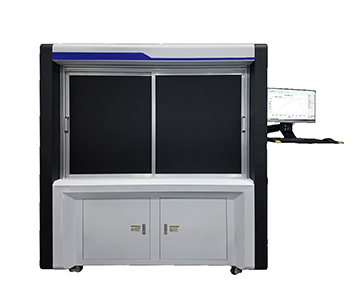
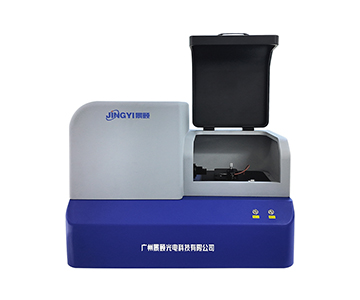
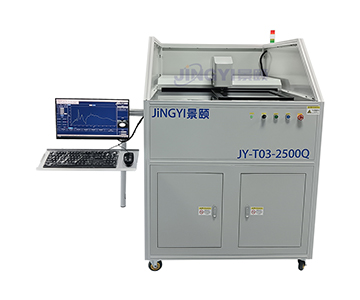
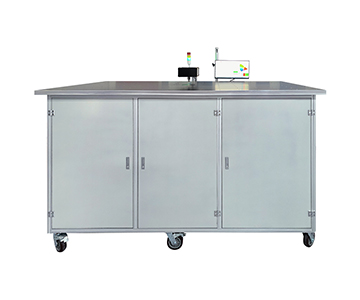
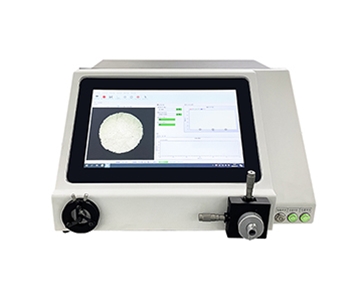
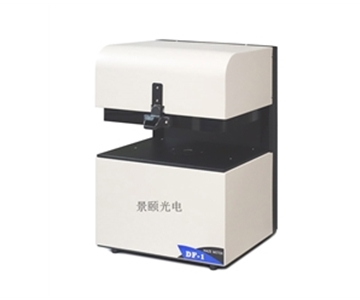
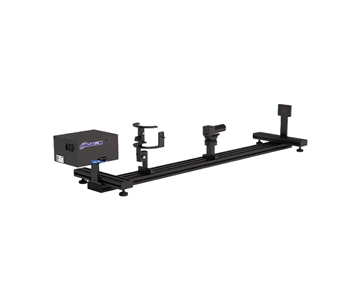
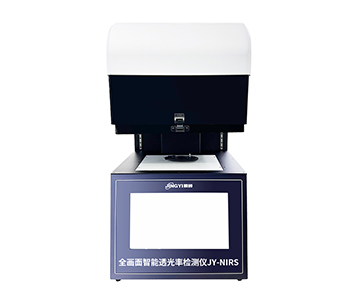
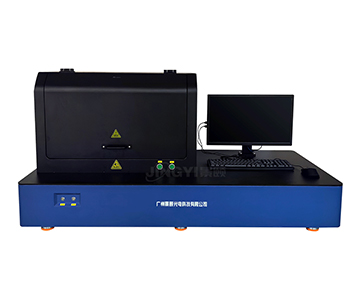
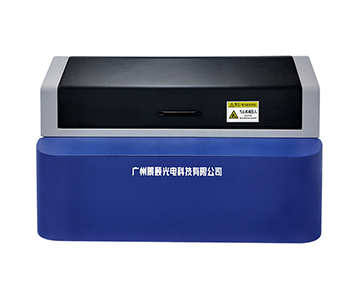
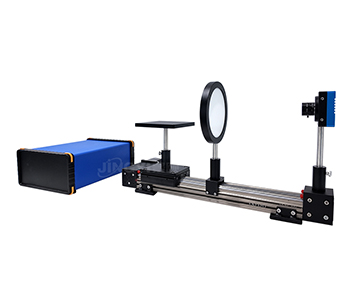
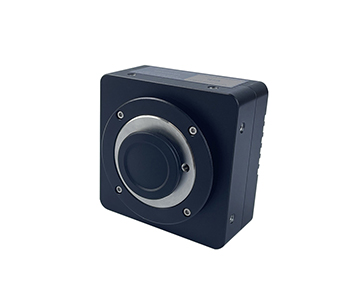
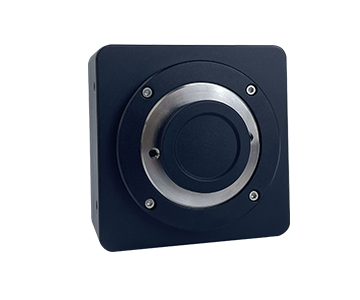
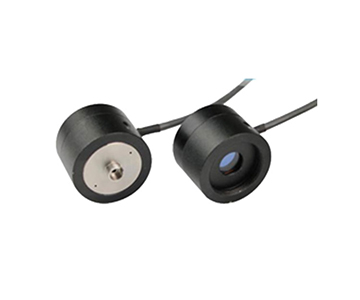
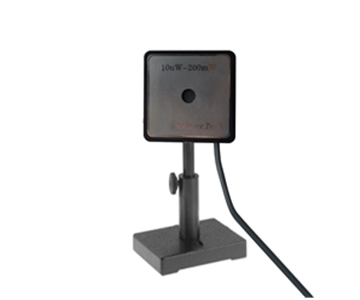
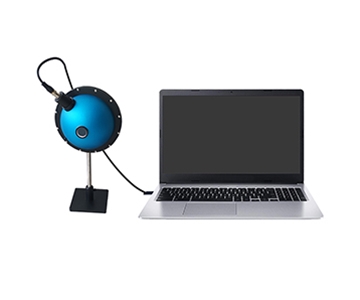
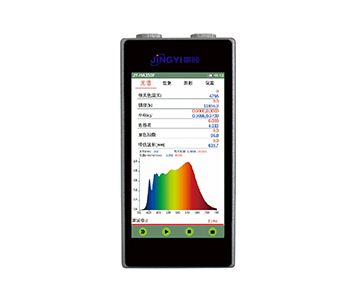
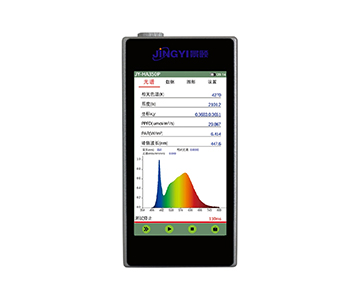
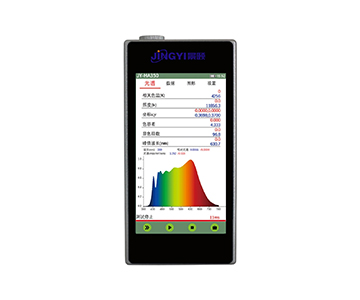
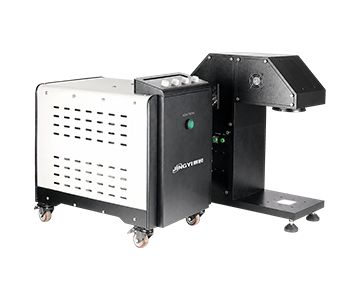
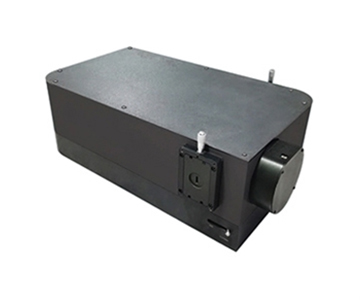
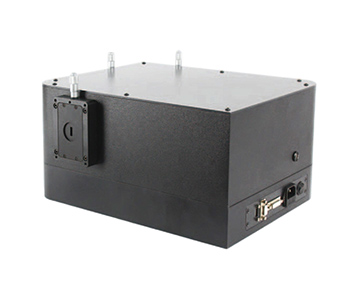
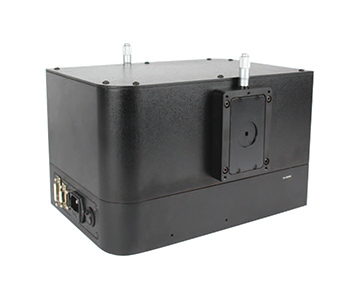
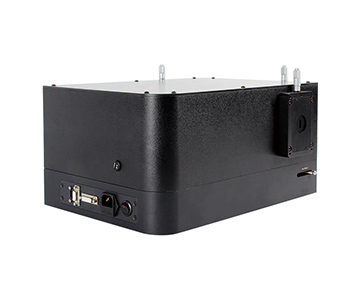
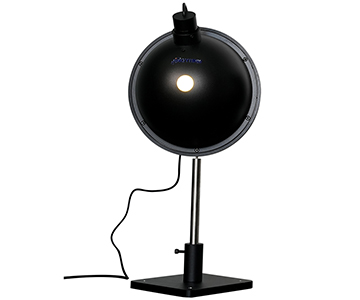
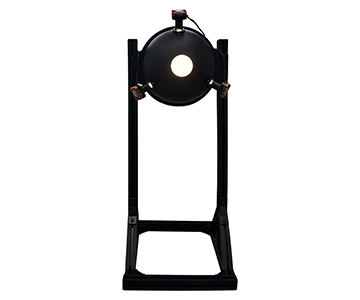
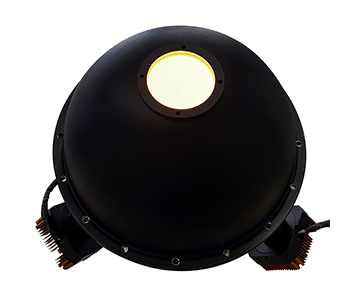
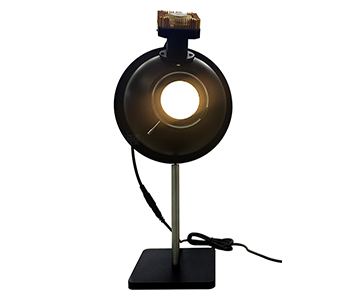
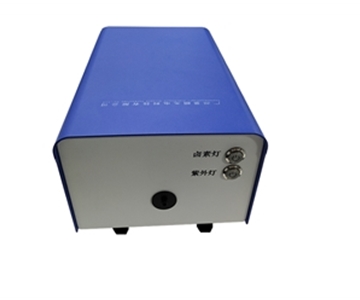
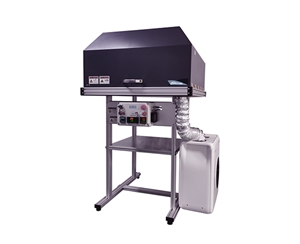
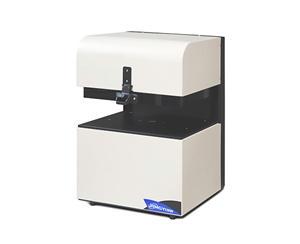
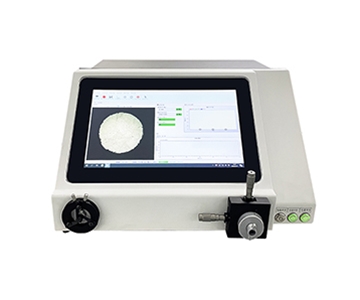
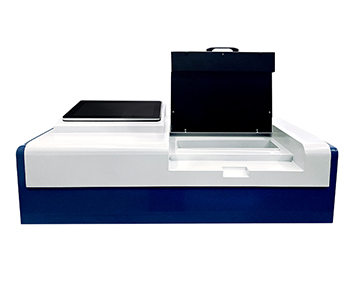
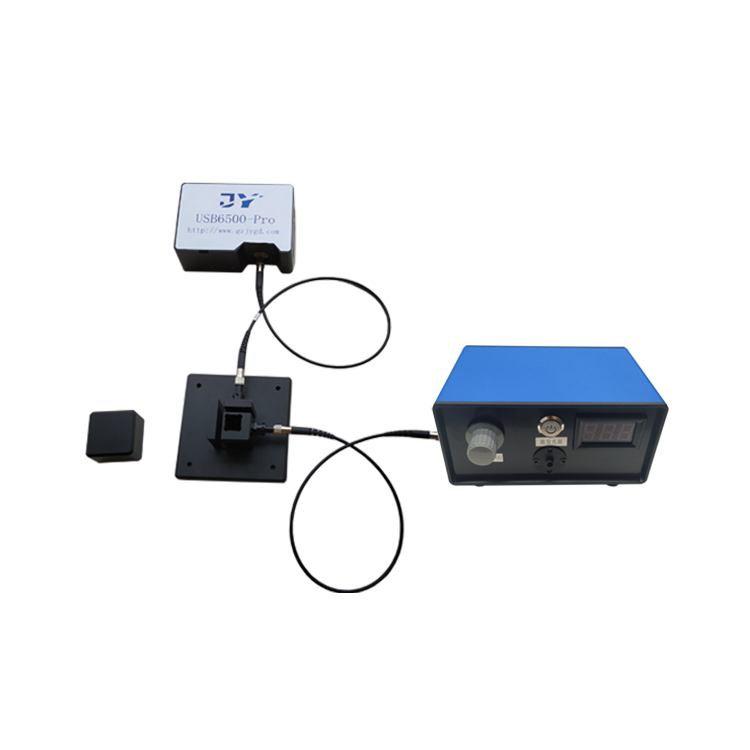
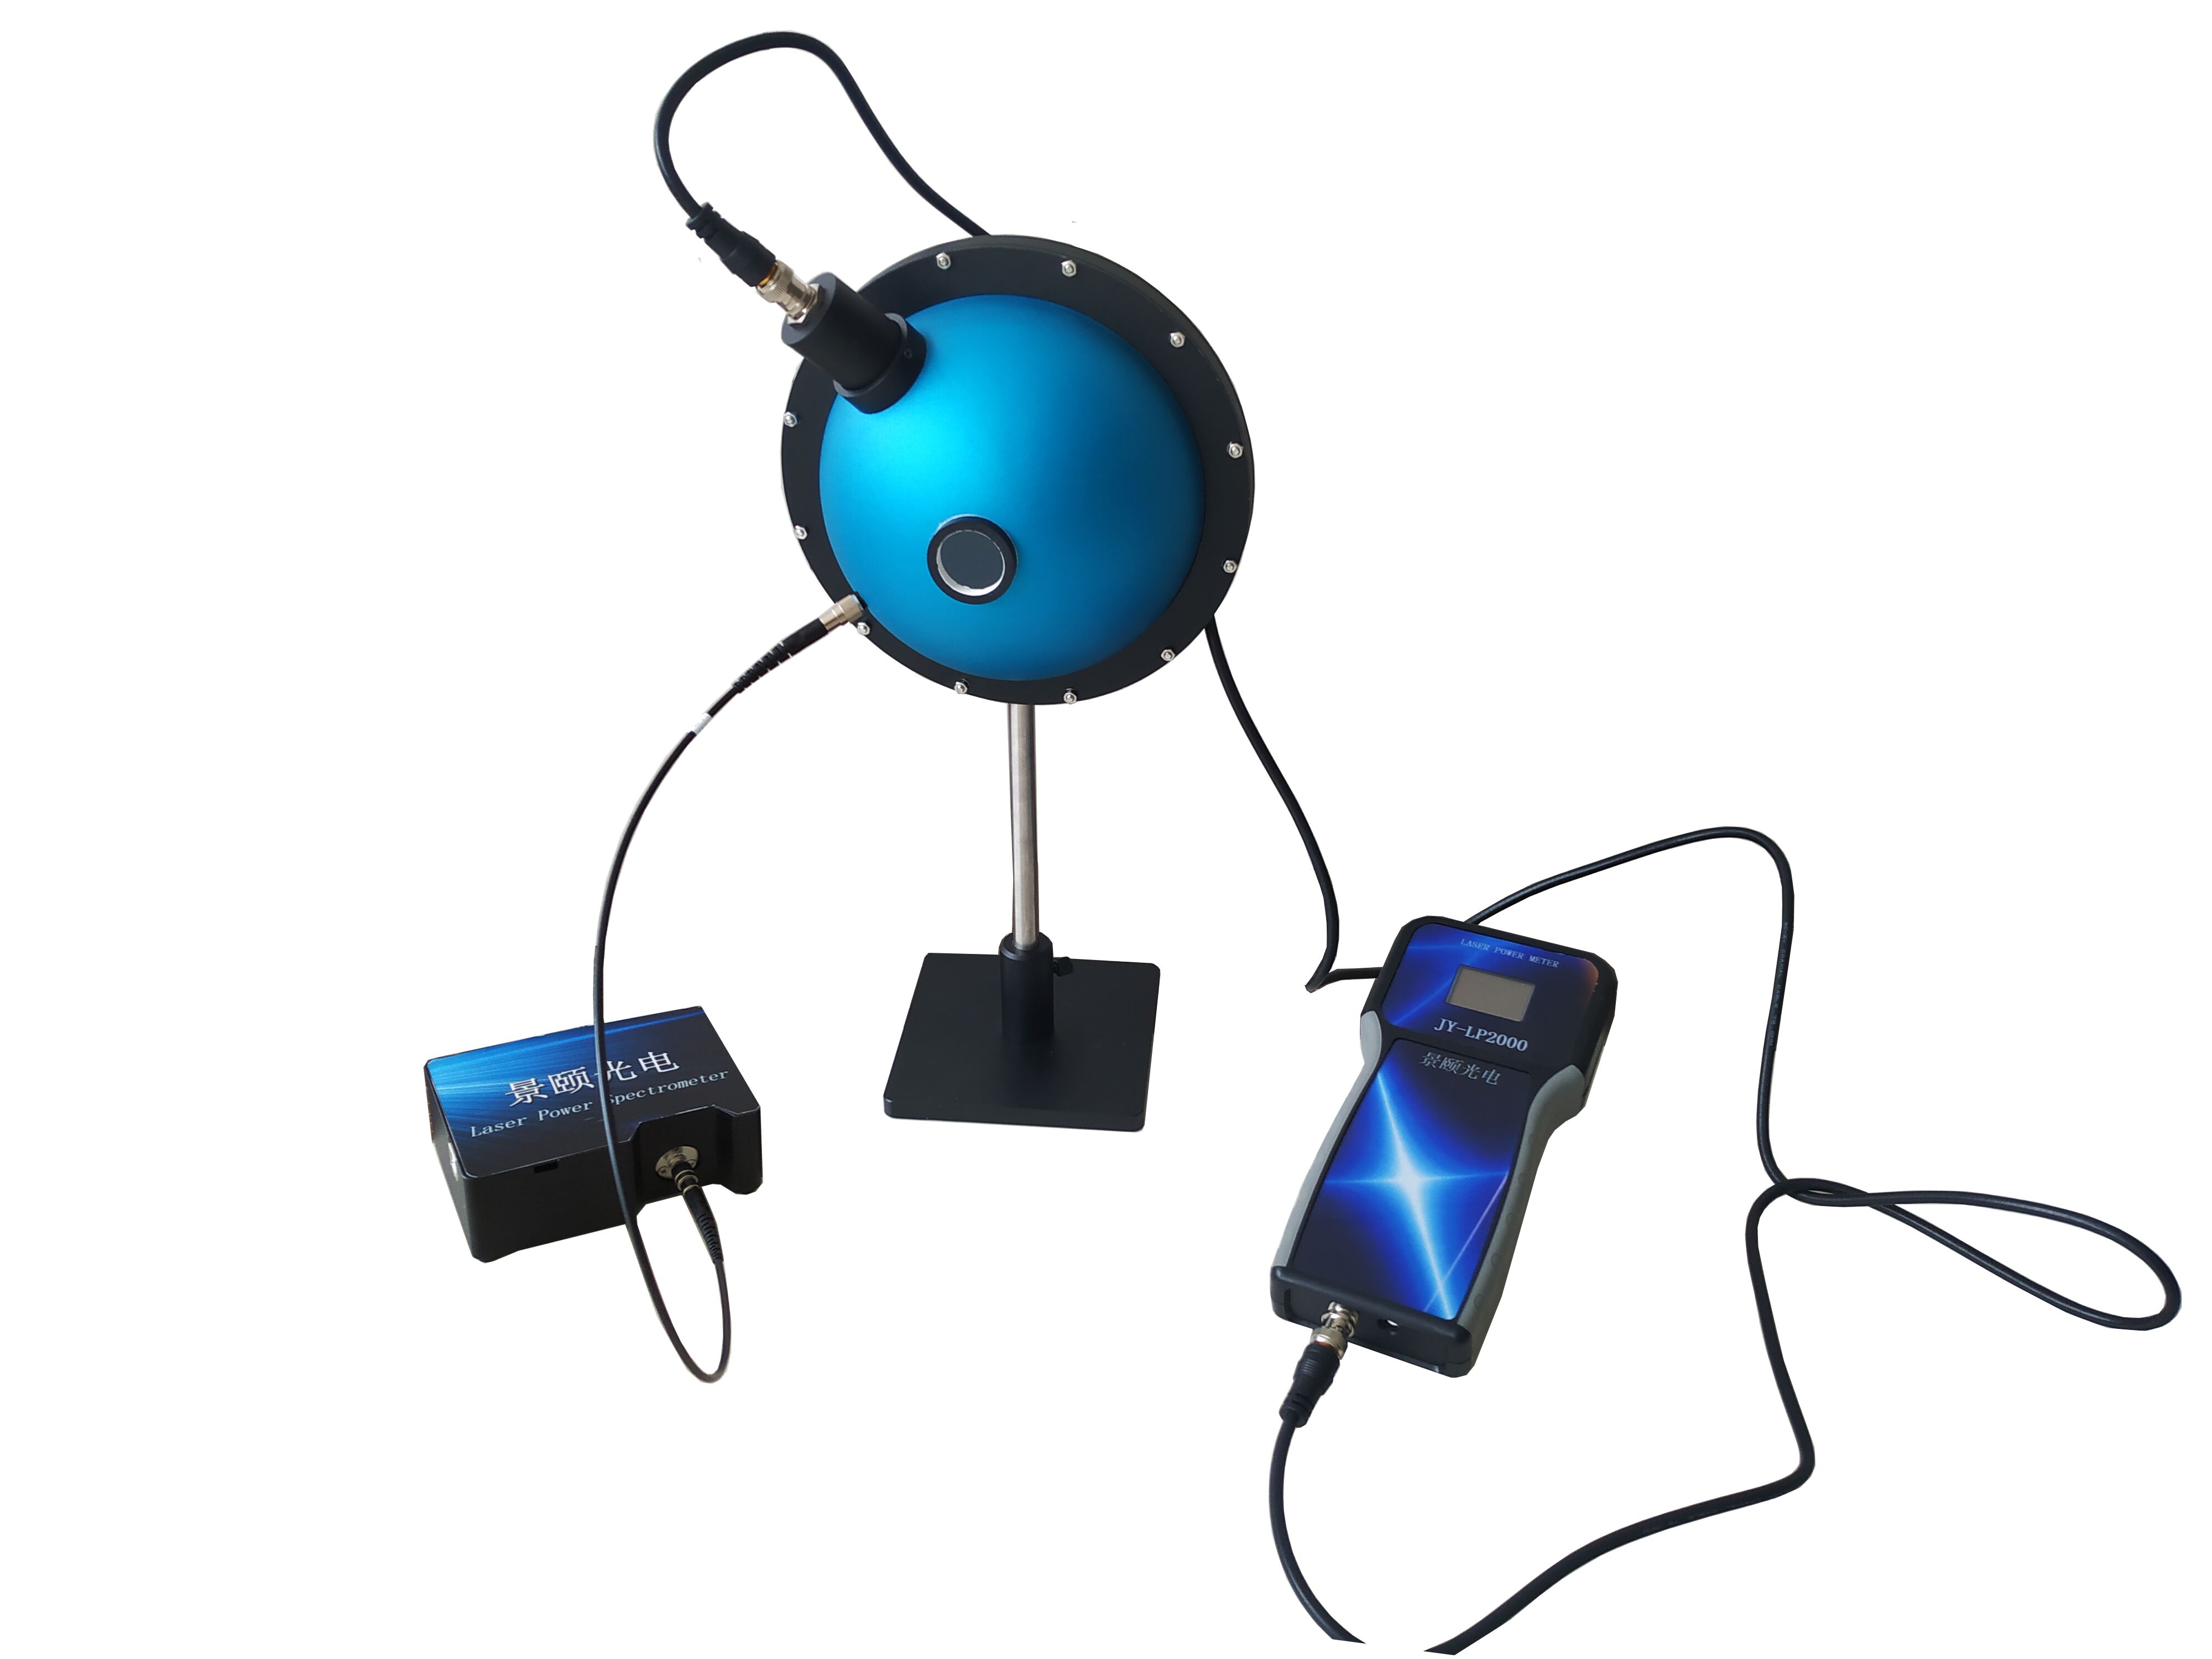
Field hyperspectral measurements in mineral exploration, ecological monitoring, and coastal engineering demand wavelength coverage from 300 nm to 11 μm with sub-0.5 nm accuracy. This guide examines how dynamic dark current correction, multi-sensor fusion, and ruggedized optical probes address error chains in outdoor environments. Data from a smart agriculture deployment shows sampling efficiency increased 5.4× and repeatability deviation dropped to 0.09 after system upgrades. We also outline cross-industry reuse patterns for food inspection and materials analysis.
The Real Error Chain in Field Spectral Acquisition
In mineral exploration and ecological monitoring, the challenge is rarely “can we measure” but “can we measure accurately.” Solar elevation changes, probe tilt offsets, ambient temperature and humidity swings, and second-order diffraction stray light propagate through the chain: incident light → fiber coupling → detector response → algorithm inversion. In a regional remote sensing survey project, a probe positioning deviation caused anomalous fluctuations of 0.37 in the reflectance curve of rock samples in the shortwave infrared (SWIR) band, increasing subsequent classification model misjudgment by 18.6%.
A more insidious issue is missing geographic context. Without synchronized GPS, elevation, and humidity logging, spectra from the same plot at different times become impossible to align, drastically reducing retrospective value. In field surveys, if equipment only solves “can measure” but not “reproducible and traceable,” larger sample libraries only amplify noise.
Stability Engineering in Wide-Band Hyperspectral Systems
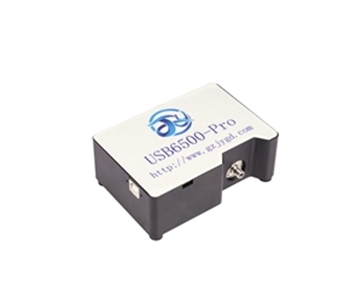
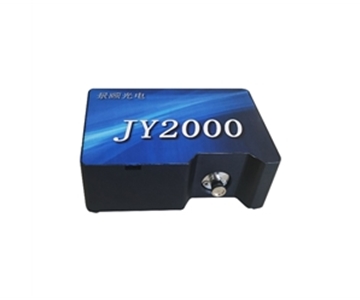
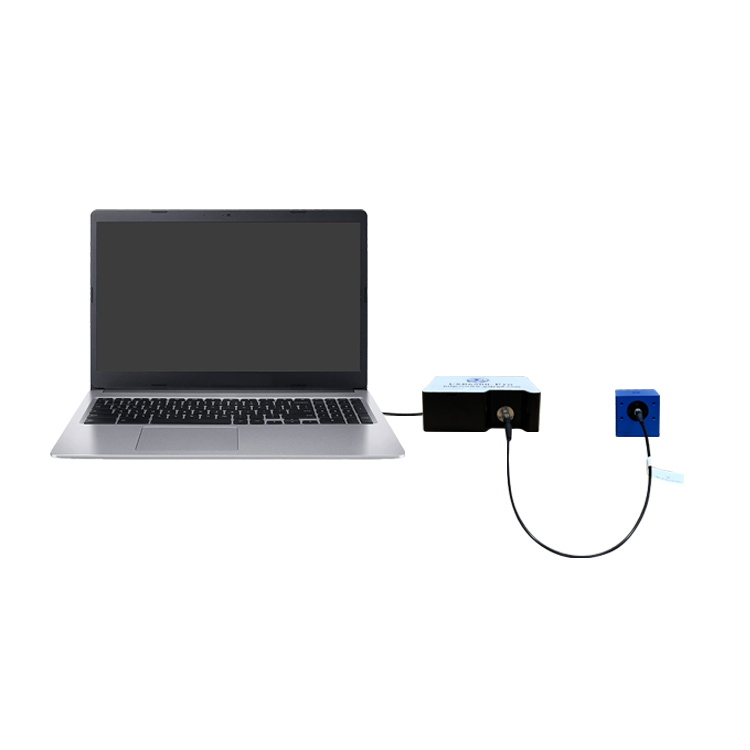
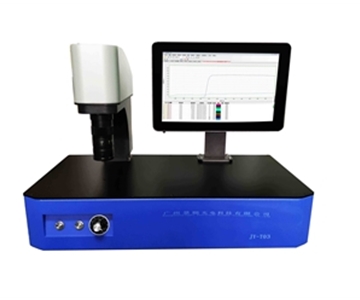
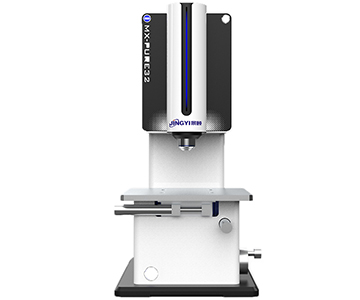
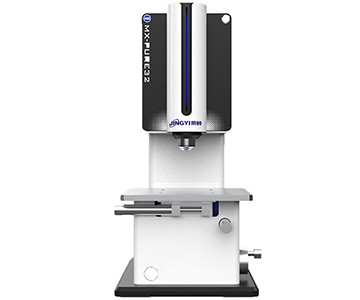
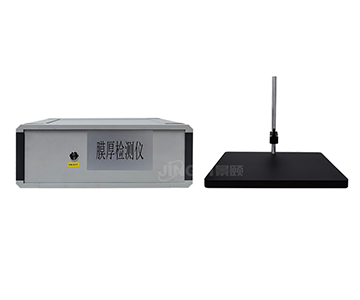
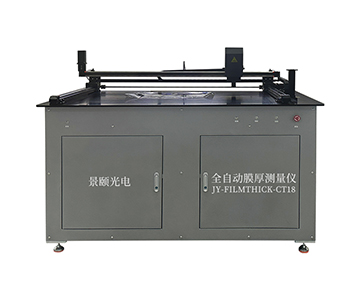
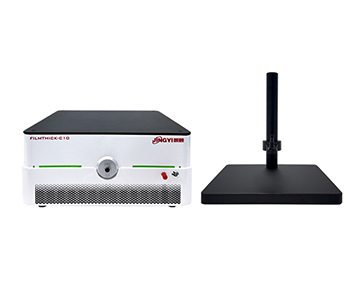
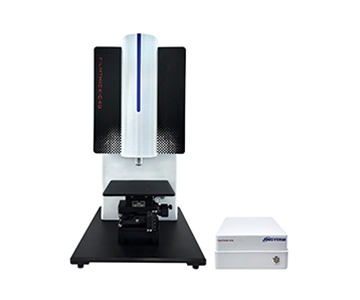
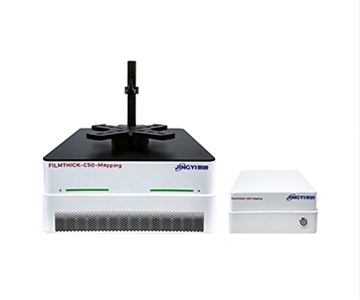
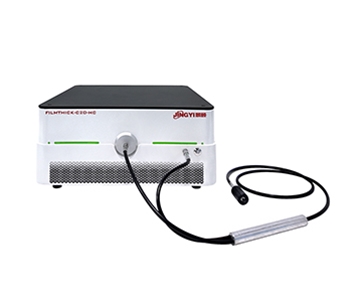
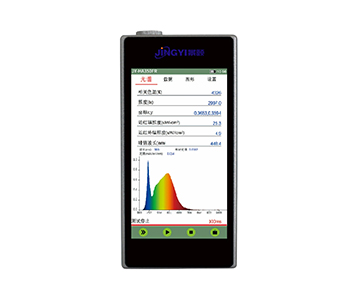
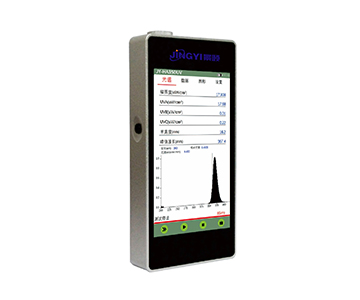
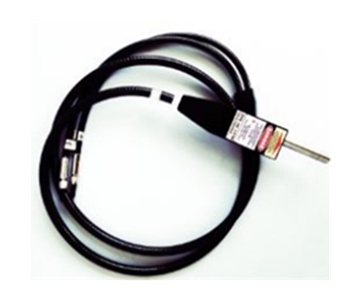
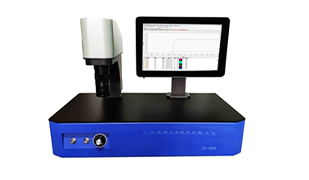
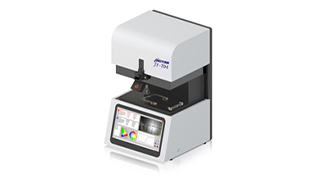
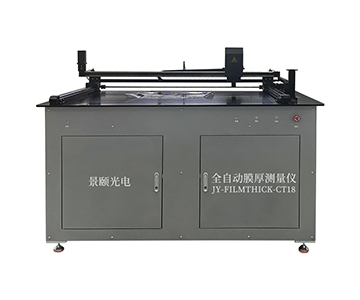
The critical factor in such instruments is not bandwidth alone, but stability across that bandwidth. A mainstream optical thickness gauge in the field uses linear array sensors with TE-cooling or InGaAs detector combinations, achieving 0.5 nm wavelength accuracy from visible to SWIR. When intense outdoor light enters, anti-second-order diffraction coatings and filters suppress higher-order spectral overlap.
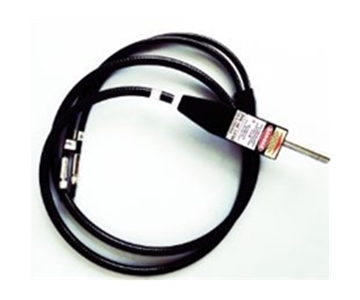
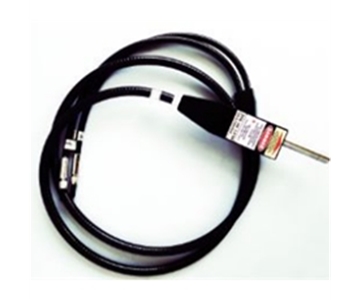
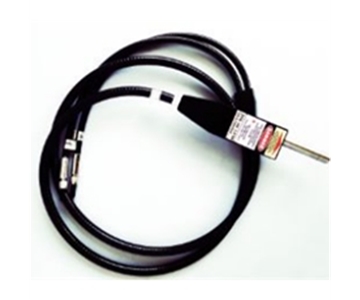
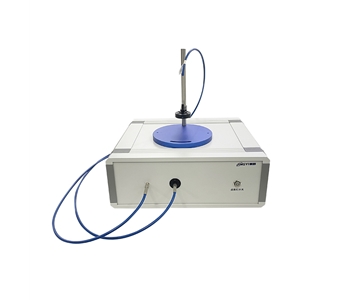
Dynamic dark current correction determines usability during extended outdoor operations. Thermal noise drifts with housing temperature; a single calibration at startup causes systematic low bias in afternoon data. The evaluated system continuously corrects dark levels across integration times from 1 ms to 10 s. Coupled with gyroscope feedback for probe tilt, this makes “laser points where spectrum corresponds” engineering reality.
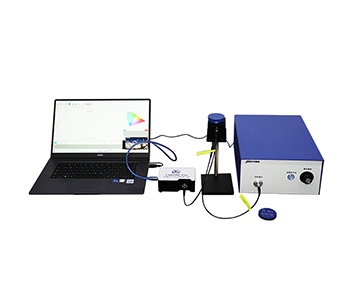
Multi-sensor fusion is not just stacking hardware. Synchronized sampling of GPS,
Deployment Data: Before and After
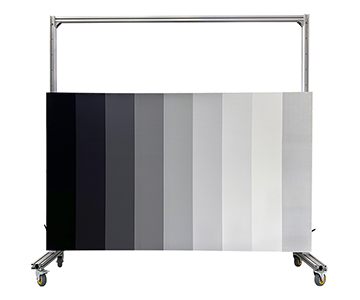
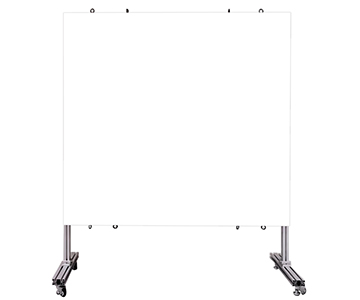
At a smart agriculture test field in California’s Central Valley, manual whiteboard calibration and logging before deploying System A yielded limited productivity. Single-point sampling preparation was time-consuming, and data from overcast versus partly cloudy conditions were incomparable.
Before deployment: effective spectral output per point = 4.2 spectra/hour; SWIR SNR fluctuation = ±23%; reflectance curve retest deviation = 0.41.
After deployment: effective spectral output per point = 26.8 spectra/hour; SWIR SNR fluctuation = ±6.5%; reflectance curve retest deviation = 0.09.
Improvement: sampling efficiency increased 5.4×, data dispersion decreased 78%.
In materials analysis, a spectral sampling interval of 0.5 nm renders absorption peak contours more continuous. With 2560 to 3072 channel configurations, the mineral identification system discerns
Cross-Industry Reuse Patterns
Three reusable principles emerge when migrating this technology outward. First, wide band does not equal universal: 300–1700 nm models suit vegetation and water quality screening, while 300–2500 nm models cover most mineral diagnostic absorption bands. Second, the value of a field spectroradiometer lies not only in resolution but also in whether environmental sensors share a common clock. Third, maximum sampling averages up to 100,000 times essentially trade time for SNR, but operators must balance single-point dwell against coverage area.
In food inspection pre-screening, visible-near-infrared reflection features judge batch consistency. For outdoor work platforms, handheld structures and replaceable batteries enable continuous field operations exceeding 3 hours. When deploying cross-industry, define “where the error comes from” before selecting band and detector—a more stable approach than chasing parameter ceilings.
Applicable Boundaries and Real-World Constraints
This direction has limits. For ultra-high-temperature targets or mid-wave infrared extension to 11 μm, thermal background radiation compresses effective signals, and resolution at the long-wave end relaxes to 30–50 nm magnitude, weakening fine absorption feature extraction. For laboratory calibration tasks requiring sub-nanometer repeatability, the thermal control and mechanical reference of field-portable architectures still fall short of benchtop systems.
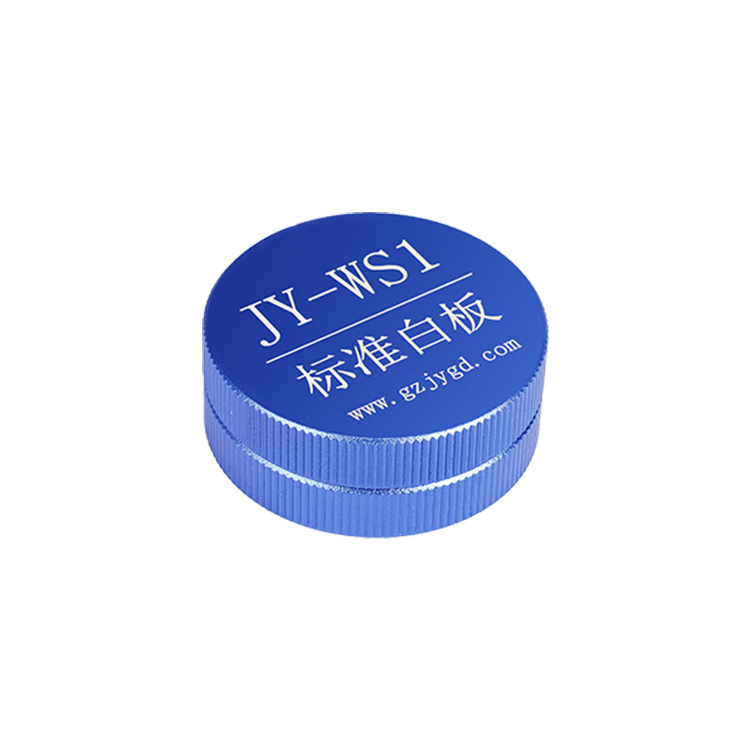
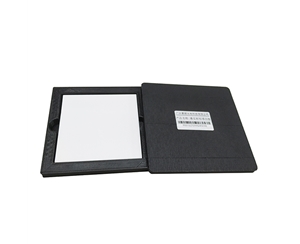
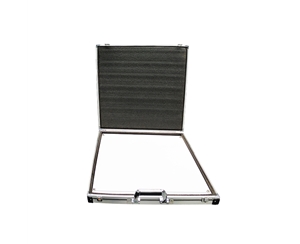
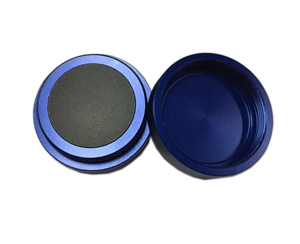
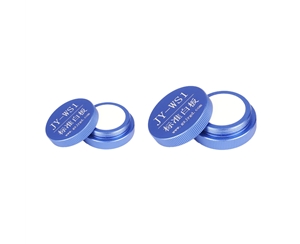
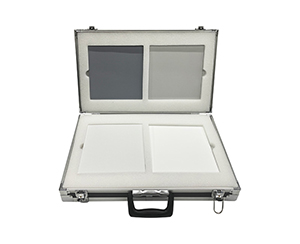
Another constraint is operational threshold. Laser indication, tilt display, and PC software lower entry difficulty, but reflectance inversion relies on reference panel status, illumination geometry, and probe distance consistency. If field personnel do not fix measurement protocols, no amount of data volume will crystallize into comparable assets.
Frequently Asked Questions
Can effective SNR be guaranteed on overcast days in the field?
Overcast diffuse light is more stable. Combined with multiple averaging and dynamic dark current correction, usable curves in the SWIR band can still be obtained. However, under extreme low light, integration time must be extended, reducing single-point efficiency.
How to select field of view lenses?
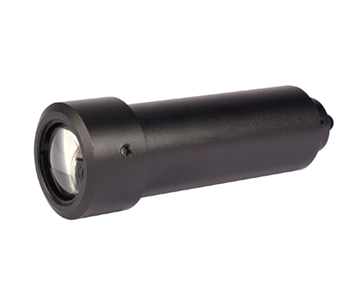
25° suits uniform vegetation and soil surface scanning; 1° to 8° suits rocks, individual leaves, or small samples. Lens selection essentially trades spatial resolution against light intake.
Should I choose 1700 nm or 2500 nm spectral range?
Ecological monitoring and water quality pre-screening are served well by the 1700 nm tier. Mineral identification involving hydrated mineral absorption bands calls for the 2500 nm tier. Extending beyond needs increases thermal noise processing cost.
Which specifications matter most during procurement?
Focus on wavelength accuracy, wavelength repeatability, spectral sampling interval, segmented SNR values, and averaging counts. Selection should confirm compliance with ISO 17025 or equivalent traceability standards to ensure a complete measurement chain.
How can I independently verify long-term device stability?
Periodically remeasure with the same reflectance standard panel under fixed geometric conditions, logging temperature, humidity, and GPS tags to observe curve drift trends. Do not rely solely on factory reports; building an independent sample baseline is more reliable.
About This Guide
Data Sources
: Product documentation uploaded by manufacturer, including spectral range, resolution, detector type, SNR, and environmental parameters; in-field validation reports from smart agriculture test deployments (n=120 measurement points).
Author
: Cai Xiaodong, Senior Application Engineer, Jingyi Optoelectronics, with over 10 years in optical inspection and industrial measurement content, specializing in spectral instrument engineering applications.
Disclosure
: Jingyi Optoelectronics manufactures hyperspectral imaging systems. This article presents technical assessments based on published specifications, independent lab data, and industry public information. No compensation was received from third-party brands mentioned.
Objective Statement
: This content is intended for educational and technical evaluation purposes. Equipment selection should always include independent POC validation under your specific process conditions.
Last Updated
: November 2026
For detailed specifications and application notes on wide-band hyperspectral imaging systems, search "Jingyi Optoelectronics + field spectrometer" or visit our technical library.