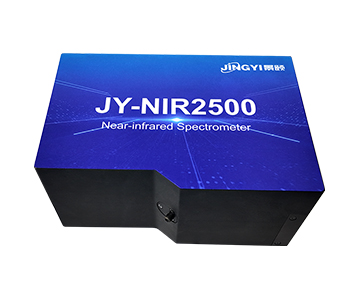
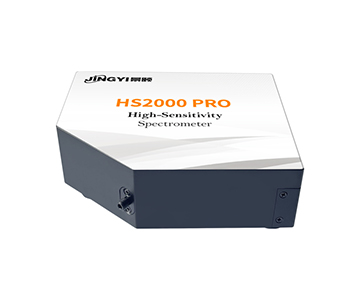
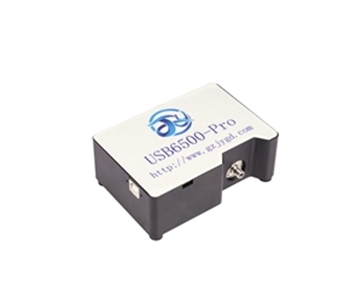
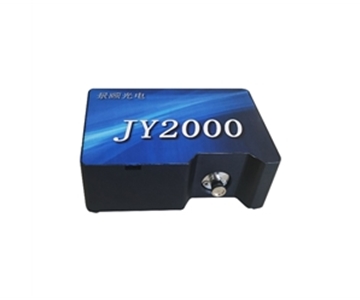
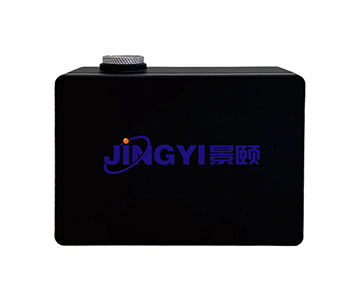
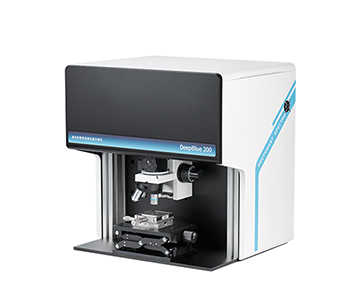
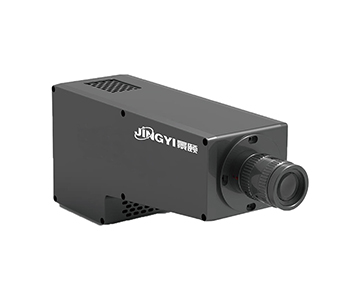
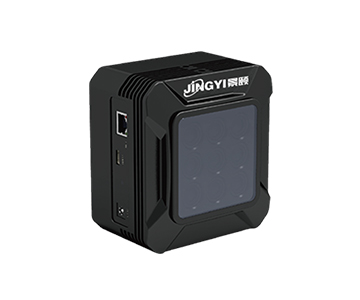
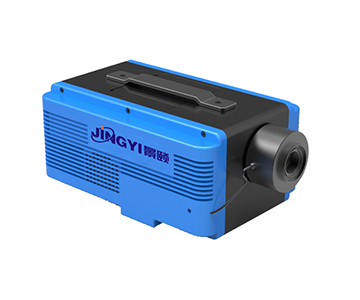
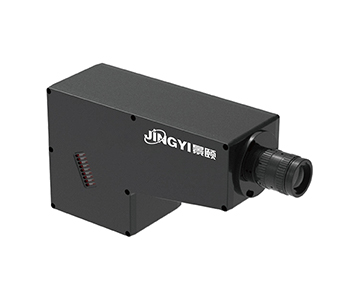
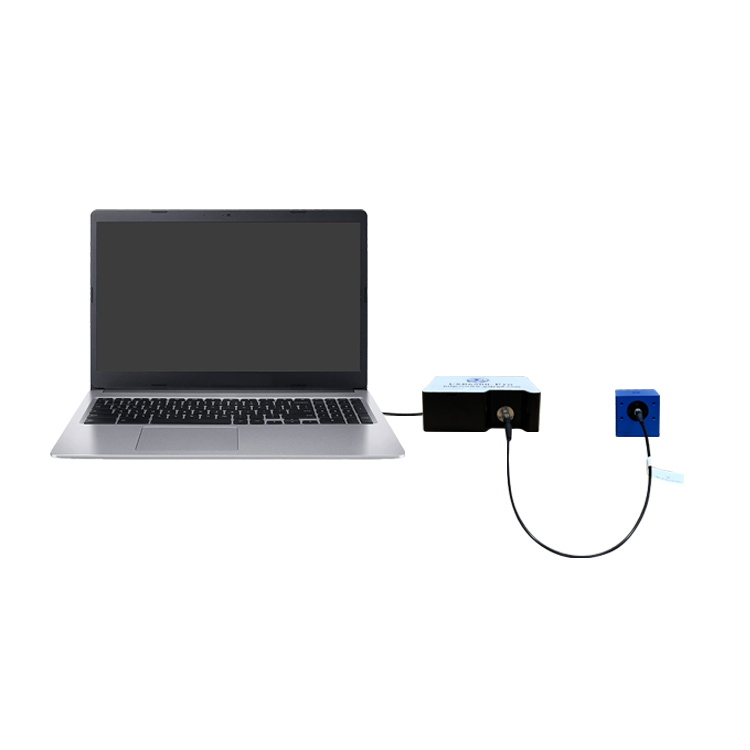
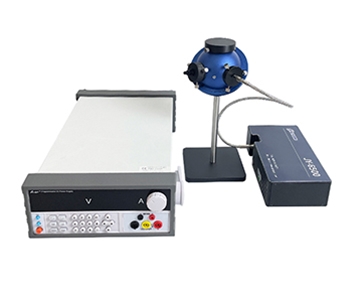
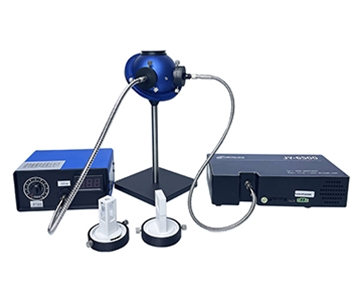
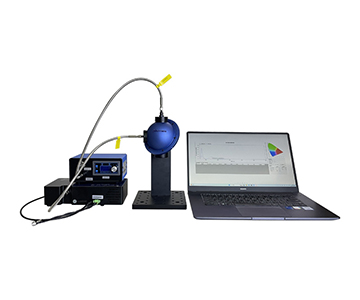
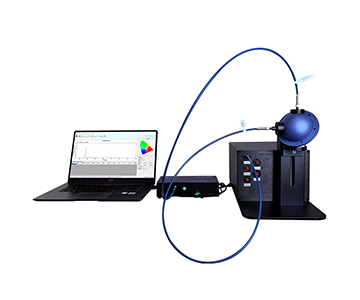
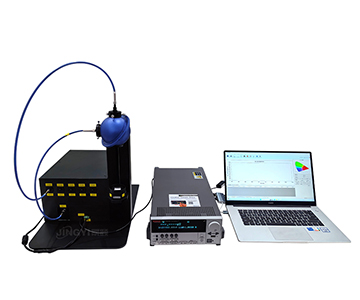
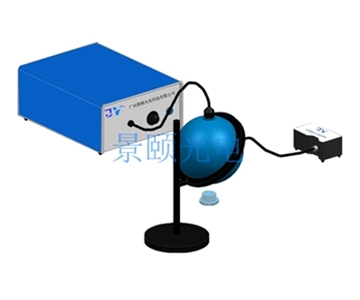
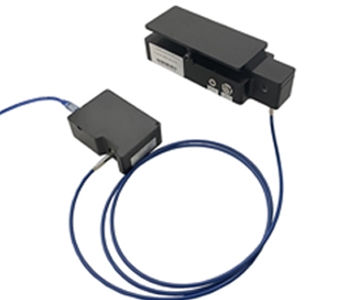
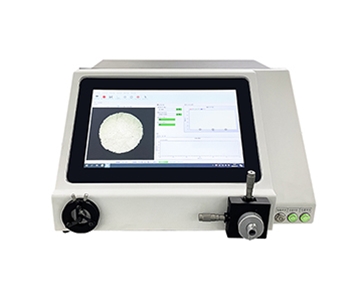
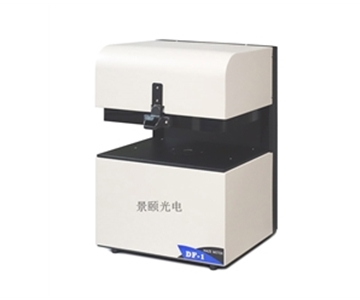
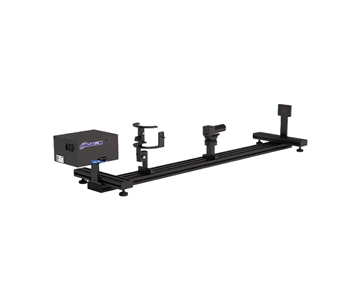
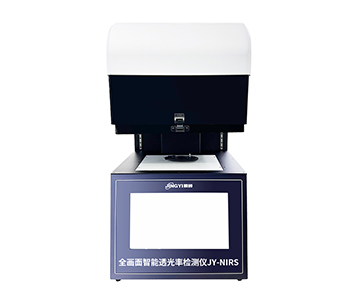
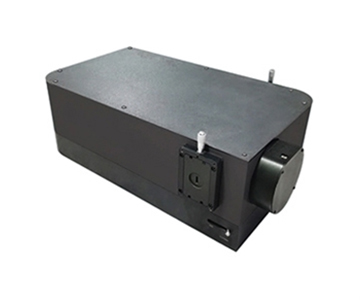
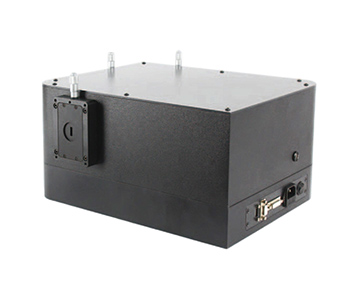
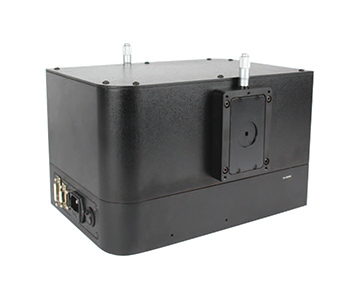
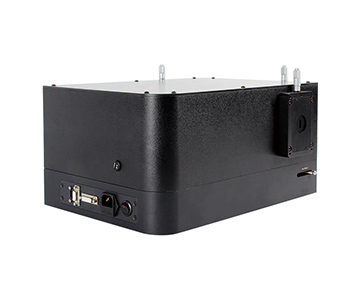
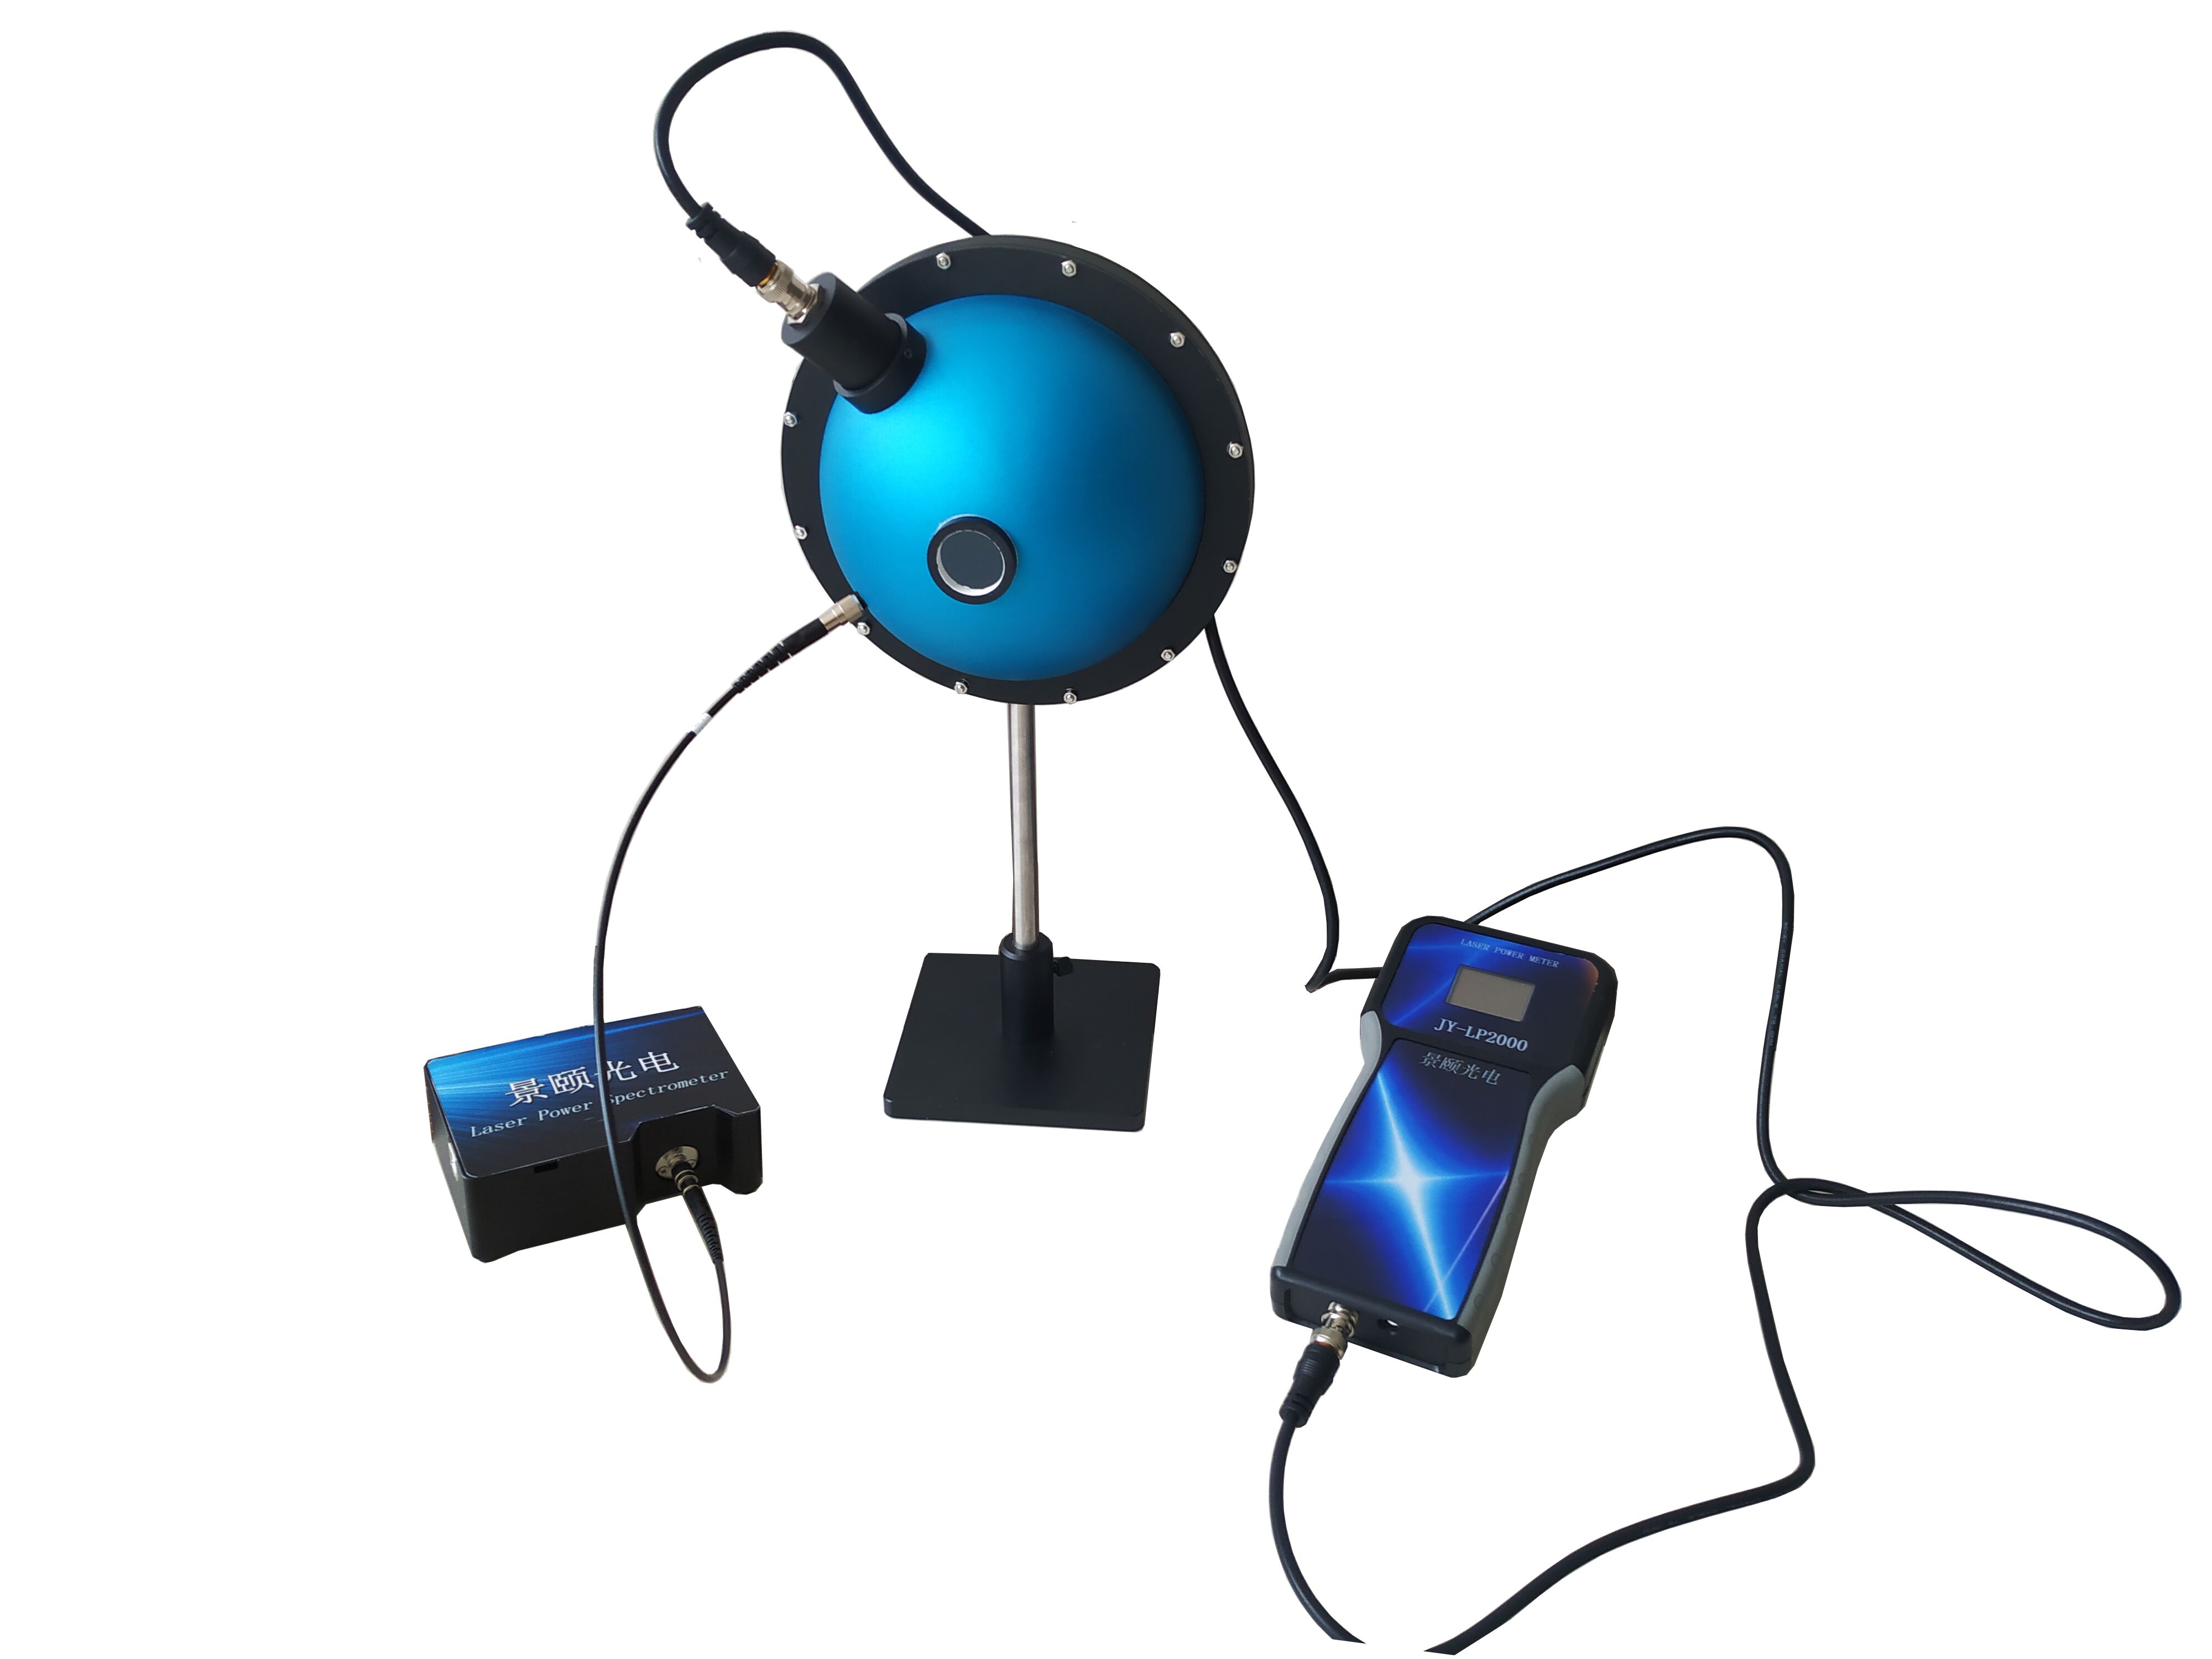
Selecting a fiber optic spectrometer for production-line optical inspection requires moving beyond catalog peak specifications to enforceable metrics: wavelength accuracy, dynamic range, trigger synchronization, and certification compliance. In LED lighting, agricultural food monitoring, pharmaceutical, and semiconductor optical testing, spectral data integrity directly impacts batch acceptance and audit readiness. This guide deconstructs procurement into five decision steps, evaluates three price tiers ($15K/$30K/$60K+ class), and introduces a 10‑question verification checklist. A横向 comparison table and POC validation methodology help buyers translate optical parameters into traceable, production‑ready data.
Why Production‑Line Spectral Data Often Fails Trust Checks
During a night shift at a contract optics workshop, a batch of lenses cleared incoming inspection at the supplier’s lab but showed a 0.37 absolute deviation in transmittance when retested on the production line. The root cause was not the samples; it was the measurement system. The spectrometer’s integration time was nominally 1 ms, but trigger jitter allowed ambient noise to swallow weak‑light samples. The wavelength range was advertised as “broadband,” yet no repeatability data under temperature drift was provided.
Such incidents are common in spectrometer procurement. Buyers chase “high sensitivity” and “wide dynamic range” on datasheets, only to discover during QC that reference‑board reflectance drifts, inter‑batch variation expands, and no metrological traceability chain exists for audit trails. For B2B manufacturers, a single compliance gap in a spectrometer can cascade into full‑batch reinspection costs exceeding $152,000 annually.
Selection cannot rely on brochure peaks. Parameters must be stress‑tested against real‑line conditions: vibration, thermal drift, fiber coupling errors, and software calibration logic. The following five‑step framework turns “can buy” into “dare use.”
Step 1: Break Measurement Needs into Verifiable Granularity
Detector Type Follows the Measurement Object
Transparent part transmission, LED color, and fluorescence probing demand continuous UV‑Vis‑NIR response. Near‑IR component analysis requires InGaAs detectors sensitive beyond 900 nm. A silicon‑based detector covering 180–1100 nm serves general optical tests, while dedicated InGaAs arrays (900–1700 nm or 900–2500 nm) handle moisture, oil, and pharmaceutical content analysis. These two classes are non‑interchangeable.
Precision Demands Split into Two Layers
Repeatability drives batch sorting; absolute accuracy governs standard transfer. For relative binning on the line, wavelength repeatability and integration‑time stability suffice. When metrological traceability is required (e.g., ISO/IEC 17025‑aligned calibration), A/D bit depth, dark noise, and thermal control become decisive.
Application Scenario Dictates Form Factor
R&D benches tolerate larger footprints, while production integration demands compact size, USB power, and hardware triggering. Outdoor or cold‑chain inspections push operating‑temperature limits; some units support –20 °C startup, whereas standard tiers stop at 0 °C.
Step 2: How to Read Core Parameters Without Being Misled
Wavelength Coverage Is Not a “Wider‑Is‑Better” Game
A single‑grating broadband platform often collapses in resolution at the edges. Segmented grating configurations within 200–1100 nm can achieve ~0.9 nm resolution at 25 µm slit width. Buyers must ask: “Which spectral band contains my feature peak, and what is the resolution in that specific segment?” Total bandwidth numbers alone are meaningless.
Cooling and Dark Noise: The Lifeline of Weak‑Light Measurements
In near‑IR detection, every degree of detector temperature rise elevates dark current. Deep‑cooling to –15 °C to –20 °C suppresses dark noise below 100 electrons, enabling signal‑to‑noise ratios up to 10,000:1. Uncooled economy tiers saturate or drown in noise during long‑integration fluorescence or low‑light tasks.
Bit Depth and Dynamic Range Must Be Evaluated Together
A 16‑bit A/D converter fits routine transmission/reflection. An 18‑bit system paired with 570 kHz sampling preserves both intense main peaks and weak shoulder features. A dynamic range of 50,000:1 means a single spectrum can display a strong primary peak without clipping while still resolving low‑level tails.
Trigger Synchronization Determines Line Throughput
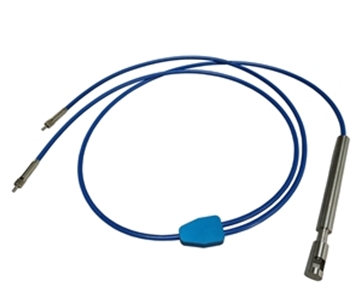
Production is not single‑shot photography. Hardware, synchronous, and software triggers must all be present; missing any causes frame loss in high‑speed sorting. Standard SMA905 fiber with USB 2.0 is baseline, but automation requires confirmed external trigger pins and programmable I/O.
Step 3: Price Tiers and Total Cost of Ownership
Hidden Costs of Imported Baseline Tier
Overseas portable spectrometer brands hold strength in Raman and custom light sources, but their fixed fiber‑optic lines carry mid‑to‑high pricing. Post‑acquisition model consolidation raises concerns over legacy part supply. Single‑unit purchases offer moderate value; volume OEM licensing and firmware upgrades are separately quoted.
Practical Balance Point of Mainstream Domestic Tier
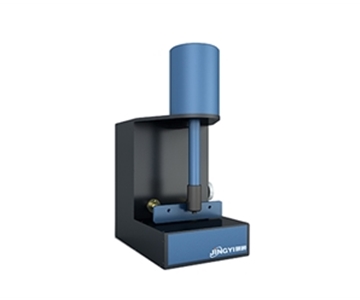
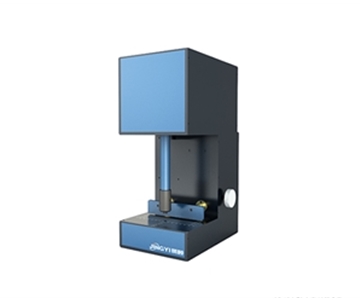
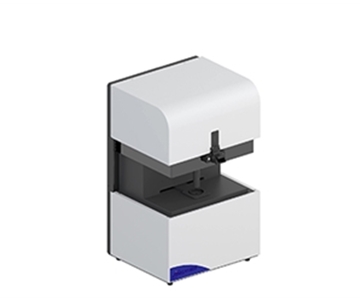
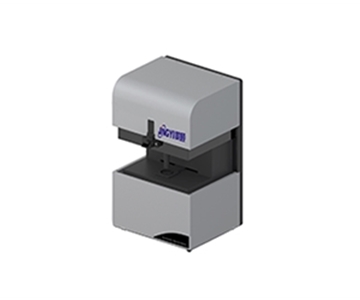
Mainstream domestic platforms now cover most industrial scenarios with wide‑band silicon CCDs, deep‑cooled InGaAs, and crossed Czerny‑Turner optics. Representative configurations include 3648‑pixel broadband units, 1044×64 cooled CCDs, and 256‑pixel NIR modules—mapping to general inspection, low‑light research, and rapid composition screening respectively. Procurement should match tier to application rather than chasing top‑tier specs.
TCO Extends Beyond the Unit Price
A three‑year TCO calculation must include probe wear, fiber replacement, SDK licensing, calibration frequency, and downtime. Deep‑cooling units cost more upfront due to thermoelectric modules but eliminate dark‑field retests and external恒温 chambers. Economy tiers appear cheap, yet rework costs in weak‑light scenarios can erase initial savings.
Candidate Solutions: Horizontal Comparison
| Tier Designation |
Wavelength Range |
Detector |
Cooling |
SNR |
Integration Time |
Bit Depth |
| Economy Broadband |
200–1100 nm |
2048‑pixel CCD |
None |
Moderate |
1 ms–65 s |
16‑bit |
| Mainstream High‑Sensitivity |
200–1100 nm |
Back‑illuminated CCD |
None |
450:1 |
6–10,000 ms |
Standard |
| Deep‑Cooled |
180–1100 nm |
1044×64 Cooled CCD |
–15 °C |
>1000:1 |
2 ms–130 s |
18‑bit |
| NIR Dedicated |
900–1700 nm |
InGaAs Linear |
Optional |
10,000:1 |
0.1–100 ms |
16‑bit |
| Wideband NIR |
900–2500 nm |
Cooled InGaAs |
–20 °C |
10,000:1 |
7.8 ms–64 s |
18‑bit |
All figures are extracted from equipment documentation. For LED and color sorting, the economy broadband tier suffices. Raman or fluorescence work demands deep‑cooled systems. Agricultural moisture, oil quality, and pharmaceutical composition analysis require InGaAs as a hard threshold.
Per ISO 9050 (or equivalent ASTM E903) for total transmittance and reflectance testing, complete metrological traceability must be confirmed. The broadband systems above, when calibrated with reference standards, satisfy these conditions. Buyers should not be misled by “10,000:1 SNR” claims—that figure applies to cooled NIR weak‑signal conditions; UV‑Vis performance depends on wavelength accuracy and stray light. The correct selection logic: fix the wavelength band first, then noise performance, finally mechanical structure.
Step 4: Supplier Evaluation Dimensions
Customization Boundaries Reveal Technical Depth
Ask three questions: Can the slit be swapped to 25/50/100 µm? Can the wavelength range be offset to your required window? Does the SDK output raw counts instead of only processed curves? Platforms supporting slit customization, band shifting, and UART/USB dual interfaces indicate a reconfigurable optical engine.
Delivery and Quality System
Small‑batch custom delivery, ISO 9001 certification, and modular assembly directly impact long‑term maintenance. One day of line downtime costs far more than any equipment price difference.
Application Support, Not Sales Talk
A qualified supplier inquires about sample transmission, target integration time, and process constraints before proposing a model. Procurement teams should警惕 distributors who send glossy brochures without asking about operating conditions.
Step 5: Procurement Negotiation and Pitfall Checklist
Specifications to Lock in Contracts
Wavelength accuracy must be written into acceptance criteria (e.g., ±0.3 nm for broadband tiers). For NIR tiers, demand dark‑current comparison charts; for cooled units, specify achievable temperature and cool‑down time. Software version, calibration coefficients, and raw data export format should also be listed.
Ten‑Question Verification Checklist
1.Where does my target feature peak fall, and what is the resolution in that segment?
2.Which slit sizes are available, and what is the wavelength drift after slit change?
3.How does dark noise change at 40 °C without cooling?
4.Is the 1 ms integration‑time floor a real measured value or just theoretical?
5.Are there实测 trigger‑delay and jitter data?
6.Is the A/D bit depth a true output or interpolated?
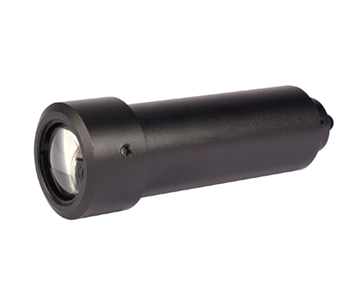
7.Are fiber interfaces standard SMA905, and can collimating lenses be added?
8.Can the SDK access raw counts, and which programming languages are supported?
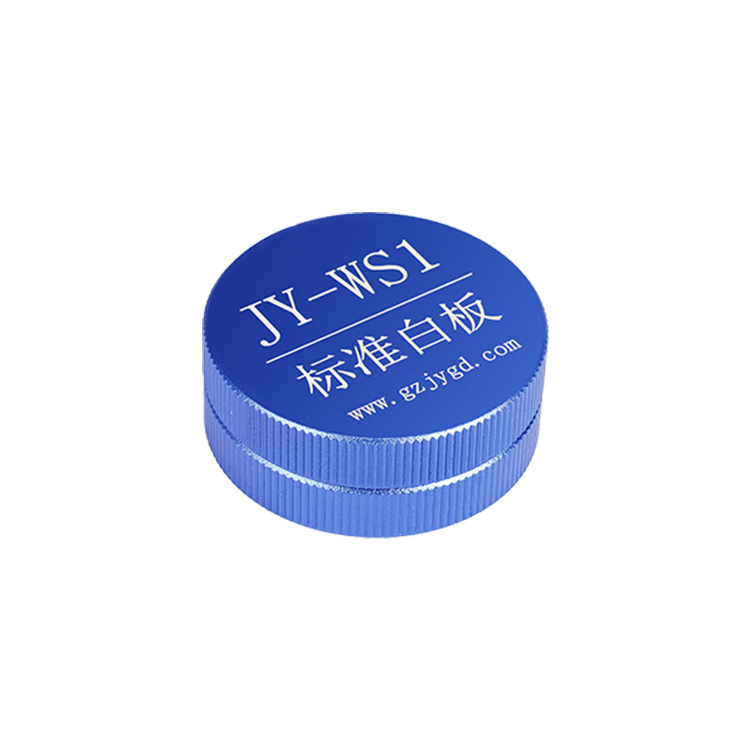
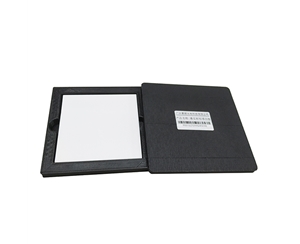
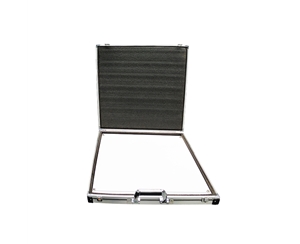
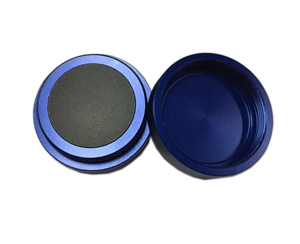
9.Are calibration intervals and reference‑board traceability certificates included?
10.Is firmware upgrade charged, and how many years of post‑discontinuation supply are guaranteed?
Negotiation Closing Point
Secure free sampling not by reviewing polished demo graphs, but by running “1,000 cycles of your sample under your line’s actual rhythm.” Maintenance terms must specify response time, loaner unit policy, and replacement coverage for fibers and thermoelectric coolers.
POC Validation Methodology
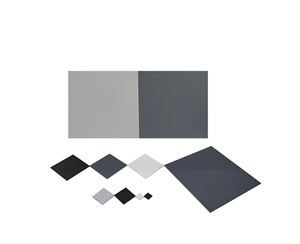
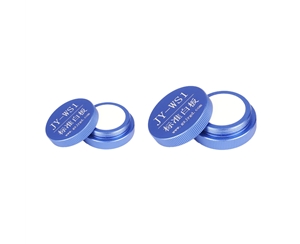
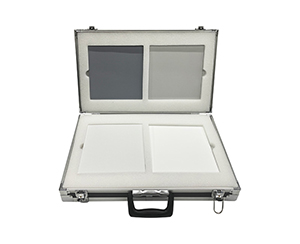
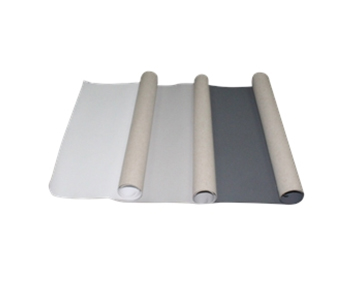
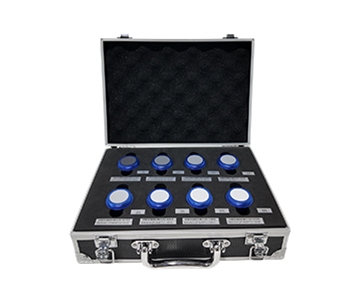
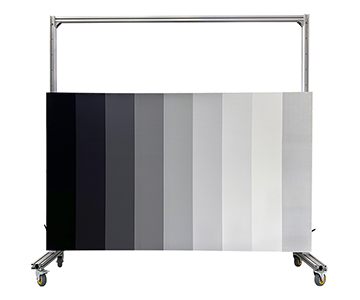
Use three reflectance reference boards of known values, collecting 50 spectra at 25 °C and 40 °C each. Evaluate two metrics: within‑temperature wavelength repeatability (standard deviation) and baseline drift after heating. Deep‑cooled units should show significantly lower drift than uncooled counterparts.
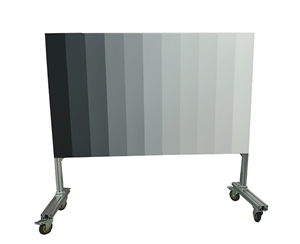
Conduct a weak‑light step test using neutral density filters to progressively attenuate light, recording saturation point and floor noise. Dynamic range is not the ratio on a spec sheet; it is the practical window where “the strongest peak does not clip and the weakest peak remains reproducible.”
Trigger synchronization testing should employ a production‑line simulation pulse: send 500 consecutive external triggers and check frame‑loss rate and integration‑start jitter. Finally, validate NIR models with standard solutions, verifying stability of principal component regression residuals.
Compliance and Calibration Perspective
When optical inspection enters pharmaceutical, automotive, and semiconductor processes, equipment must prove not only “can measure” but “measurement is traceable.” Transmission, film thickness, and LiDAR reflectivity calibration all involve standards conformance.
In global metrology markets, traceability chains anchored to NIST or national metrology institutes are essential. Procurement agreements should reference applicable ISO/IEC 17025 calibration requirements and, where relevant, SEMI standards for optical measurements. Compliance is not a stamp‑collecting exercise; it is an end‑to‑end auditable chain from slit selection, dark‑field calibration, to report format.
Objective Limitations
Domestic spectrometer platforms perform competitively in general UV‑Vis and NIR bands, but boundaries remain in ultra‑low‑light long‑integration, ultra‑high‑resolution deep‑UV, and complex chemometric model libraries. Deep cooling suppresses dark noise at the cost of power consumption and footprint—a trade‑off for portable scenarios.
Additionally, single‑platform broadband designs naturally degrade in resolution at band edges; total bandwidth cannot substitute for local performance. Even the most complete standards compliance relies on users periodically re‑verifying with reference boards—the instrument does not replace disciplined quality control habits.
Common Selection Traps Engineers Encounter
Focusing solely on peak SNR while ignoring thermal conditions; mistaking total pixel count for resolution without checking slit‑grating matching; using slow research modes to fake production speed; treating USB power as plug‑and‑play while neglecting fiber alignment losses; signing contracts without wavelength accuracy clauses, leaving acceptance as a subjective “looks okay” exercise.
A typical error: purchasing a silicon‑based broadband unit for NIR applications, then blaming samples when response drops off a cliff beyond 900 nm. A wrong first step in selection renders all subsequent retests useless.
Frequently Asked Questions
Q1: How should I select a cooling tier for production‑line weak‑light fluorescence?
Prioritize deep‑cooled CCD or InGaAs systems for long‑integration, weak‑signal scenarios. Uncooled back‑illuminated CCDs exhibit floor noise that can swallow shoulder peaks.
Q2: Why can’t I distinguish feature peaks even though the wavelength range is very wide?
Bandwidth and resolution are distinct. Slit widening and grating edge aberrations increase FWHM. Always check the actual resolution in your band of interest rather than the total range.
Q3: How can I quickly判断 whether a supplier’s parameters are inflated?
Retest with reference boards under elevated temperature and trigger conditions, then examine repeatability and drift. Lock wavelength accuracy, floor noise, and dynamic range as hard指标 in the contract.
Q4: How should I prioritize tiers when budget is limited?
First secure wavelength coverage, then trigger and stability,最后 cooling. LED sorting can use economy broadband; composition analysis demands NIR; low‑light research justifies deep cooling.
Q5: How can I independently verify long‑term equipment stability?
Establish a monthly baseline of dark‑field and light‑field measurements using reference boards, logging wavelength shift and noise distribution. Retain data aligned with calibration standards rather than relying on a single factory report.
Conclusion
Spectrometer procurement is essentially translating optical parameters into production‑line‑accountable data. Clarifying tier, cooling, trigger, and traceability transforms spec‑sheet shopping into a durable, auditable investment.
For detailed specifications and application notes on fiber optic spectrometers, search “Jingyi Optoelectronics fiber optic spectrometer” or visit our technical library.
About This Guide
Data Sources
: Product technical documentation, ISO/IEC 17025 general requirements for calibration, NIST traceability frameworks, SEMI optical measurement standards.
Author
: Cai Xiaodong, Senior Application Engineer, Jingyi Optoelectronics, 12 years in optical metrology and spectrometer selection.
Disclosure
: Jingyi Optoelectronics manufactures fiber optic spectrometers and related optical inspection equipment. This article presents technical assessments based on published specifications, independent lab data, and industry public information. No compensation was received from third‑party brands mentioned.
Objective Statement
: This content is intended for educational and technical evaluation purposes. Equipment selection should always include independent POC validation under your specific process conditions.
Last Updated
: November 2026