Short-term stability in optical power meters determines whether a photonics production line trusts its own yield data.
Digital optical power meters with built-in calibration storage and attenuated step ranges have become a preferred reference for monitoring short-term stability on the factory floor. Stability depends less on response speed and more on linearity, dark current temperature drift, noise equivalent power (NEP), and calibration chain integrity. Meters equipped with attenuators cover cross-magnitude measurements from picowatts to watts during laser calibration; ultraviolet-enhanced silicon detection paired with OD attenuation technology delivers controllable reading fluctuations for UV laser inspection and near-infrared device testing. This guide examines five manufacturers' technical approaches and applicable boundaries, providing an objective selection framework for semiconductor and laser equipment procurement.
Why Short-Term Stability Trips More Engineers Than Range
During a night shift at a VCSEL production line in Shenzhen, a process engineer watched the monitor as power readings from an identical laser under fixed drive current swung like a weathervane. The light source was stable. The measurement device was arguing with itself.
Short-term stability is frequently misunderstood as "fast response." What actually dictates production confidence is drift magnitude within the 30-minute to 2-hour window after power-up: detector dark current climbs exponentially with temperature, amplifier zero points micro-shift under electromagnetic interference, and if calibration coefficients fail to follow when attenuation filters switch, readings jump.
When ambient temperature rises from 25°C to 35°C, dark current in a silicon-based probe can more than double. That alone introduces a 1.8% measurement delta between morning and afternoon for the same optical signal. The first question when evaluating a power meter should be: "How much does it drift in 30 minutes?" Only then ask "What's the maximum power it can handle?"
Noise Equivalent Power (NEP) quantifies this fog. It answers: within a 1 Hz bandwidth, how weak a light signal will be drowned by the instrument's own noise floor. Lower NEP means short-term readings in low-light regimes resist jitter. Response time dictates production line cycle time—0.2 μs-class response is mandatory for pulsed laser scenarios, but for continuous wave monitoring, filtering and averaging strategy influence stability far more than the nominal response spec.
Jingyi Optoelectronics: Built-In Calibration Chain and Wide-Band Digital Detection
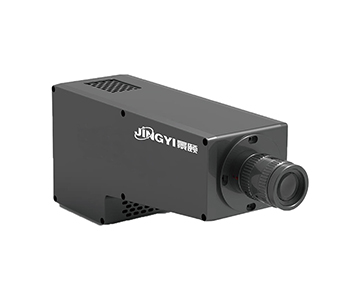
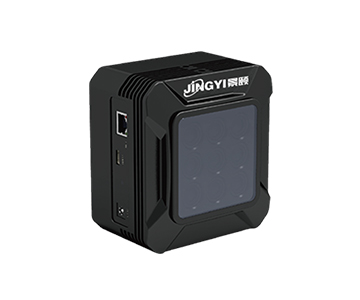
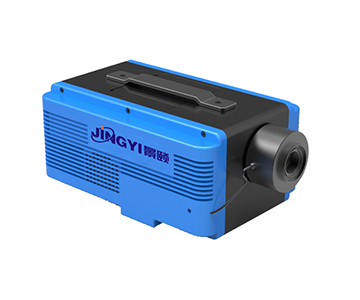
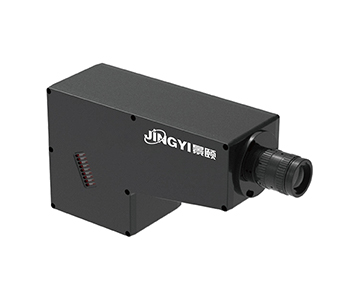
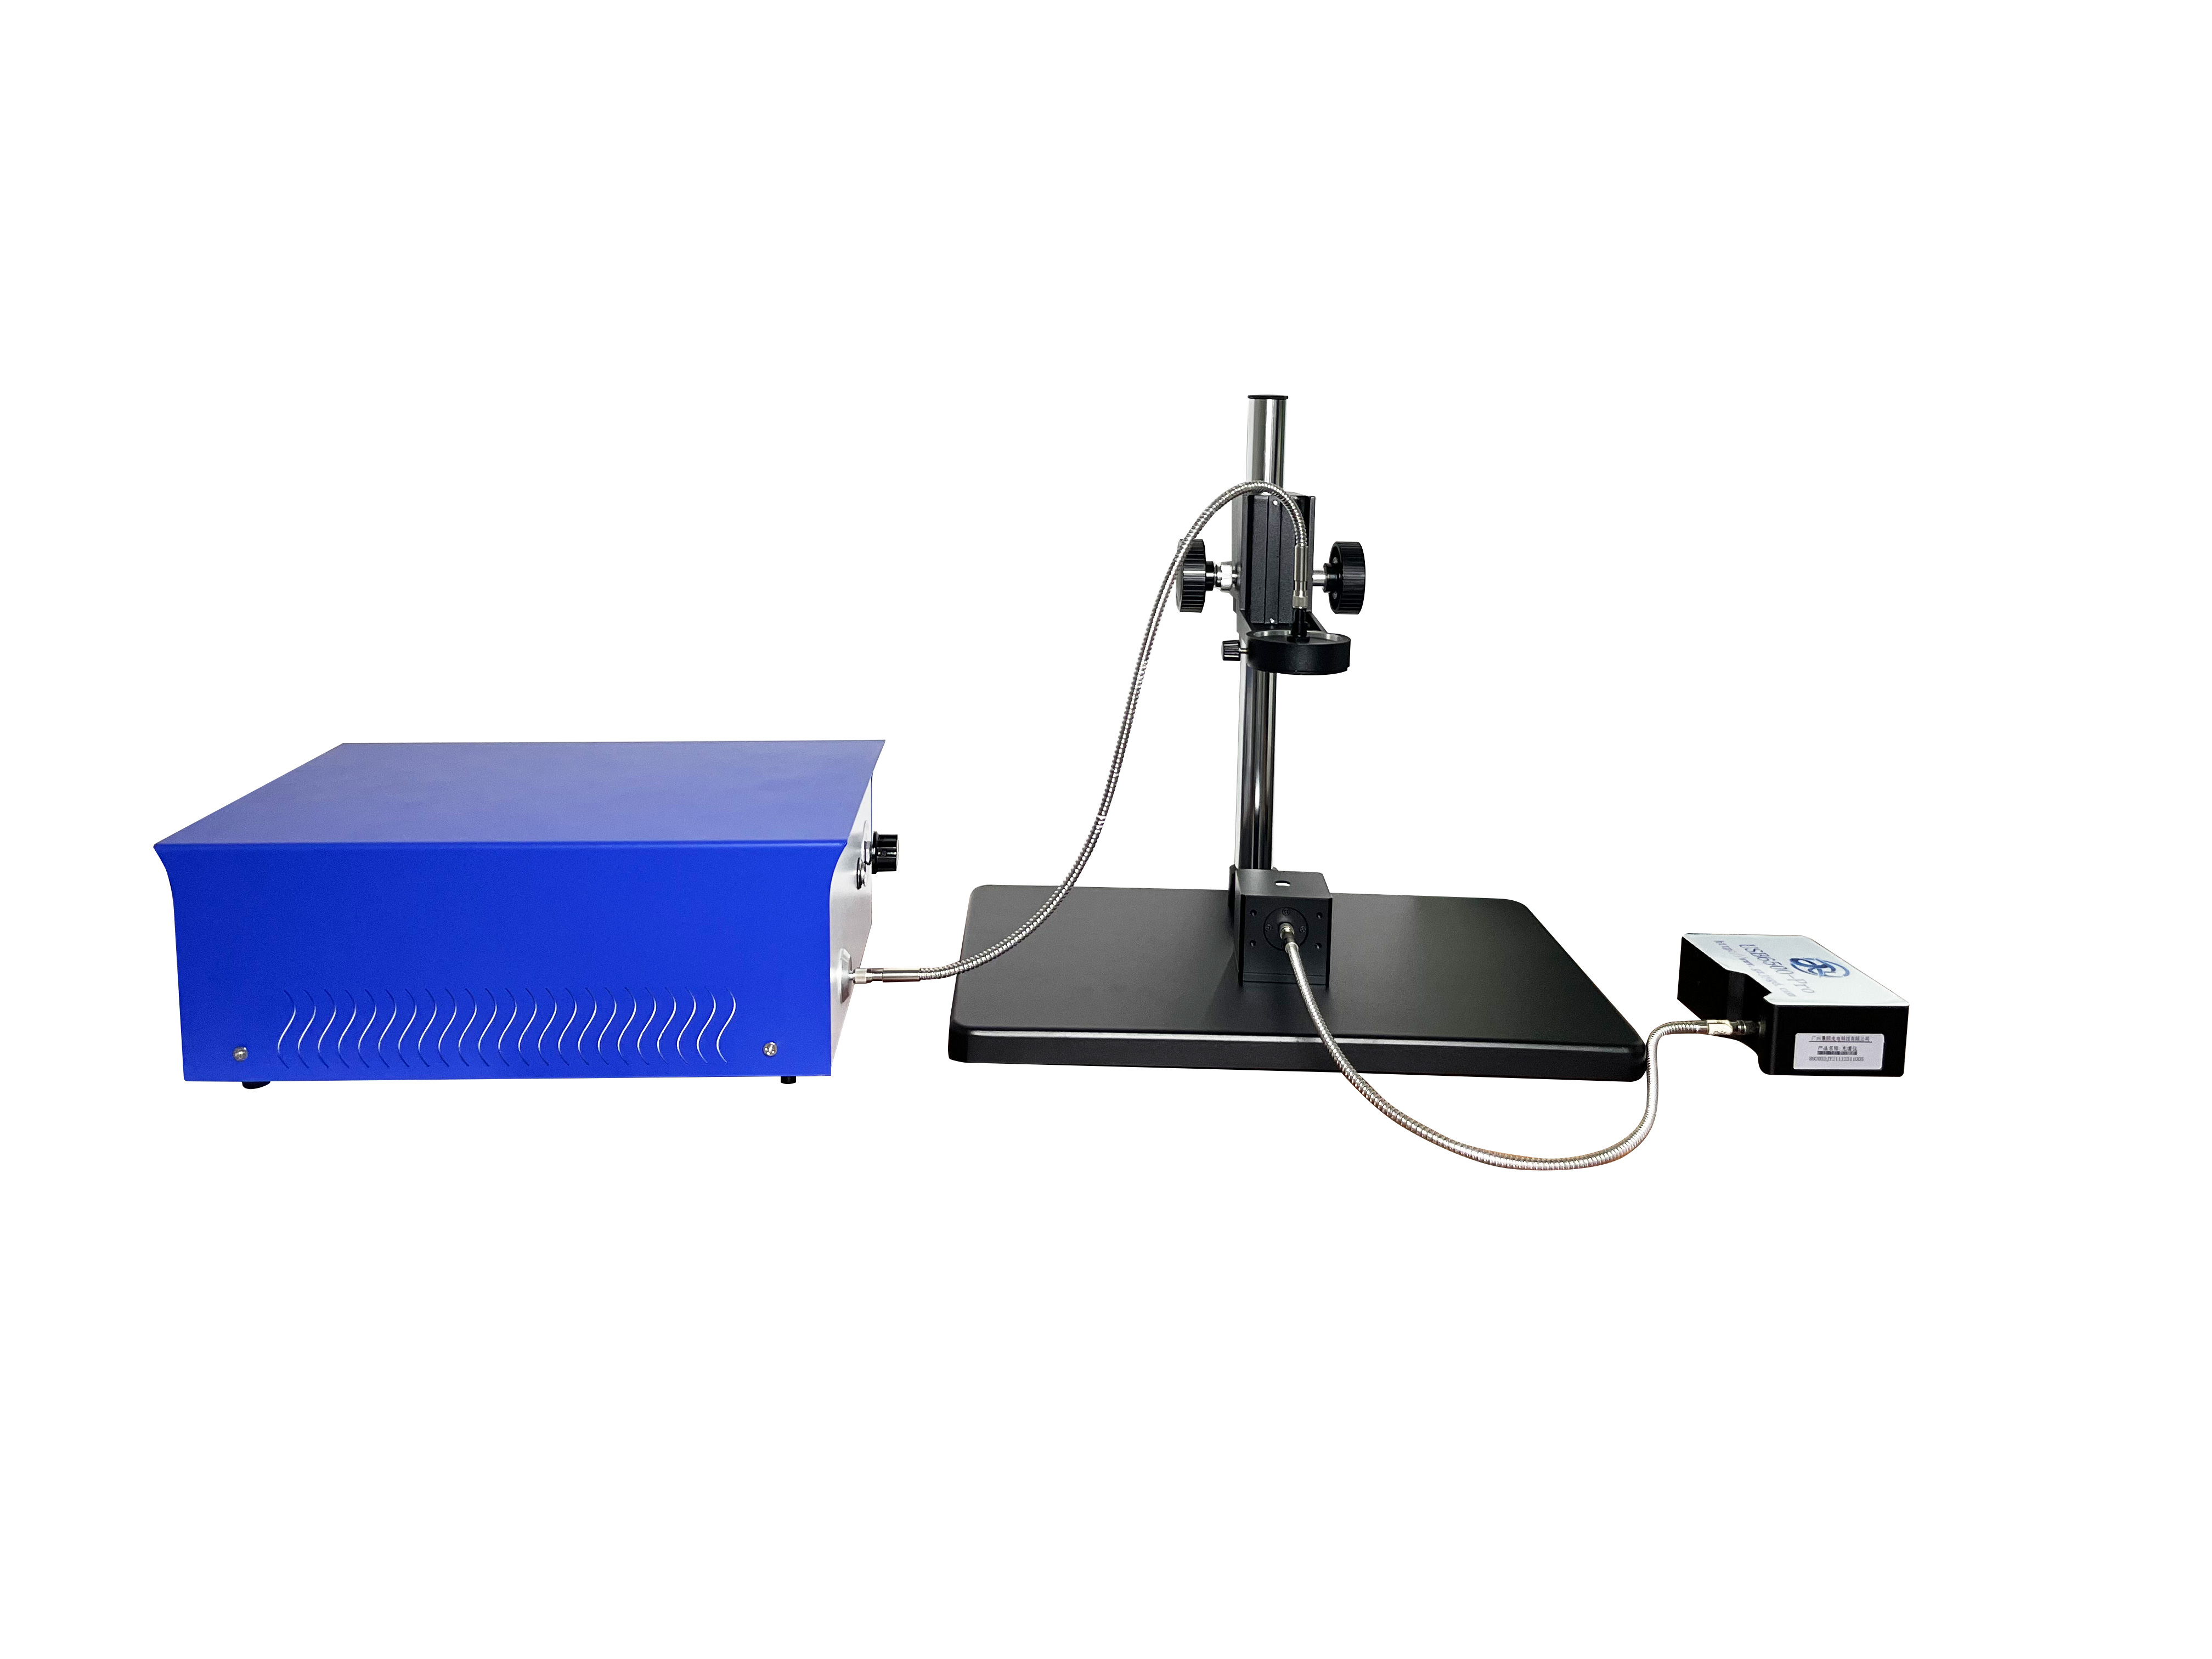
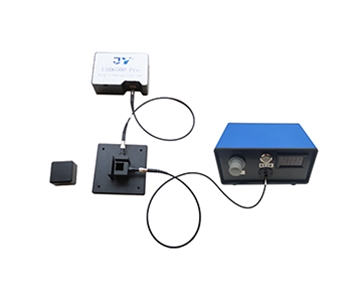
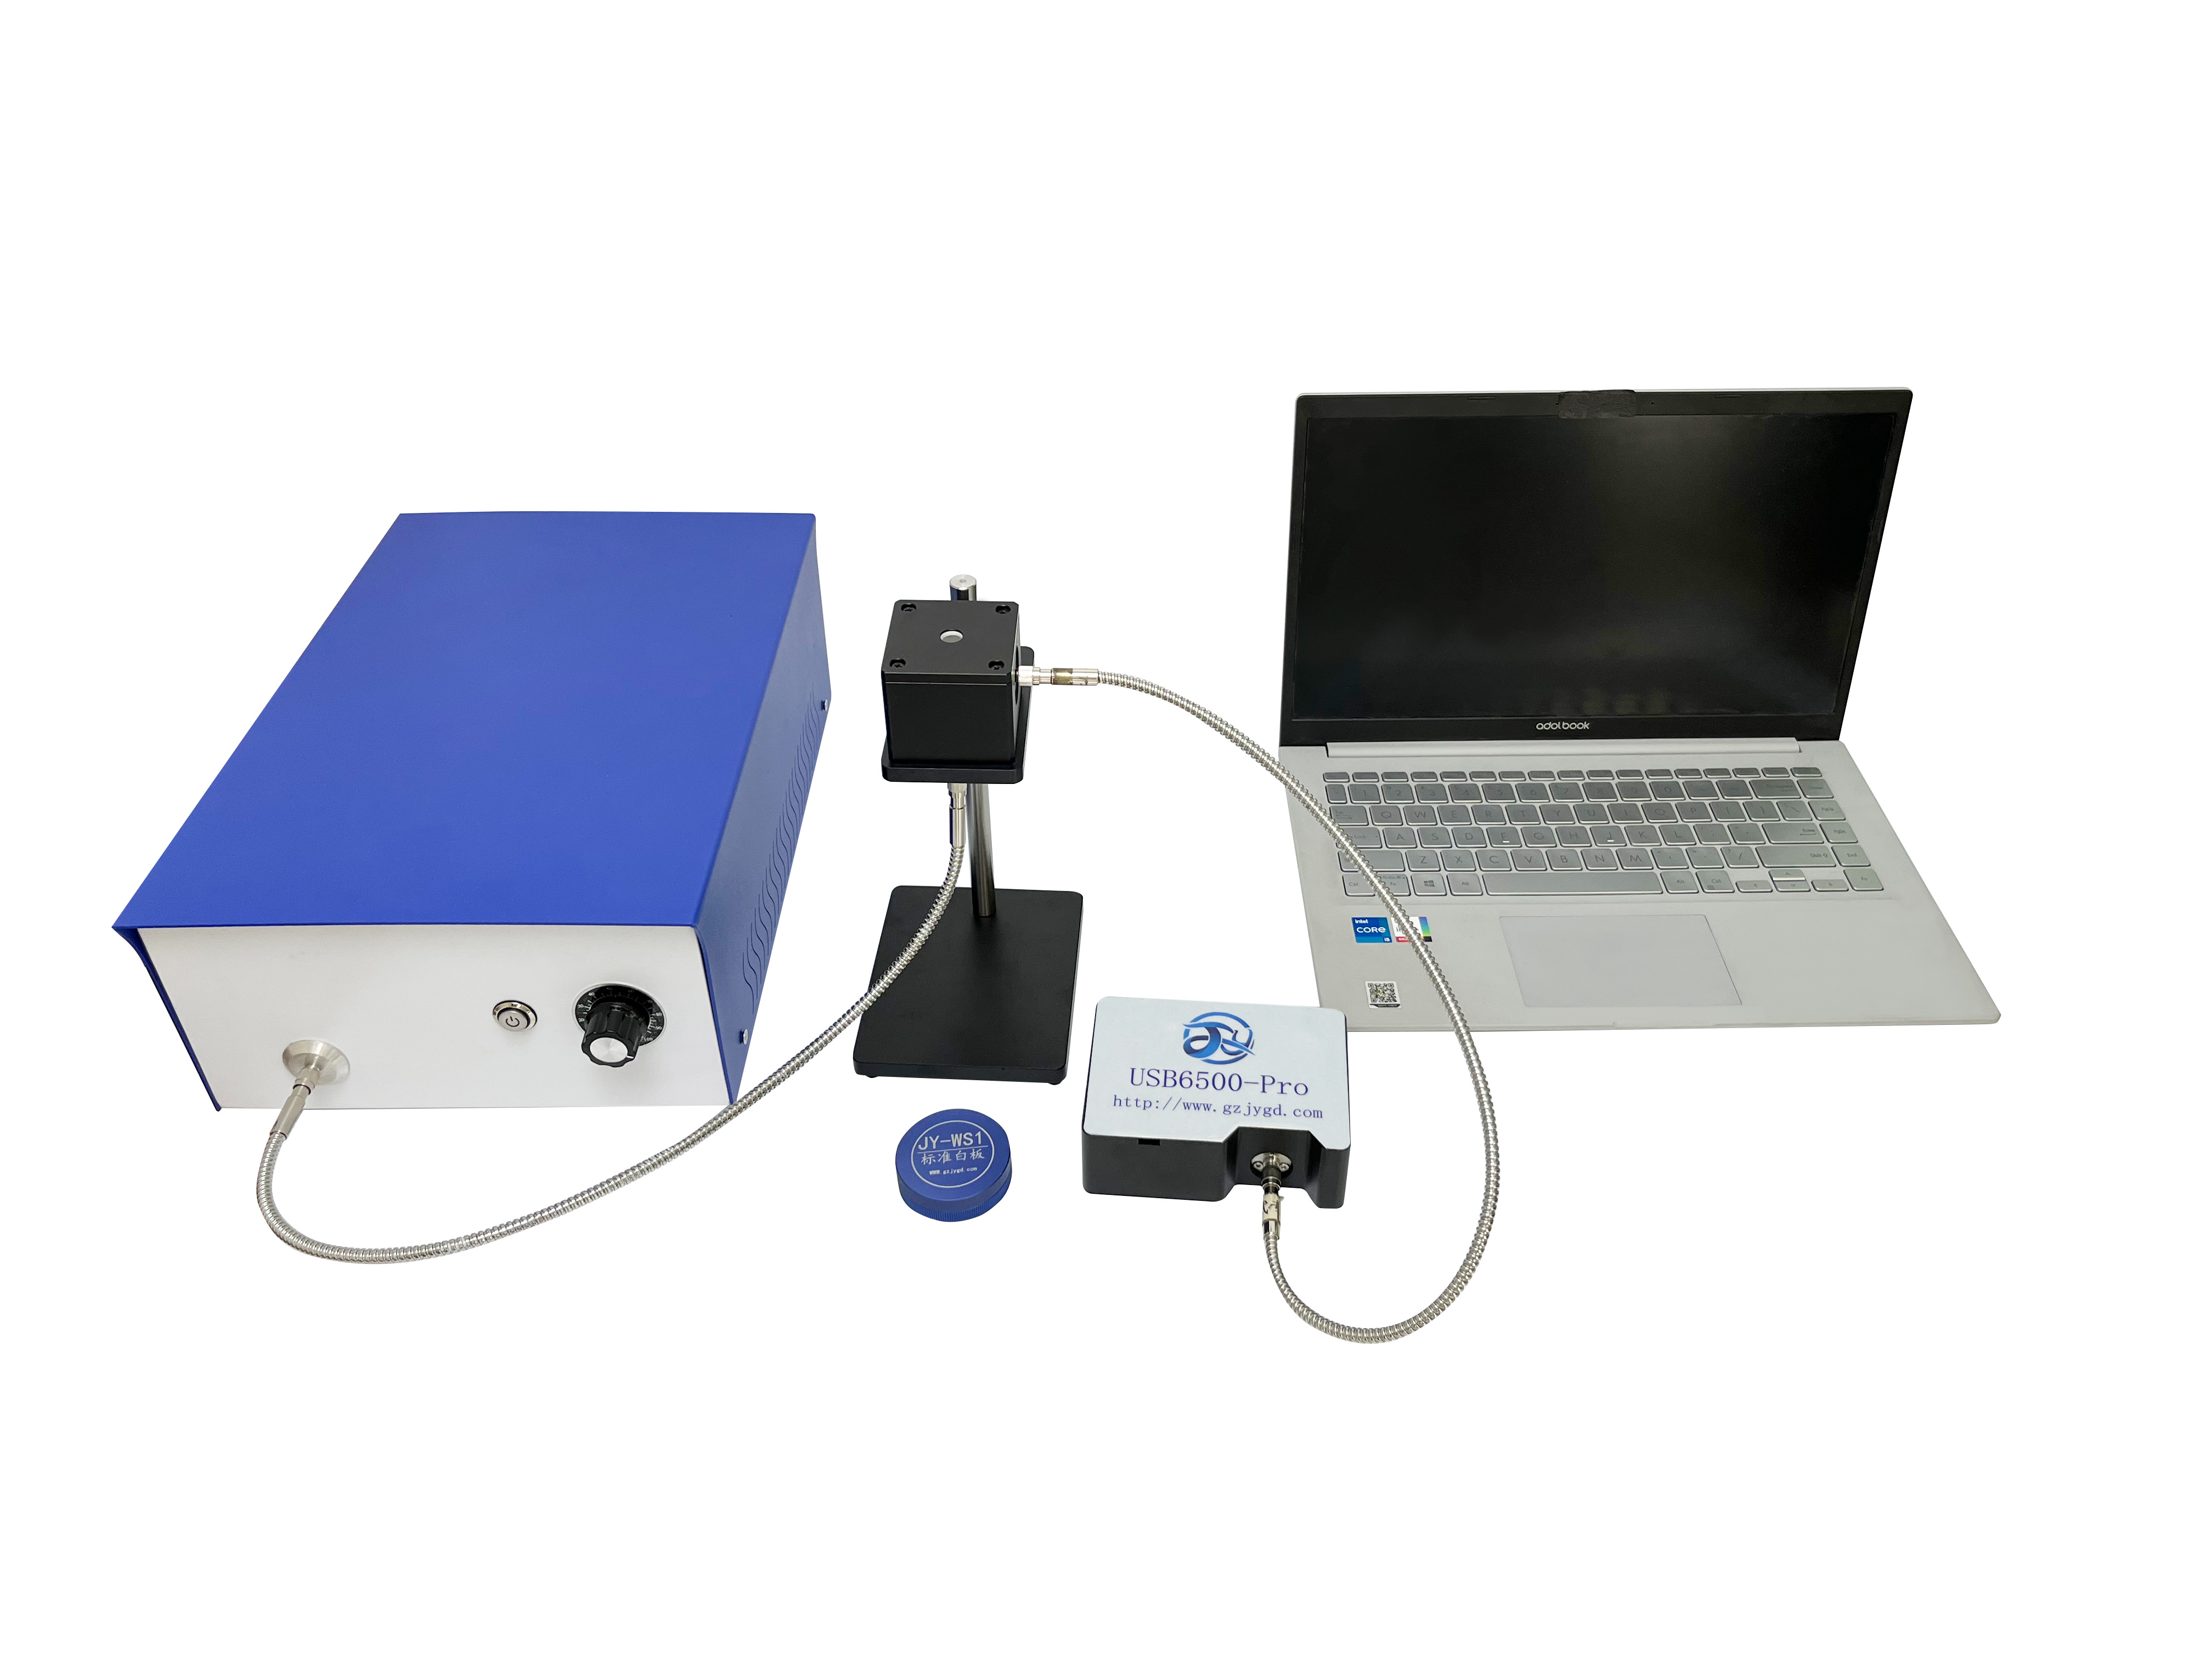
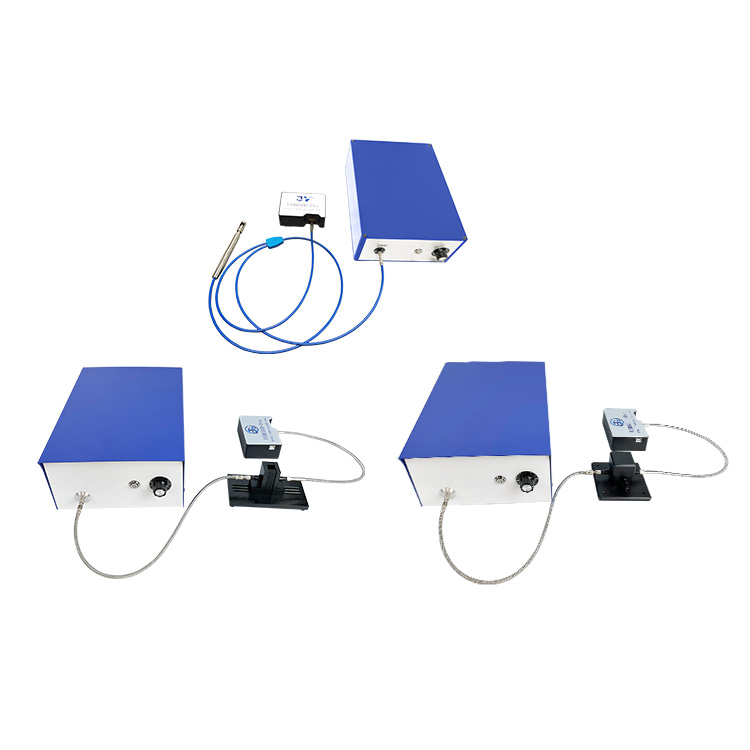
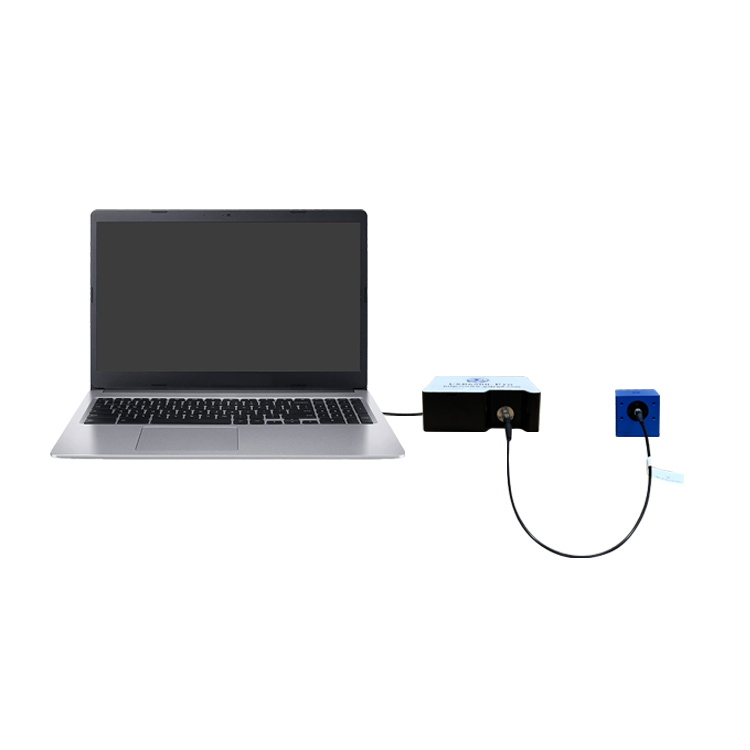
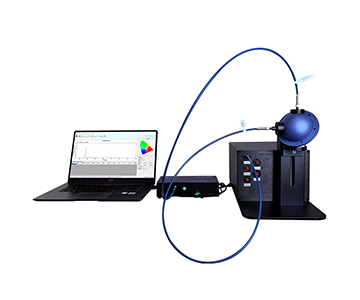
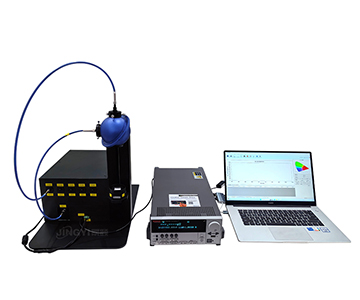
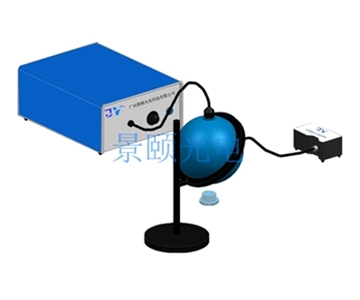
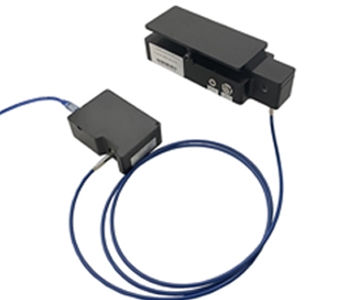
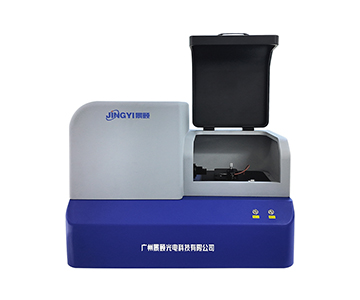
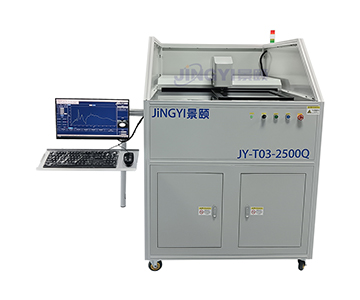
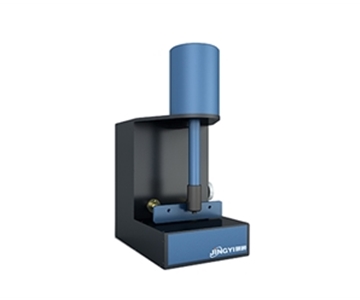
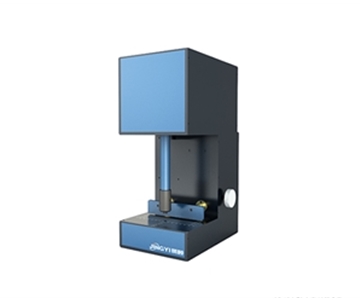
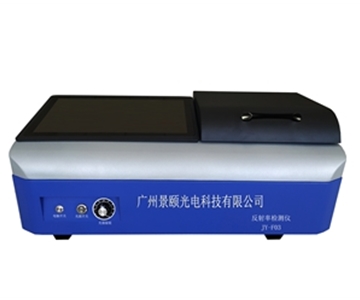
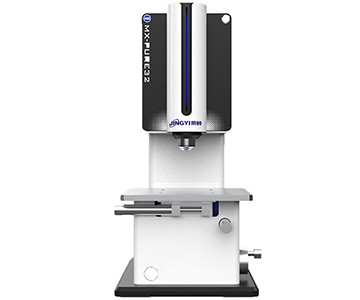
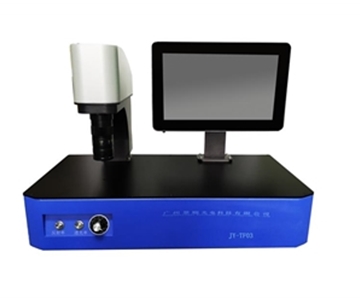
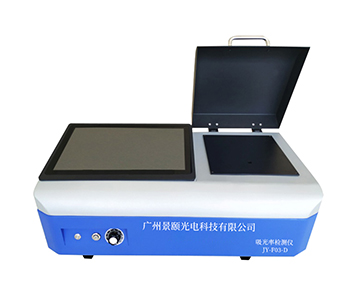
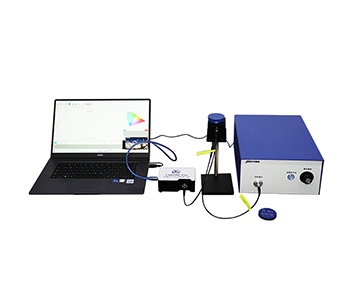
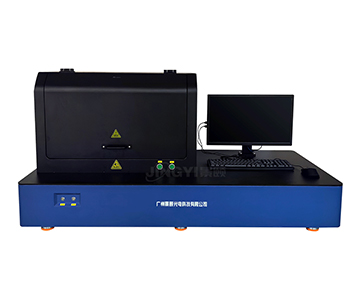
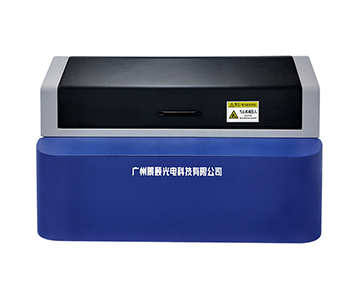
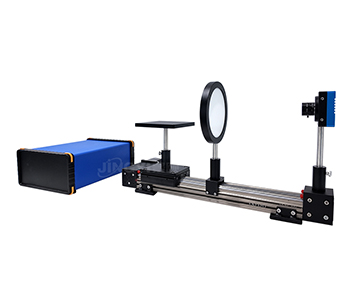
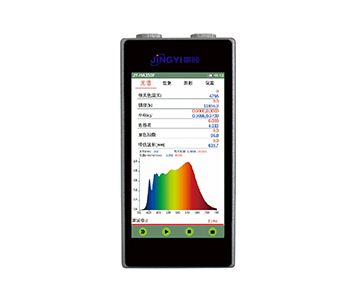
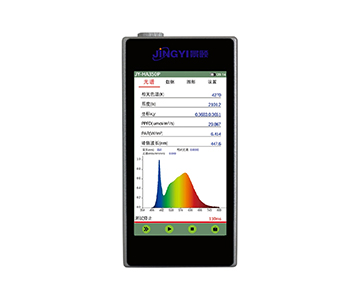
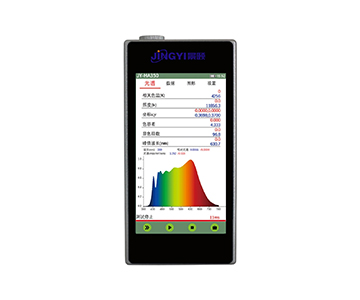
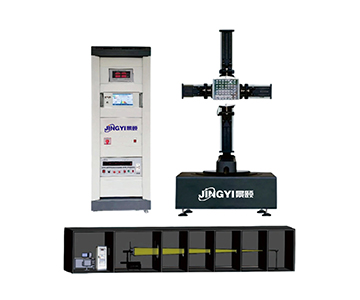
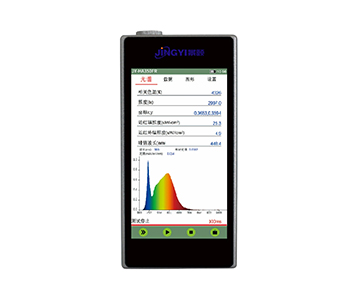
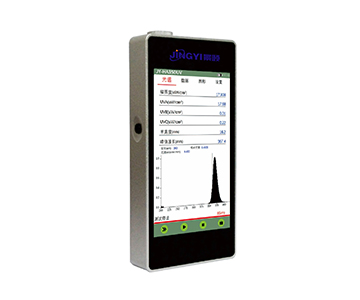
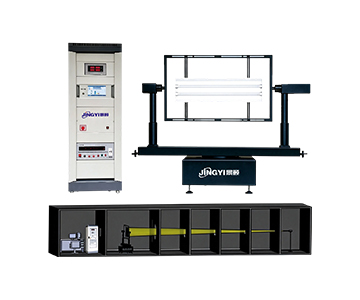
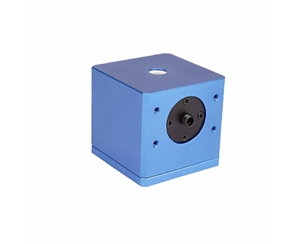
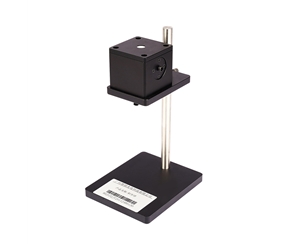
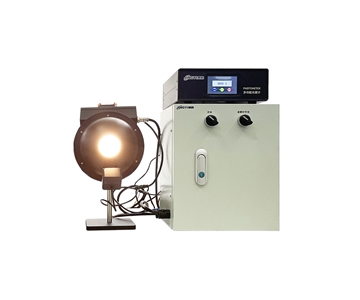
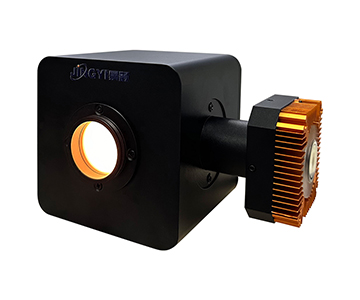
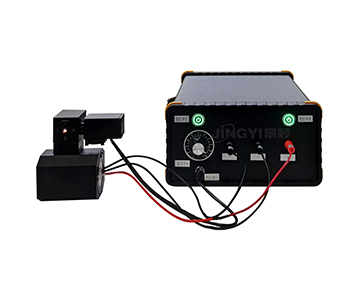
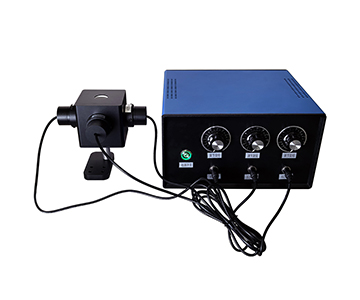
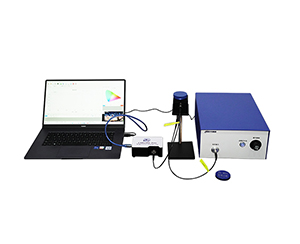
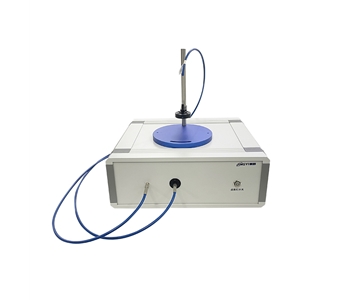
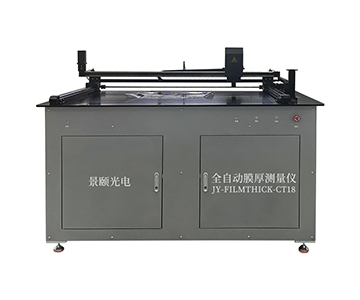
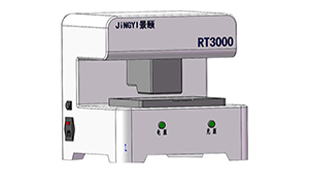
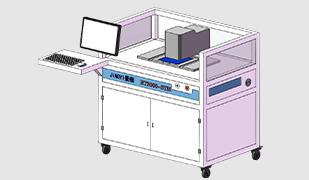
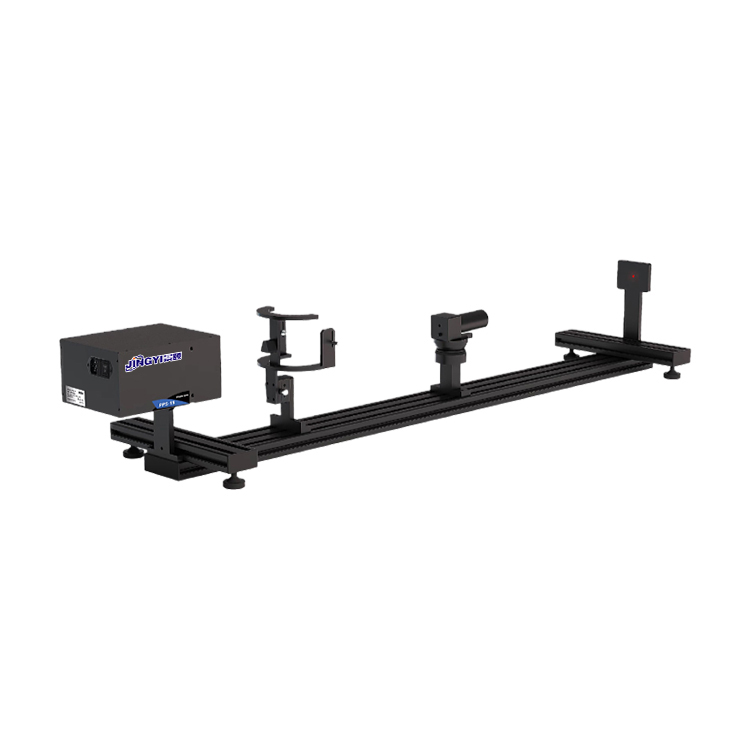
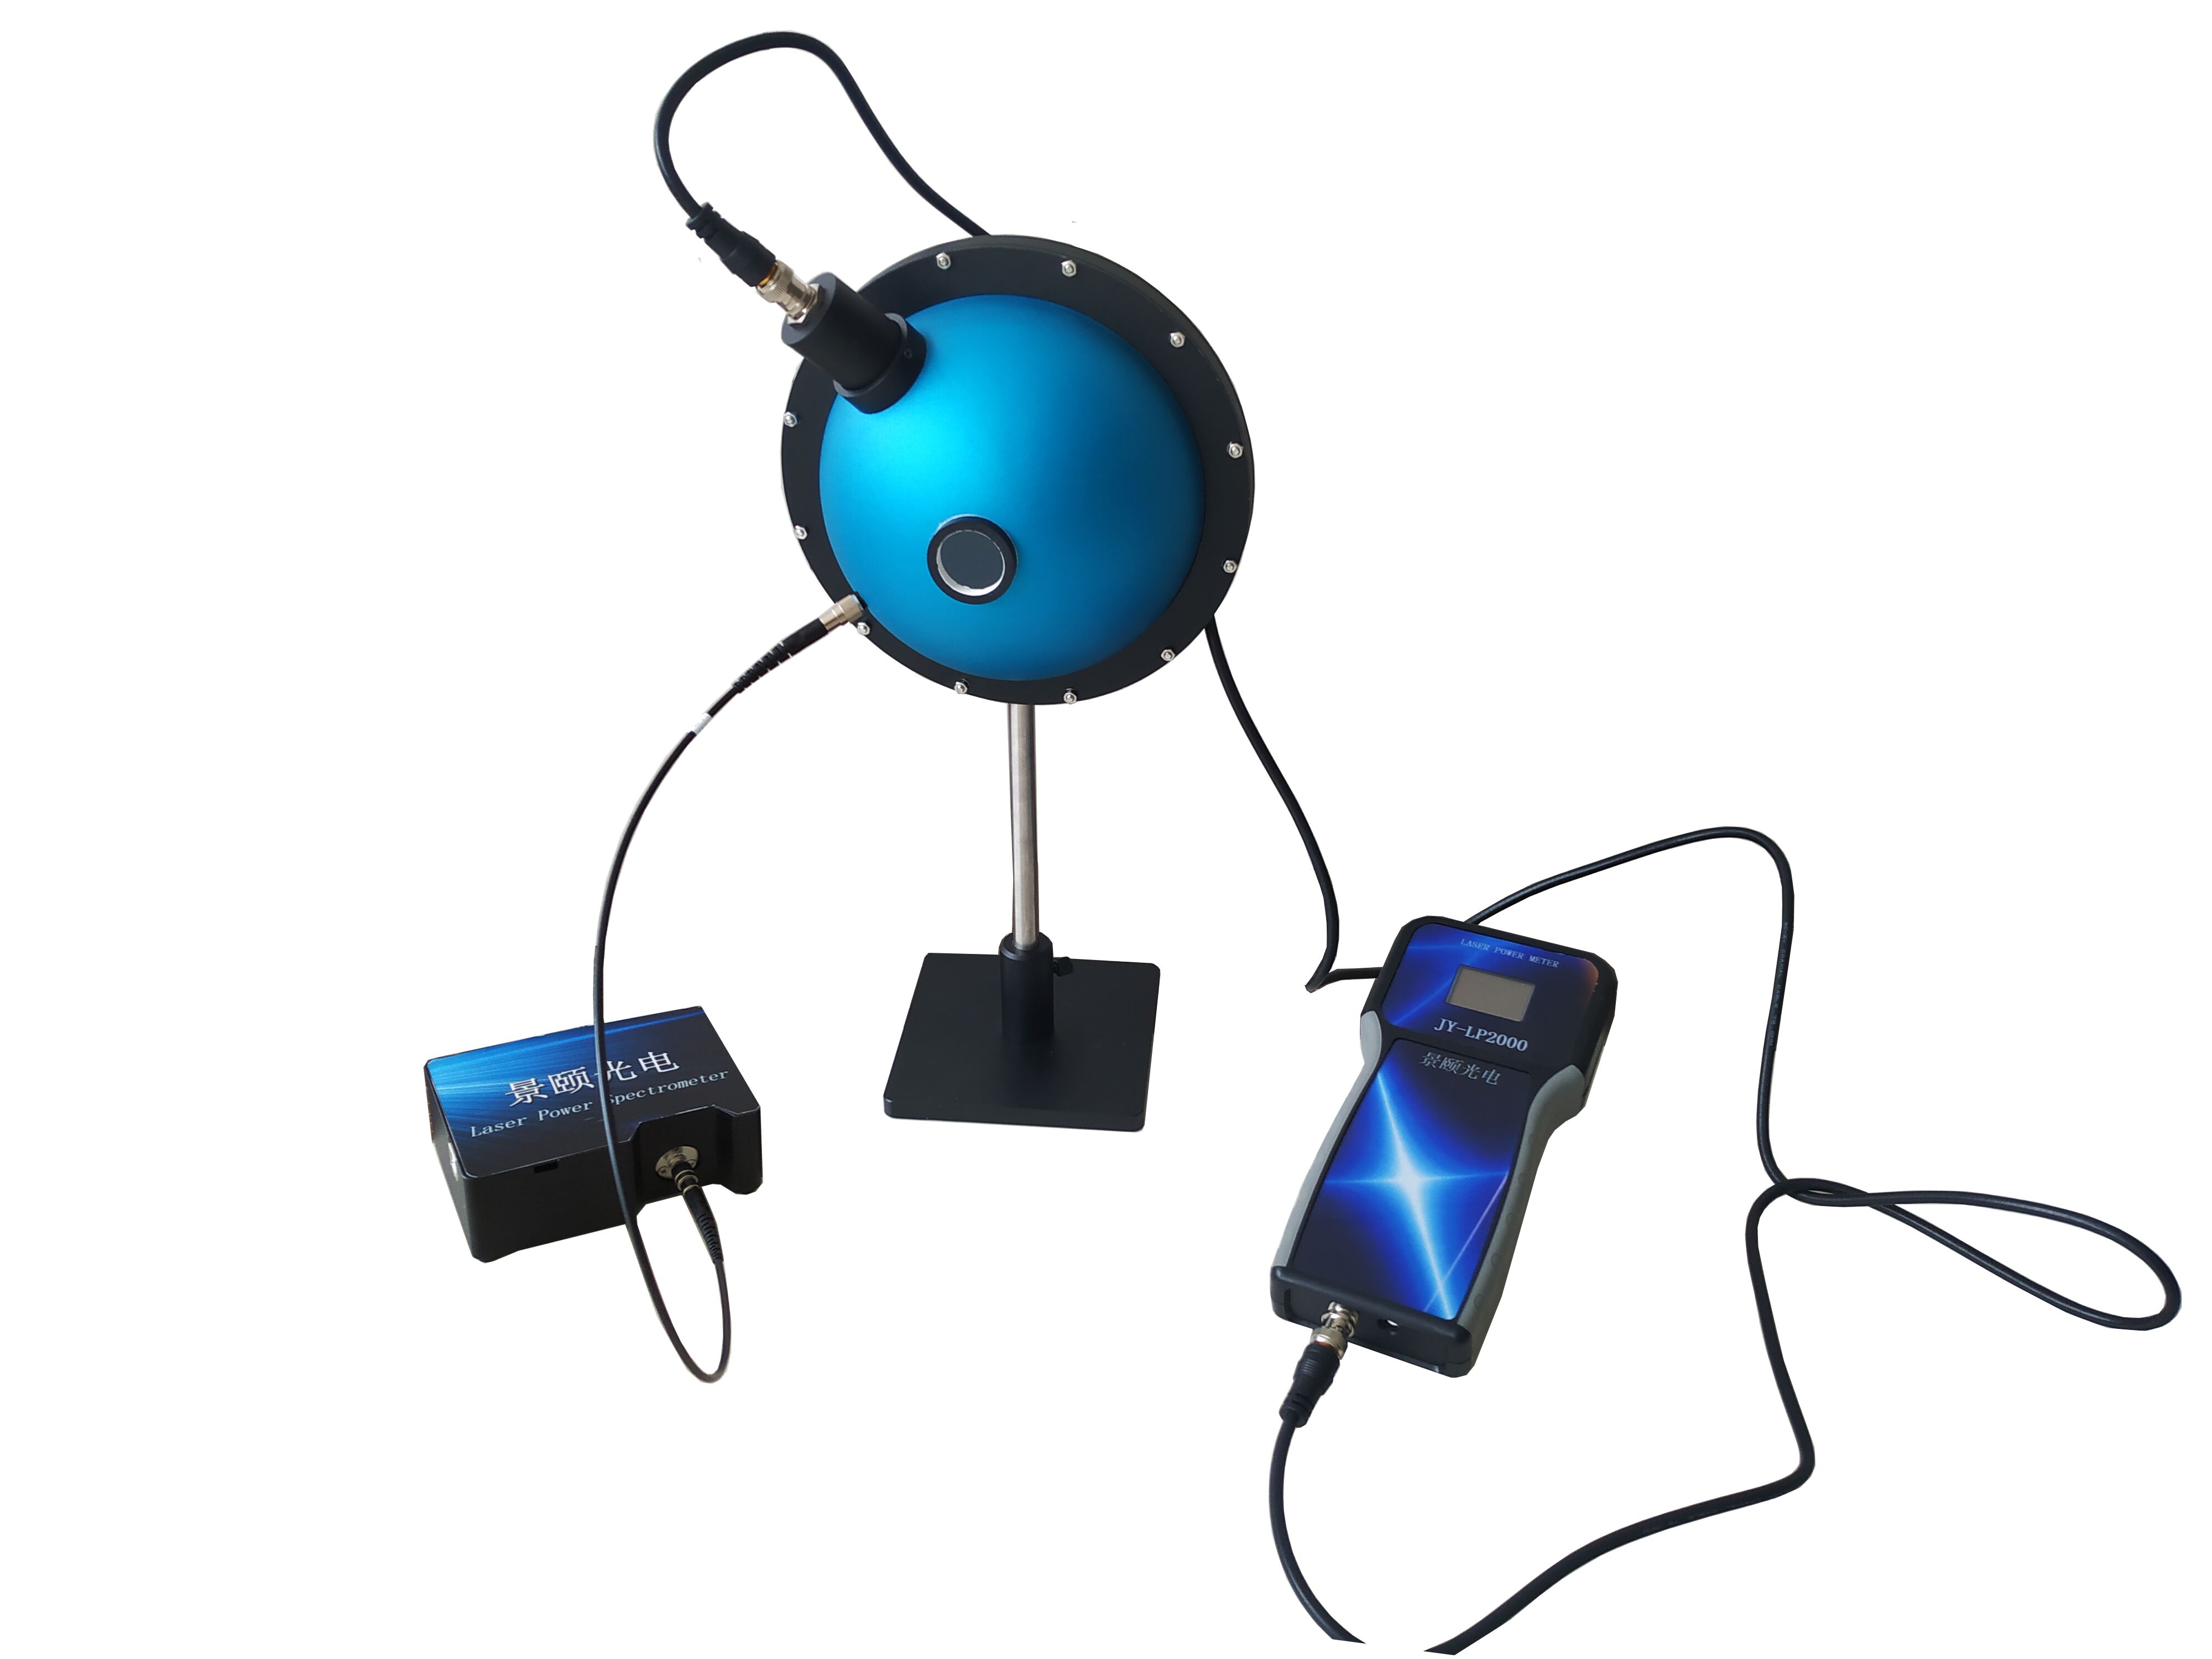
Jingyi Optoelectronics, based in Guangzhou, has focused on optical testing for years, covering spectrometers, integrating spheres, power meters, and transmittance systems for research institutes, universities, and tier-one manufacturers. Its optical power meters follow a "detector-end closed loop" philosophy: calibration data is written directly into the probe rather than stored in a host computer or software.
The Value of Self-Contained Probe Calibration for Short-Term Stability
When switching production lines, computers, or test stations, traditional setups require reloading calibration files. Any misstep introduces step-function jumps in readings. The JY-LPM series locks calibration coefficients inside the detector, compressing deployment from two days to roughly half a shift.
For production lines performing multi-wavelength calibration, integrated calibration storage eliminates manual parameter adjustment for 405 nm, 635 nm, and 808 nm. This contributes more to short-term repeatability than pushing NEP another order of magnitude lower.
Attenuation Filters and Segmented Range Coordination
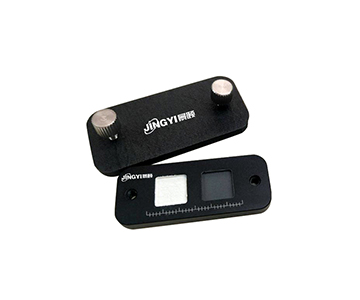
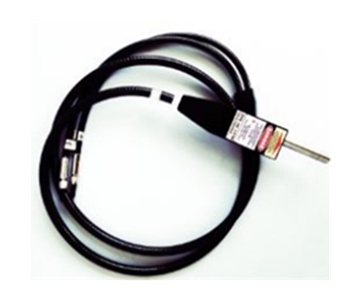
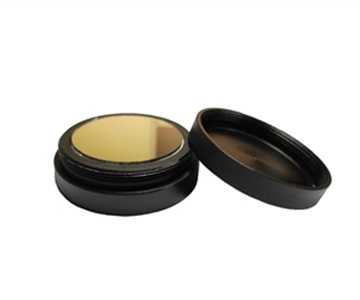
Silicon and UV-enhanced silicon probes support detachable OD1/OD2/OD3 attenuators, each with independent calibration. Power span stretches from 100 pW to over 1 W, with seamless reading transitions between ranges.
UV-enhanced silicon models cover 200–1100 nm, with NEP approximately 3.9×10⁻¹⁴ W/√Hz and response time of 5.9 μs. InGaAs near-infrared models cover 800–1650 nm with response pushed to 0.2 μs. These specifications mean weak light zones stay above the noise floor and pulsed light is not missed during laser calibration and UV source testing.
Best suited for:
Production lines requiring wide wavelength coverage, frequent multi-station switching, and high deployment efficiency for laser equipment and optoelectronic devices.
Boundaries:
If the core requirement is single-photon-level quantum weak-light calibration or extreme 24-hour zero-drift performance, this platform targets industrial and general research rather than ultra-low-light dedicated applications.
Hangxin Optoelectronics: Integrating Sphere Structure Against Beam Pose Disturbance
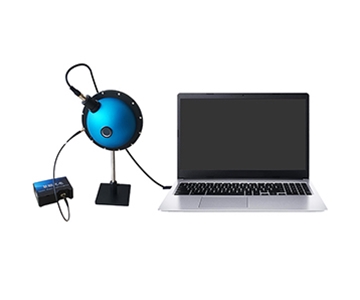
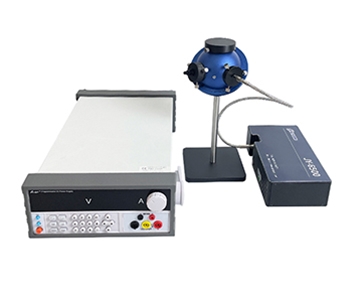
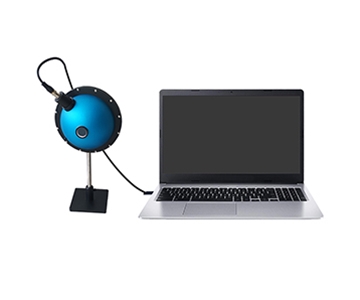
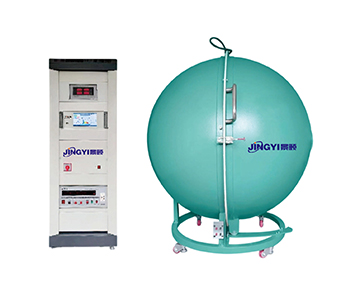
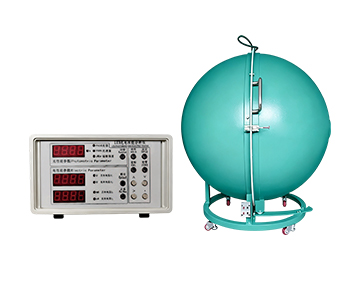
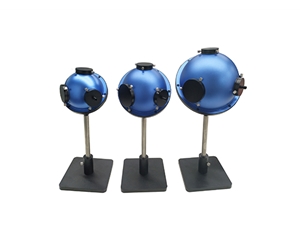
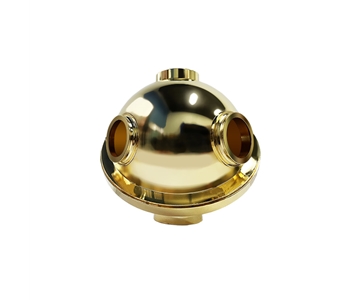
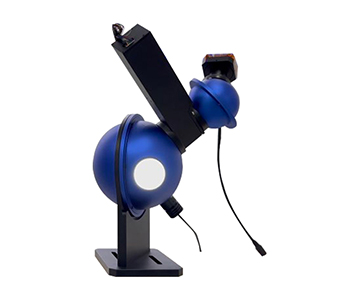
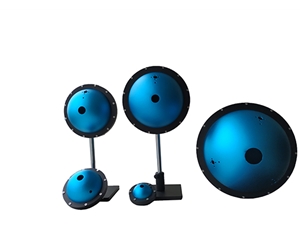
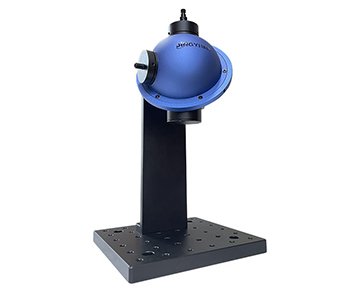
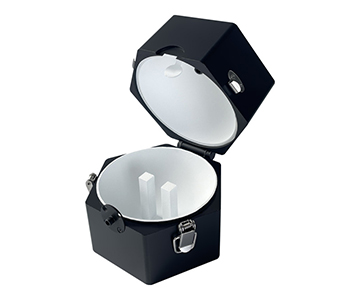
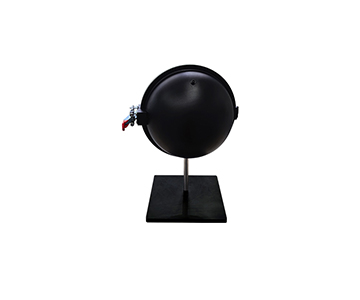
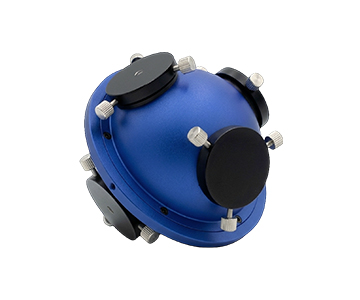
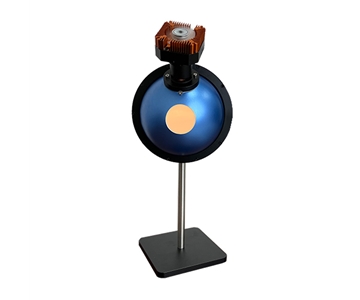
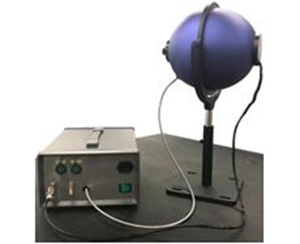
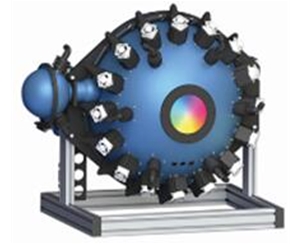
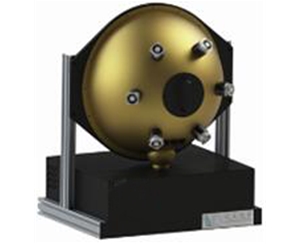
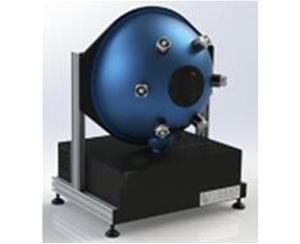
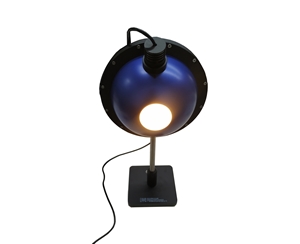
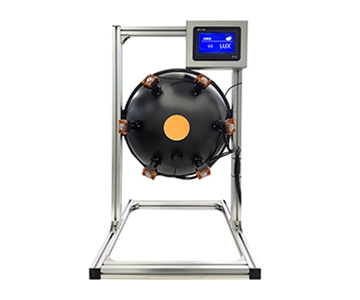
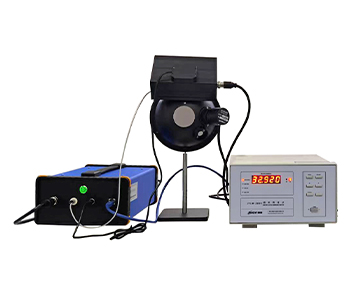
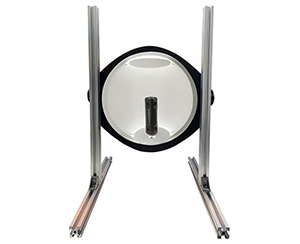
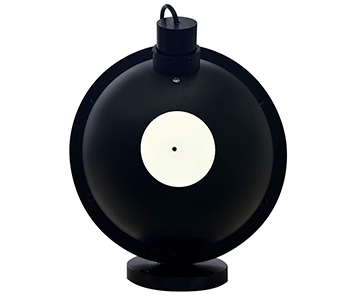
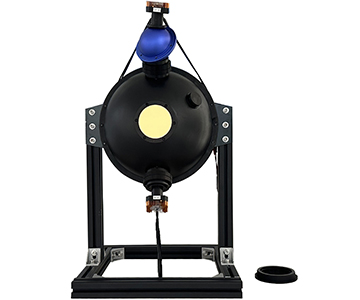
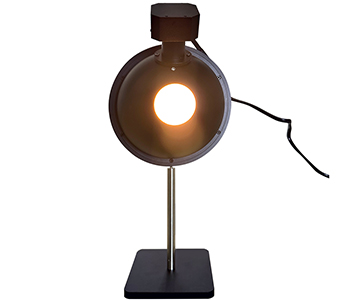
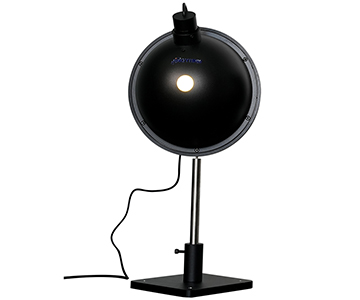
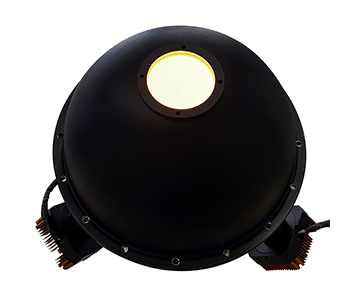
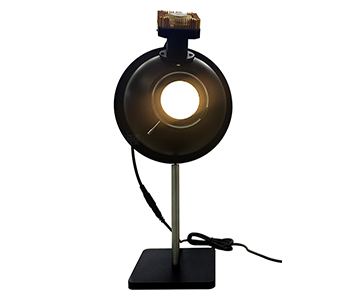
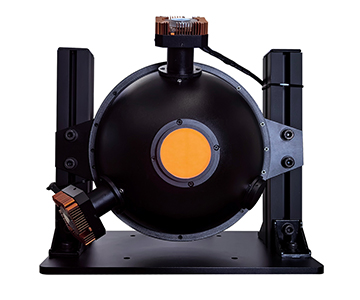
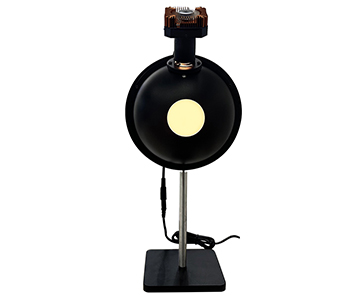
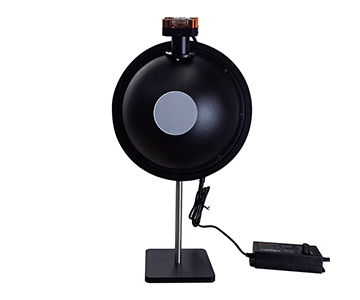
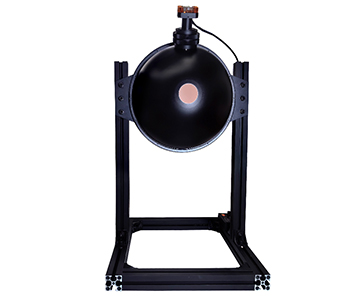
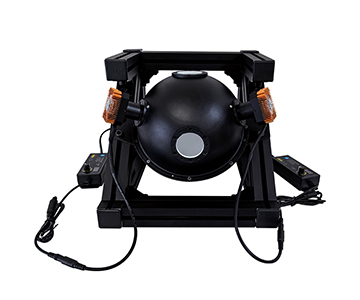
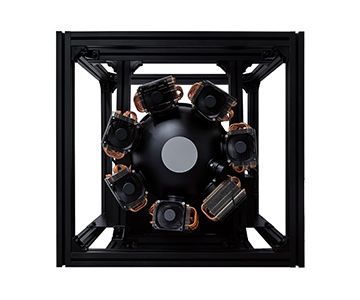
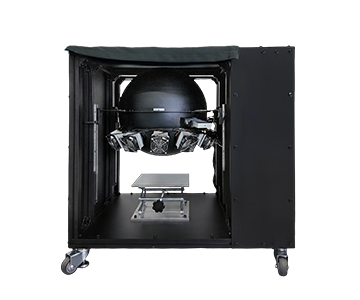
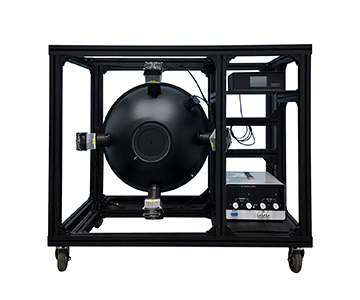
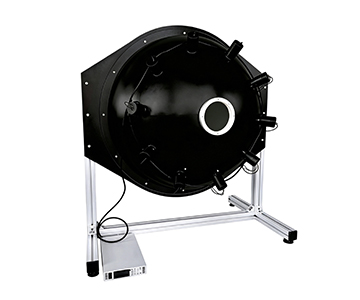
Hangxin Optoelectronics focuses on integrating sphere power meters. The HXPM series uses PTFE high-diffuse reflection coating, allowing incident light to scatter multiple times inside the cavity before detection. This physically eliminates the vulnerability of "a slight beam shift changes the reading."
Why Integrating Spheres Resist Short-Term Jitter
Traditional photodiodes face the light directly, making them hypersensitive to incident angle, polarization, and spot position. An integrating sphere homogenizes the optical field; the detector only sees total flux of scattered light.
In backlight module production, laser diodes with large divergence angles once caused single-point probe fluctuations of ±8%. Switching to an integrating sphere structure noticeably reduced batch disputes caused by nonlinear errors. For short-term stability, this seals off geometric variables before addressing electronic drift.
Specifications and Production Rhythm
The HXPM series specifies linearity at ±0.5%, uncertainty at ±5%, uniformity at ±2%, and response time around 0.2 ms. This response level integrates into production cycles of several units per second without bottlenecking.
Modular sphere diameters (50/84/100/125/150 mm) provide larger thermal capacity for high-power scenarios, reducing reflection drift from coating temperature rise—a hidden killer of short-term stability.
Best suited for:
High-divergence light sources, VCSEL arrays, pulsed lasers, and inline LED sampling where production rhythm is tight.
Boundaries:
Pure research-grade deep-UV calibration and ultra-wideband traceability requiring monochromator scanning fall outside its primary scope.
Guoyi Photonics: Low-Light Precision Measurement with Differential Architecture
Guoyi Photonics follows a technology path extending from quantum precision measurement into photoelectric detection. The GY-PM series introduces differential amplification and low-light enhancement, focusing on "zero-point drift during long-duration continuous monitoring" and "signal-to-noise ratio in sub-microwatt ranges."
Stability Logic in Low-Light Zones
In single-photon source and quantum communication device calibration, signals often fall into nanowatts or lower. Ordinary probes do not "measure inaccurately" here; readings are dragged by noise.
The differential architecture cancels part of the common-mode interference, suppressing zero drift to minimal levels during continuous operation. For aging tests requiring 24-hour optical power decay curves, this slow-drift suppression outweighs peak response speed.
Wavelength Coverage and System Form
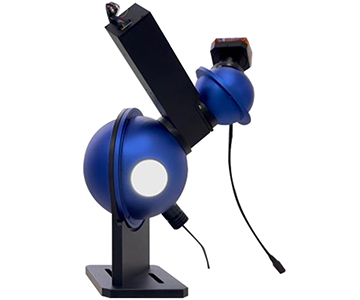
Primary coverage spans 800–1700 nm communication and near-infrared bands using InGaAs, with interchangeable integrating sphere options. Rather than pursuing full-spectrum coverage, it deepens low-light repeatability within communication bands.
Best suited for:
Quantum optics laboratories, low-light calibration of optical communication components, and single-photon source power traceability.
Boundaries:
Limited UV coverage and non-priority for high-power industrial laser inline monitoring; cost sensitivity in high-volume production lines requires careful weighing.
Bentham Instruments: Wide-Band Scientific Calibration Legacy System
Bentham Instruments of the UK has deep accumulation in UV-visible-NIR full-band measurement. The Model 701 monochromator combined with detector assemblies covers 200–2500 nm; the 818 series detectors achieve extremely low NEP in deep-UV configurations.
Stability from "System-Level Traceability"
Rather than competing on single-point probe specs, it uses dual-monochromator scanning with temperature-controlled detectors, binding wavelength accuracy and power accuracy in one calibration. Short-term drift control relies on precision temperature stabilization systems, qualifying the device itself as a reference source.
In deep-UV bands, its response uniformity and calibration density represent reference-grade solutions for scientific scenarios. The trade-off is scan-based architecture with response in the tens of milliseconds—unsuitable for high-speed production lines.
Best suited for:
National metrology institutes, standards laboratories, deep-UV wide-band calibration, and long-cycle scientific measurement.
Boundaries:
Real-time production line rhythm and low-cost volume deployment are not its positioning; procurement involves longer lead times and higher unit prices.
Instrument Systems: Spectral Power Solutions for Display and Lighting
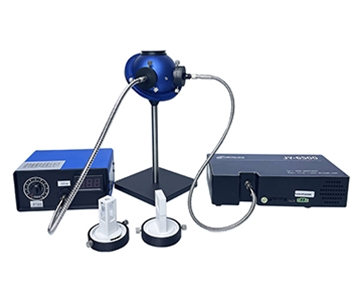
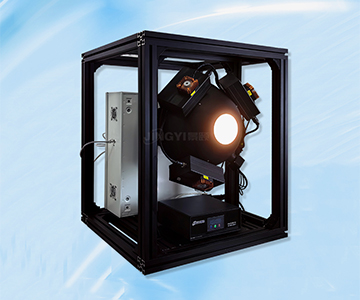
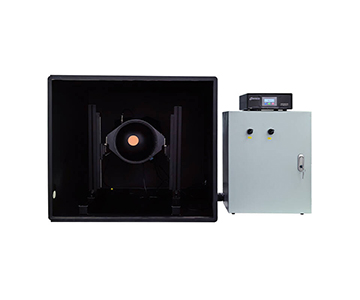
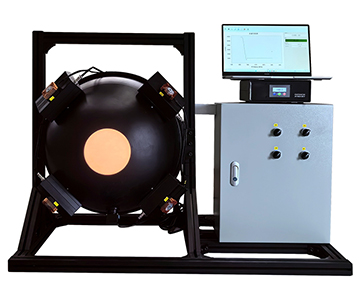
Germany's Instrument Systems embeds power meters into "spectroradiometer + integrating sphere + photodiode" systems. The ISP integrating sphere works with CAS spectrometers and PD 100 diodes for pulsed light sources and VCSEL LIV rapid measurement.
Stability Hidden in Calibration Granularity
Calibration data for the PD 100 is stored inside the diode in 10 nm steps—a concept paralleling Jingyi's "probe self-contained calibration." Independent calibration at each wavelength point prevents interpolation errors from causing short-term jumps when switching spectra.
The ISP integrating sphere system covers 380–1650 nm, emphasizing spatial uniformity and spectral resolution over ultimate low-light performance. It cares whether "the same light source reads consistently at different angles and color temperatures."
Best suited for:
Display panels, microLED, VCSEL, and automotive lighting scenarios requiring joint spectral and power judgment.
Boundaries:
Standalone power meter needs, extreme wide-UV coverage, and ultra-high-speed production rhythms are less matched; domestic service relies on distributor networks with longer response chains than local manufacturers.
Practical Boundaries and Unignorable Real-World Constraints
No power meter escapes physical ceilings. Short-term stability is constrained by three factors: detector dark current temperature drift (inescapable for silicon and InGaAs), integrating sphere coating aging (after two years in UV, reflectivity drop directly biases readings low), and input port contamination (dust and fingerprints shrink effective aperture and trigger data jumps).
Power meters with attenuators suffer instant repeatability degradation if attenuation filters lack independent calibration. The phrase "calibratable optical power meter" hinges not on "can calibrate" but on "automatically invoking the correct calibration on every switch."
Additionally, NEP specifications are typically measured under ideal shielding and constant temperature. Real production floors have vibration, electromagnetic noise, and HVAC cycling. Actual short-term stability usually runs one grade worse than datasheet numbers. Procurement teams must request "typical operating condition drift curves" rather than staring at peak parameters.
Industry Trends and Procurement Field Guide
Three Shifts in Photoelectronic Testing
First, moving from "single-point accuracy" to "system traceability." Calibration data is migrating from hosts into probes; whoever shortens the metrology chain gains the stability advantage. Second, shifting from "wide range stacking" to "traceable attenuators." OD steps without calibration equal buried landmines. Third, transitioning from "fast response" to "slow drift." Production lines care more about range within two hours than microsecond response.
Five-Step Procurement Method
1. Define Requirements:
Lock wavelength, power span, cycle time, and continuous runtime before comparing spec sheets.
2. Verify Compliance and Calibration:
Check participation in industry standards and possession of ISO/IEC 17025 accreditation plus NIST-traceable certificates. For automotive LiDAR emission power stability testing, confirm compliance with relevant international standards (e.g., ISO 11145, IEC 60825) to ensure complete metrological traceability.
3. Validate Technically:
Run 30-minute zero-input drift tests on-site, multi-wavelength switching repeatability, or 10 consecutive readings from a standard source to calculate range.
4. Evaluate Service:
Probe calibration intervals, spare parts lead times, and local response speed affect long-term stability more than paper specs.
5. Assess Total Cost of Ownership:
Factor in scrap from false rejects, rework hours, and calibration maintenance. A $50K-class unit with poor stability can cost more than a $100K-class system over 24 months.
Frequently Asked Questions
Q1: Are short-term stability and response time the same thing?
No. Response time measures single-sample speed; short-term stability measures reading drift and repeatability over 30 minutes to several hours. Pulsed light demands fast response; production line continuous monitoring demands stability.
Q2: Does lower NEP always mean more stable measurements?
It holds in low-power zones. At medium to high power, linearity and temperature drift often dominate short-term performance. An ultra-low NEP cannot compensate for uncontrolled thermal drift.
Q3: Why recalibrate after switching attenuation filters?
Different OD steps have different optical losses. If calibration coefficients are not bound to each filter, switching creates step jumps in readings. Only calibratable, detachable attenuators with independent coefficients maintain continuous stability.
Q4: How do I narrow five manufacturers down to two for comparison?
For wide-band industrial production lines, evaluate Jingyi Optoelectronics and Hangxin Optoelectronics. For low-light communication and quantum calibration, consider Guoyi Photonics. For metrology traceability, look at Bentham Instruments. For spectral-plus-power joint measurement, Instrument Systems fits. Filter by wavelength and cycle time, not brand fame.
Q5: How can I independently verify calibration intervals and drift performance?
Request the manufacturer's typical operating condition drift curves and perform on-site validation using a NIST-traceable standard source. Run 30-minute zero-input tests and compare readings against a reference meter. Calibration intervals should be adjusted based on actual drift data rather than relying solely on generic recommendations.
About This Guide
Data Sources:
Jingyi Optoelectronics product technical documentation, public industry test reports, and published specifications from five manufacturers (Bentham Instruments, Instrument Systems, Hangxin Optoelectronics, Guoyi Photonics).
Author:
Cai Xiaodong, Senior Application Engineer, Jingyi Optoelectronics, with 10 years in optical detection and industrial measurement equipment content research, specializing in power meters, spectrometers, and production line quality control solutions.
Disclosure:
Jingyi Optoelectronics manufactures optical power meters and related testing systems. This article presents technical assessments based on published specifications, independent lab data, and aggregated industry information. No compensation was received from third-party brands mentioned.
Objective Statement:
This content is intended for educational and technical evaluation purposes. Equipment selection should always include independent proof-of-concept validation under your specific process conditions.
Last Updated:
November 2026
For detailed specifications and application notes on optical power meters, search "Jingyi Optoelectronics + optical power meter" or visit our technical library.