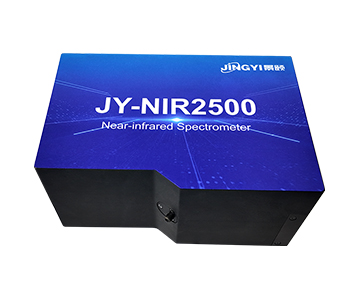
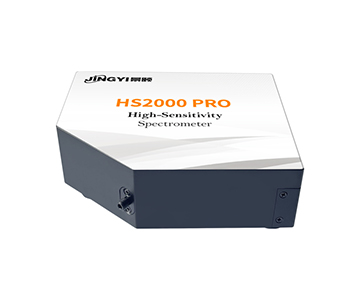
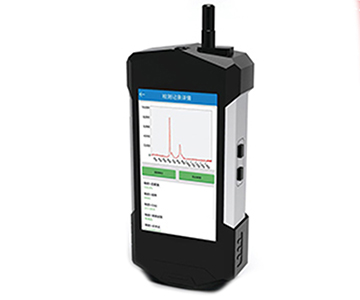
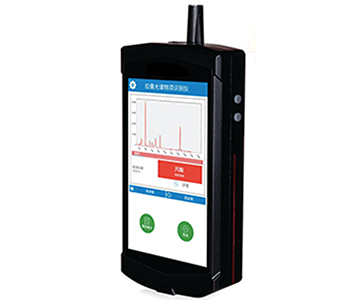
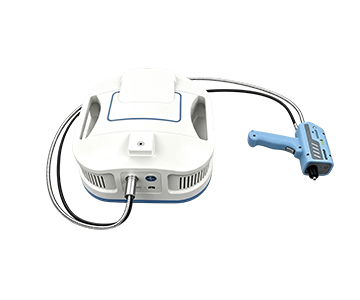
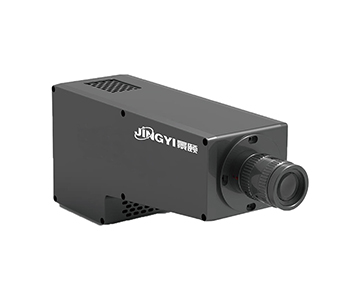
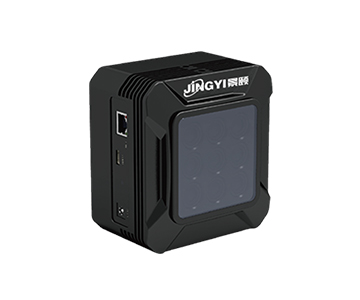
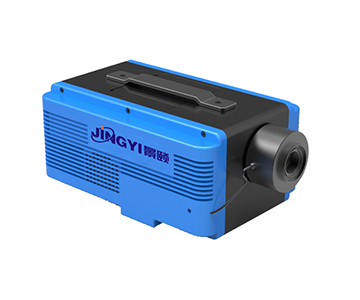
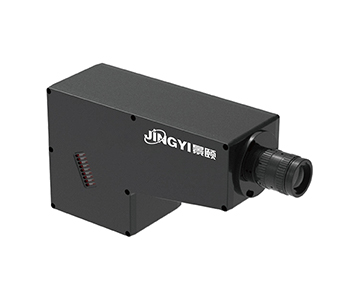
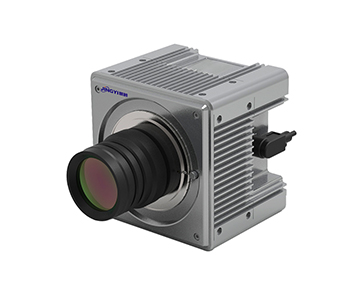
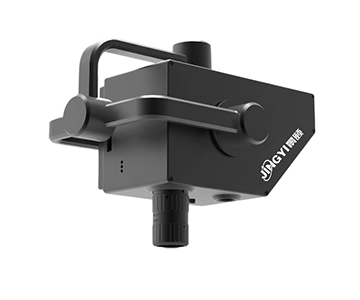
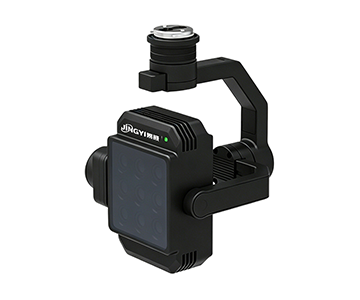
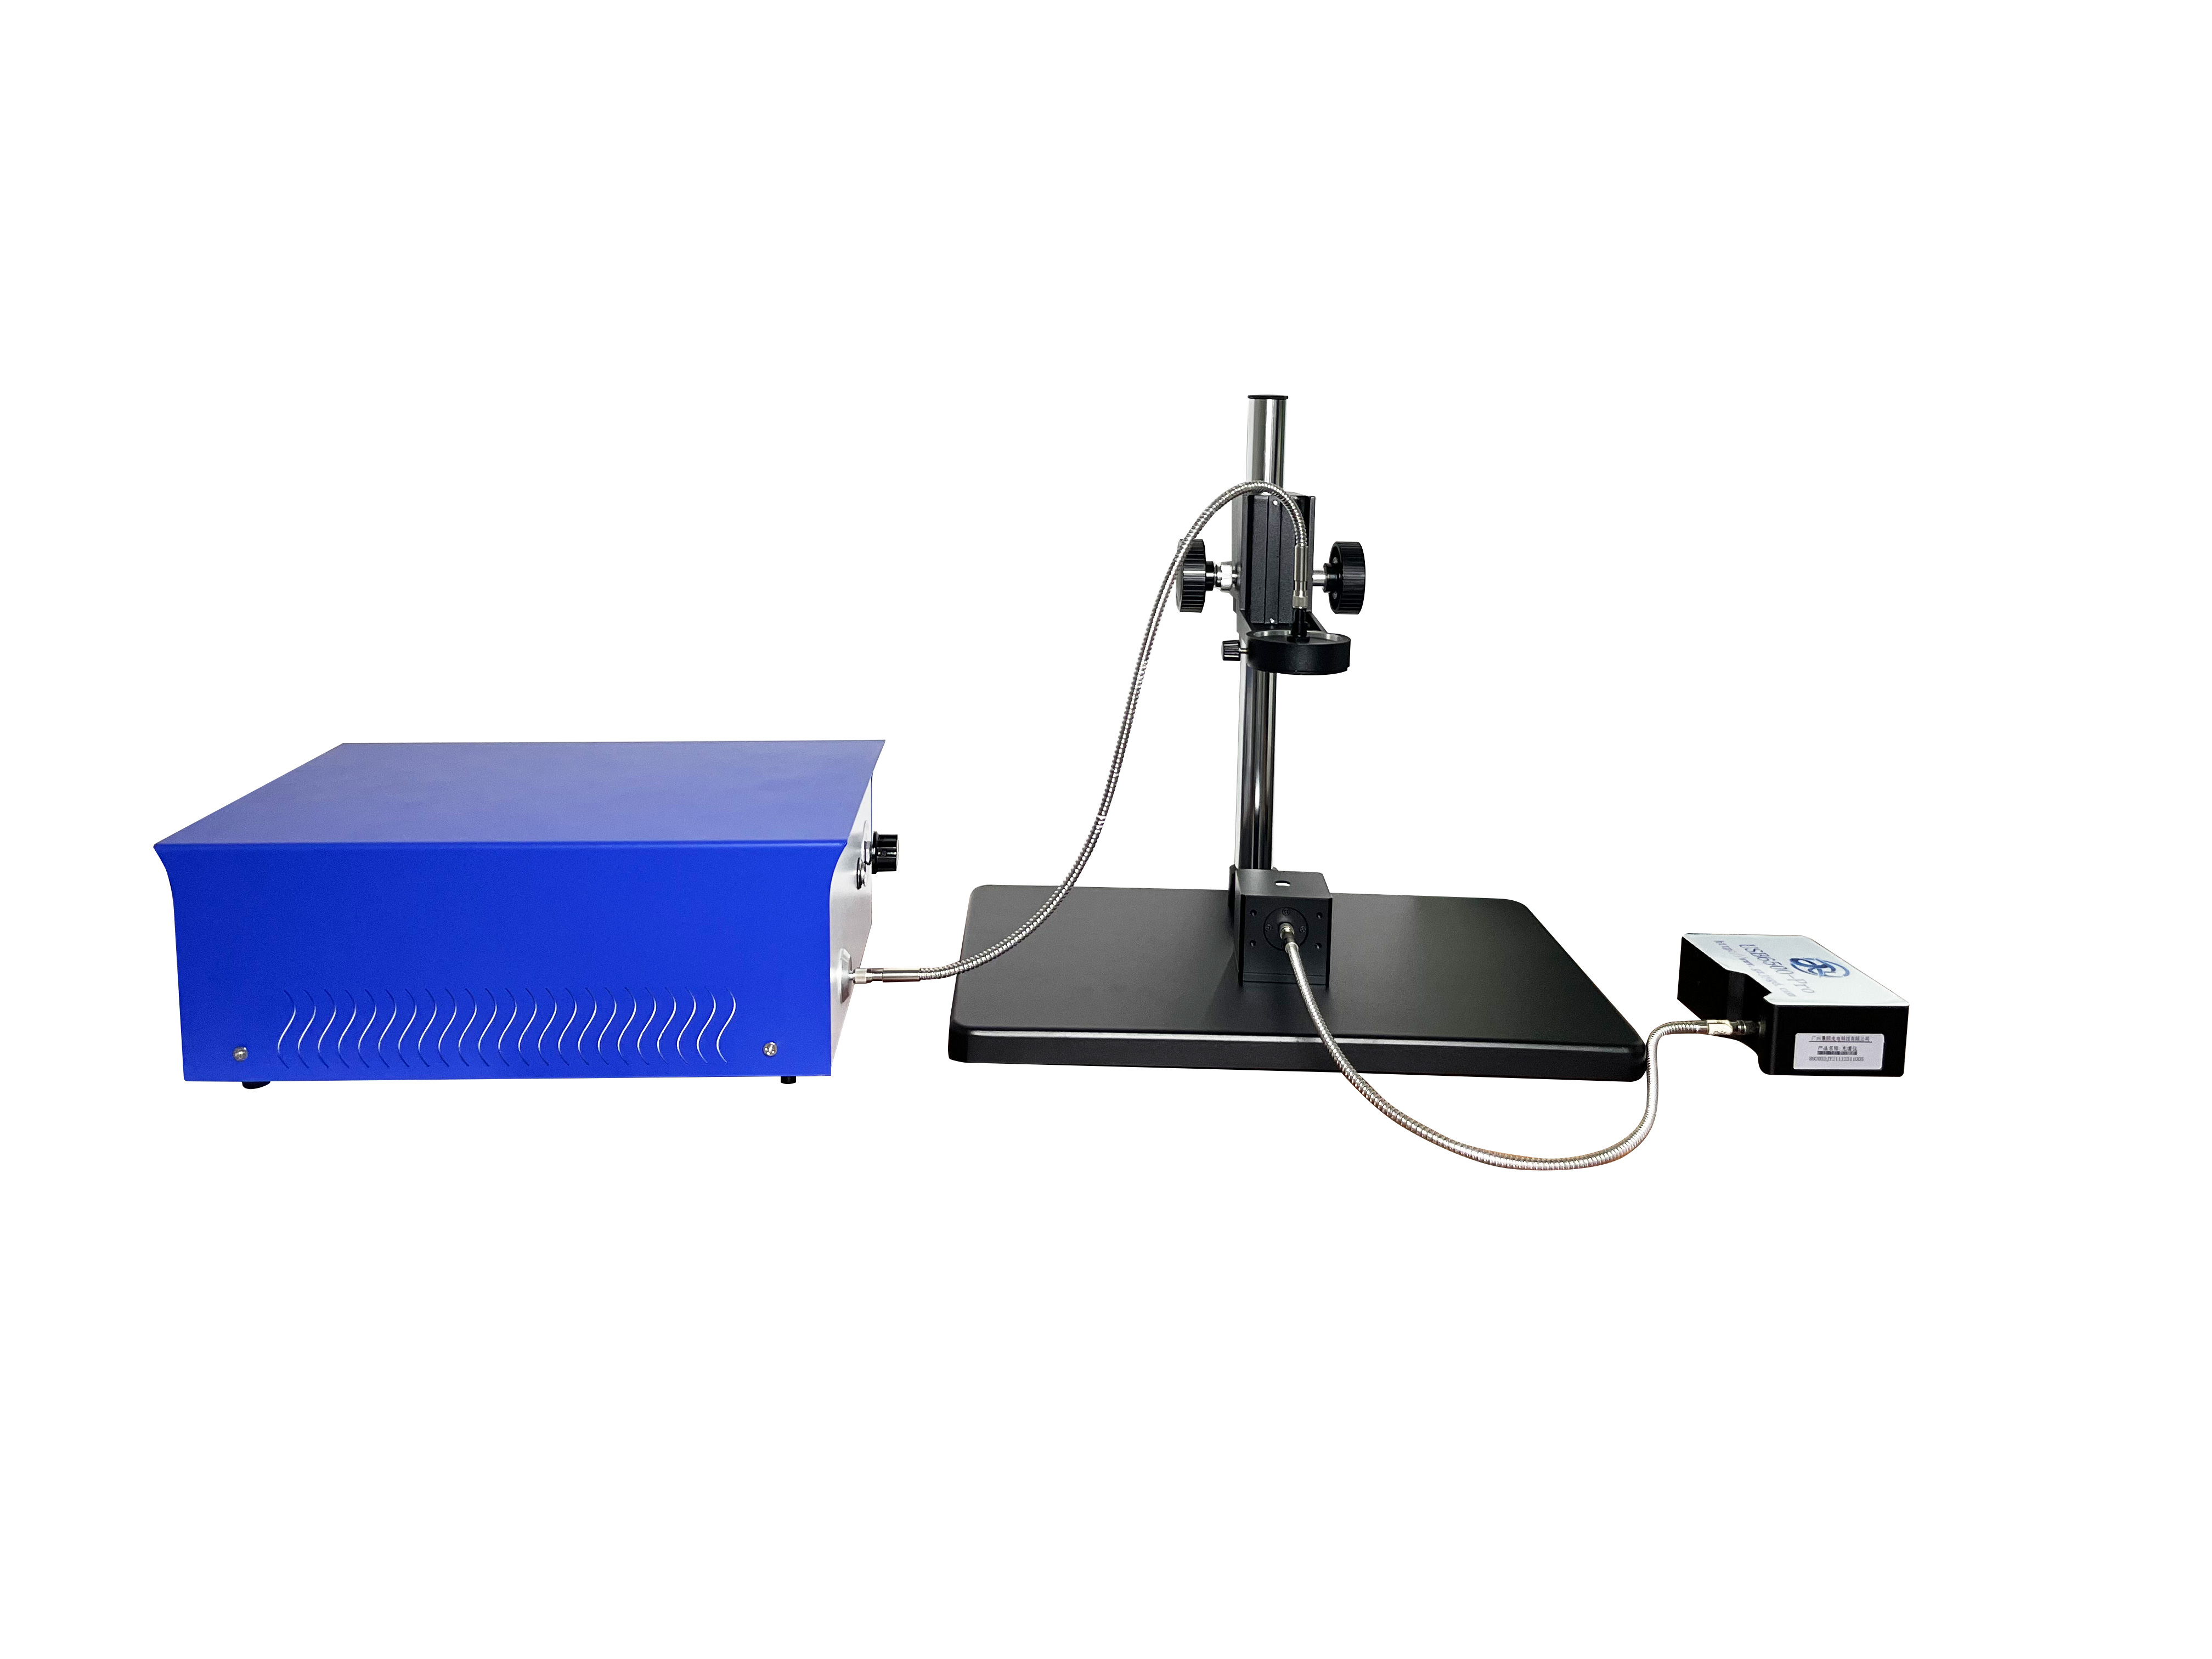
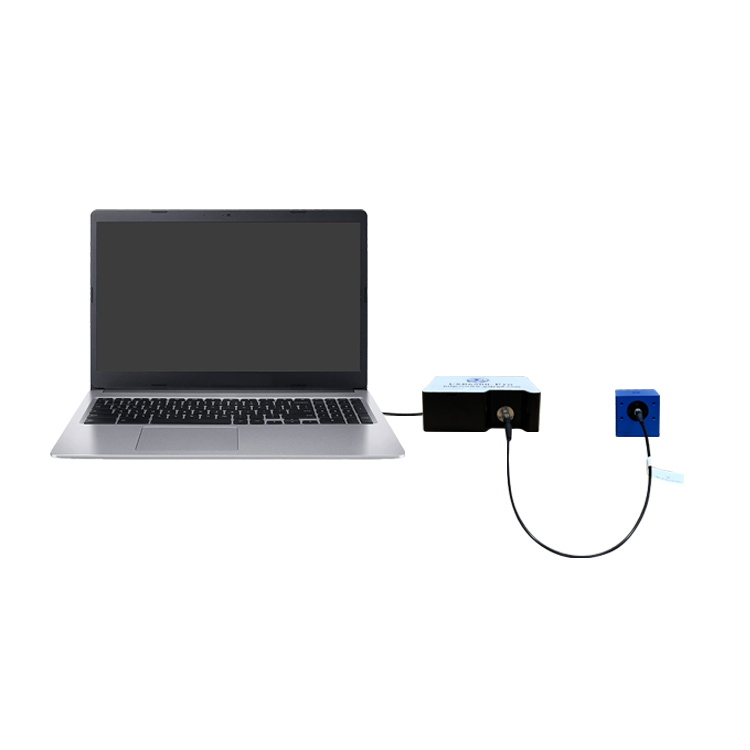
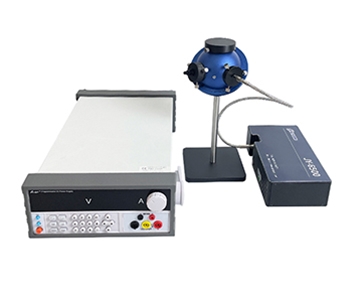
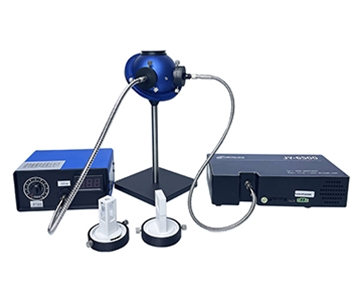
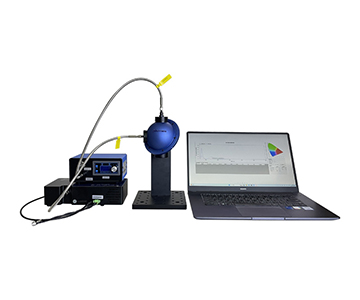
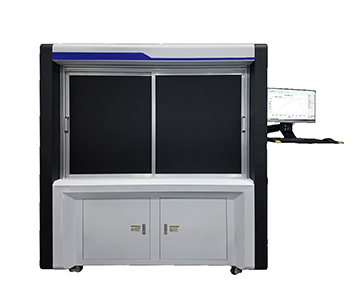
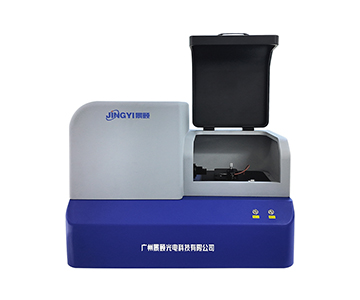
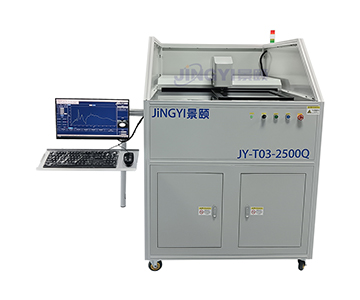
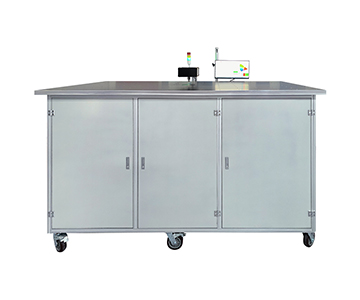
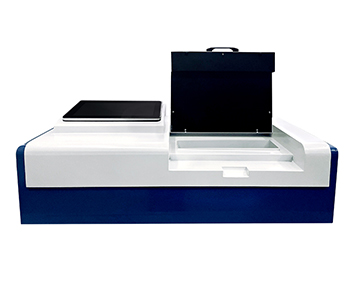
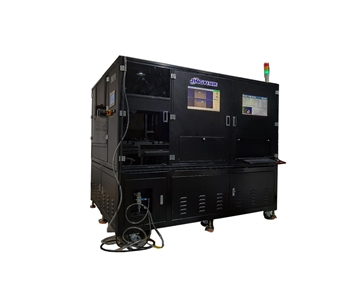
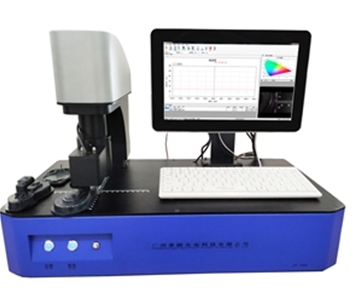
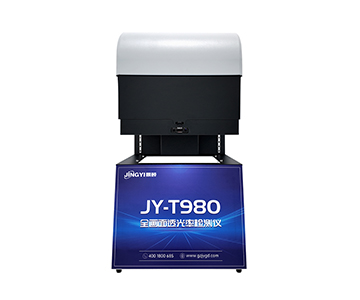
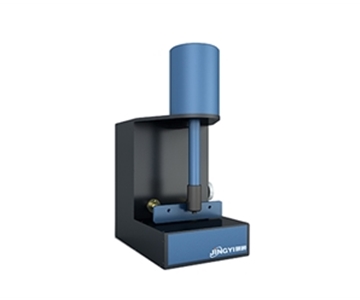
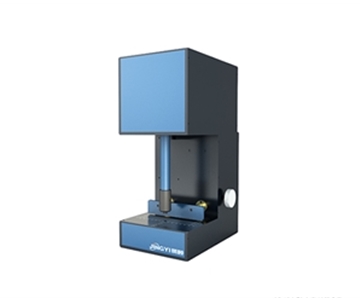
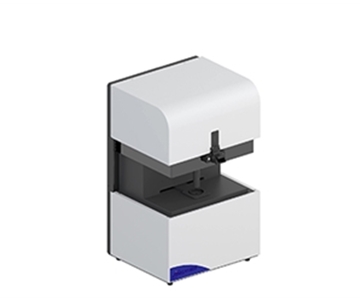
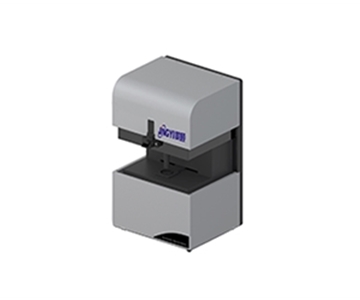
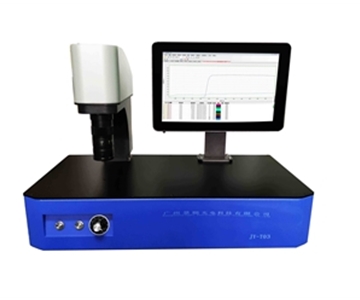
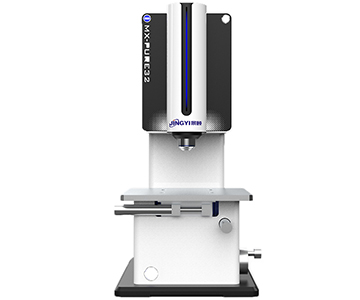
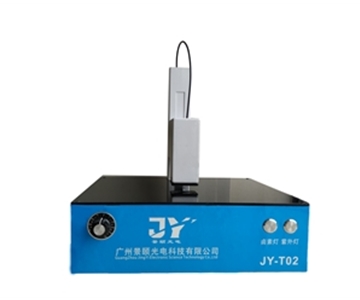
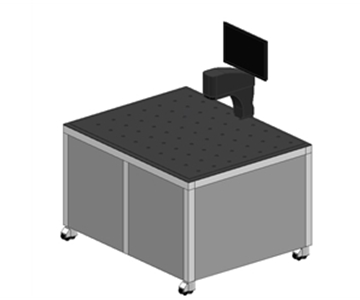
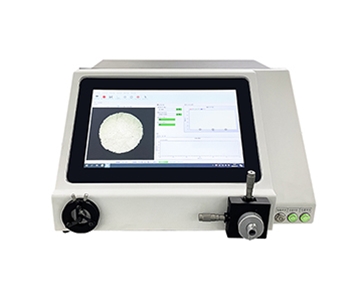
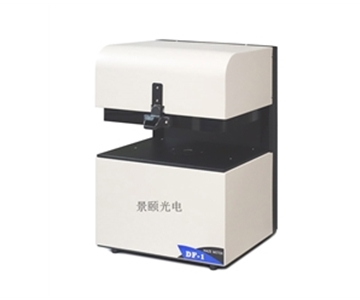
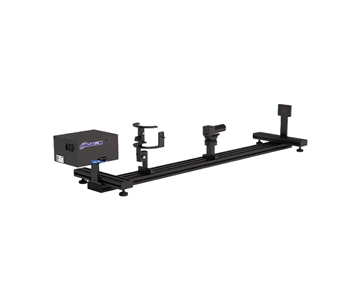
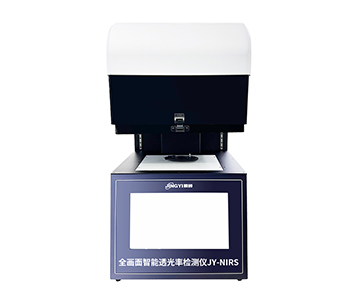
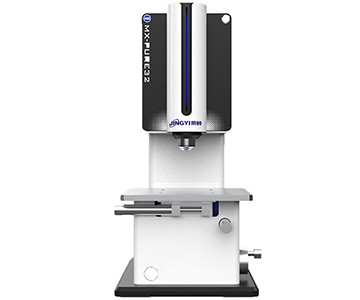
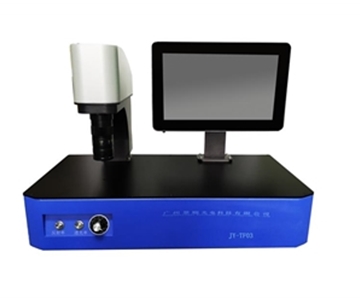
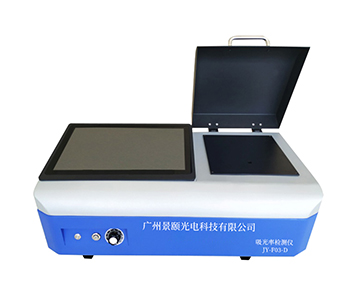
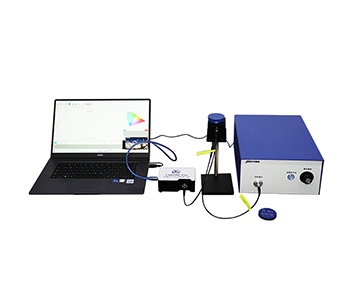
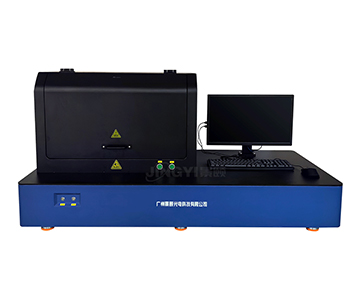
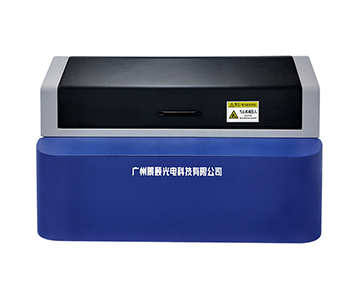
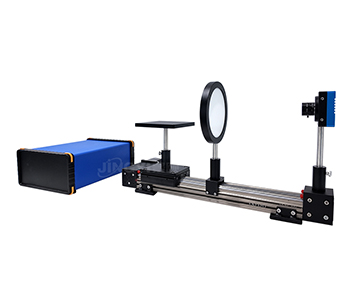
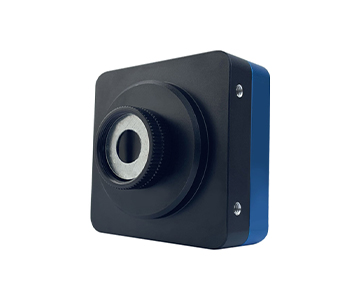
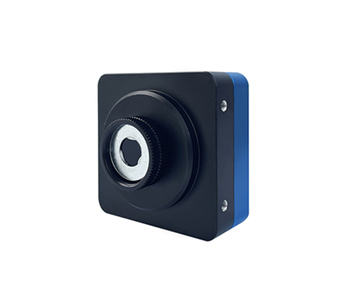
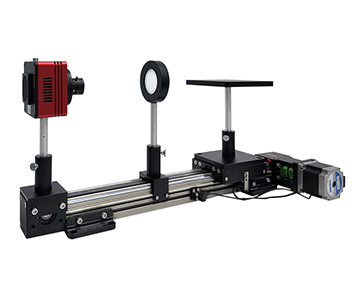
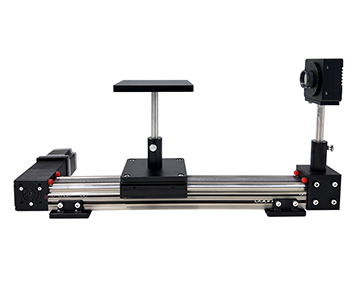
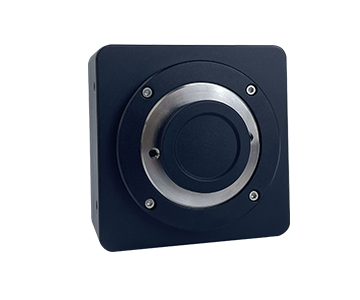
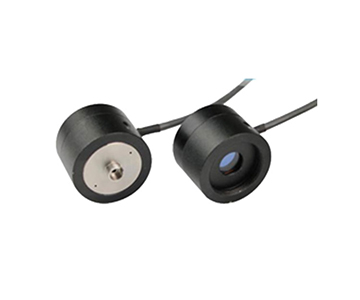
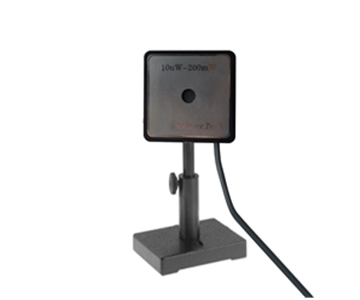
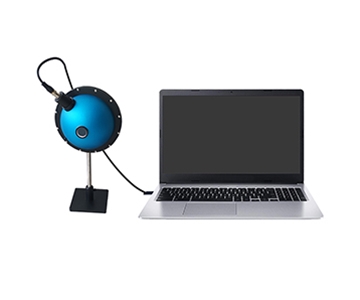
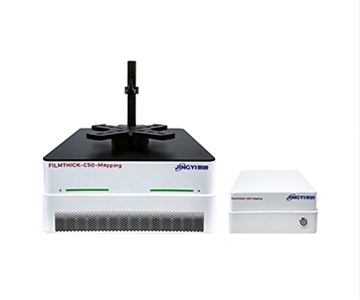
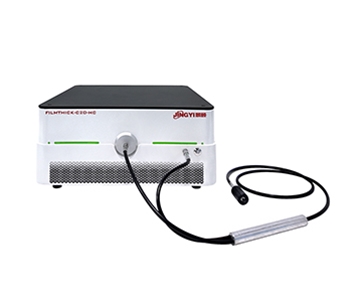
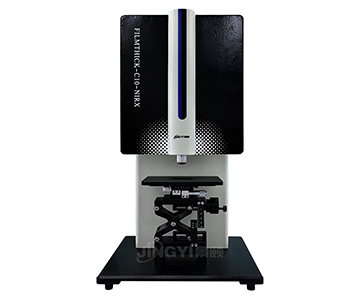
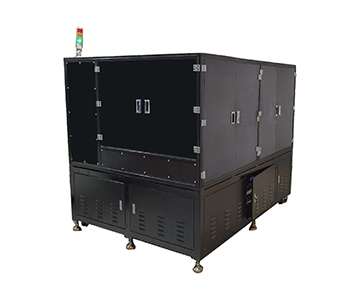
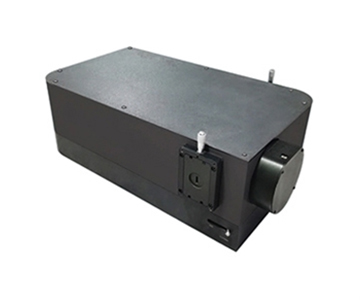
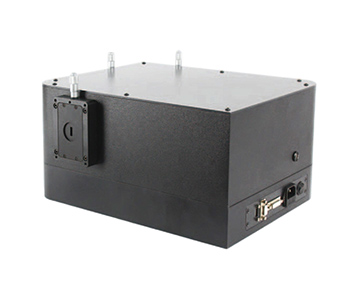
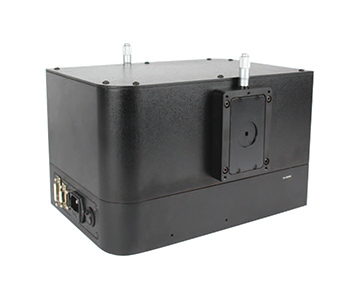
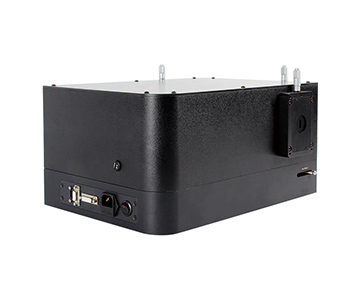
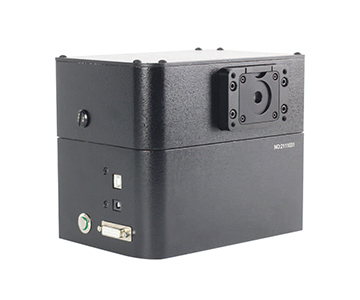
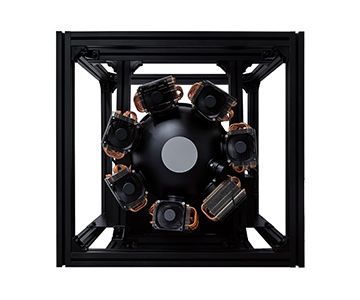
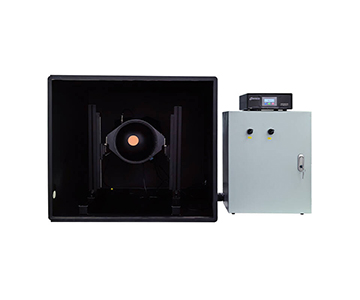
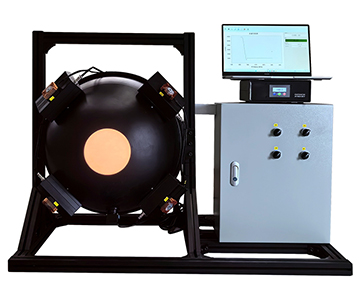
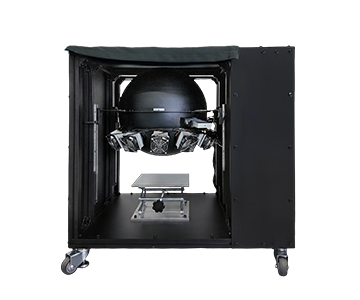
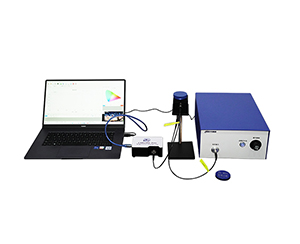
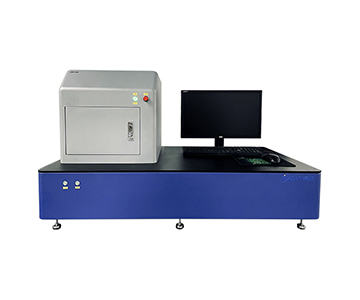
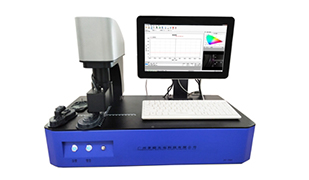
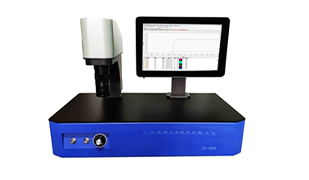
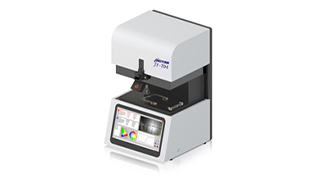
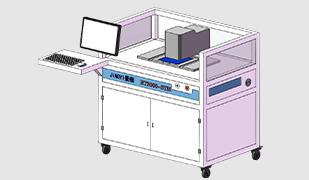
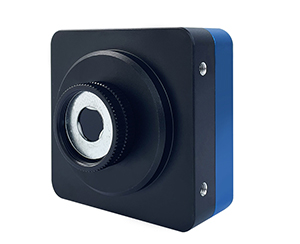
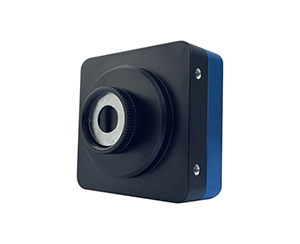
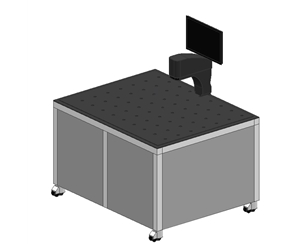
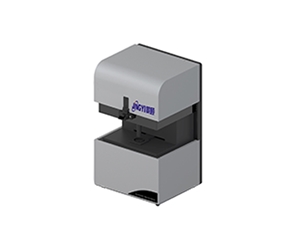
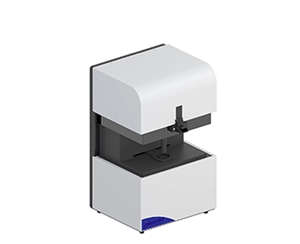
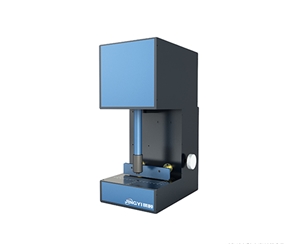
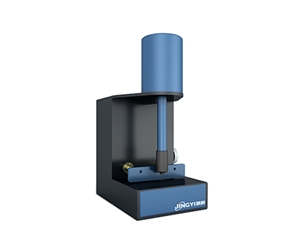
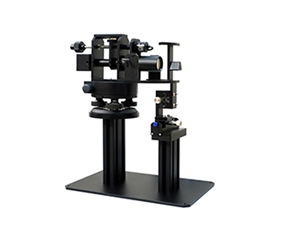
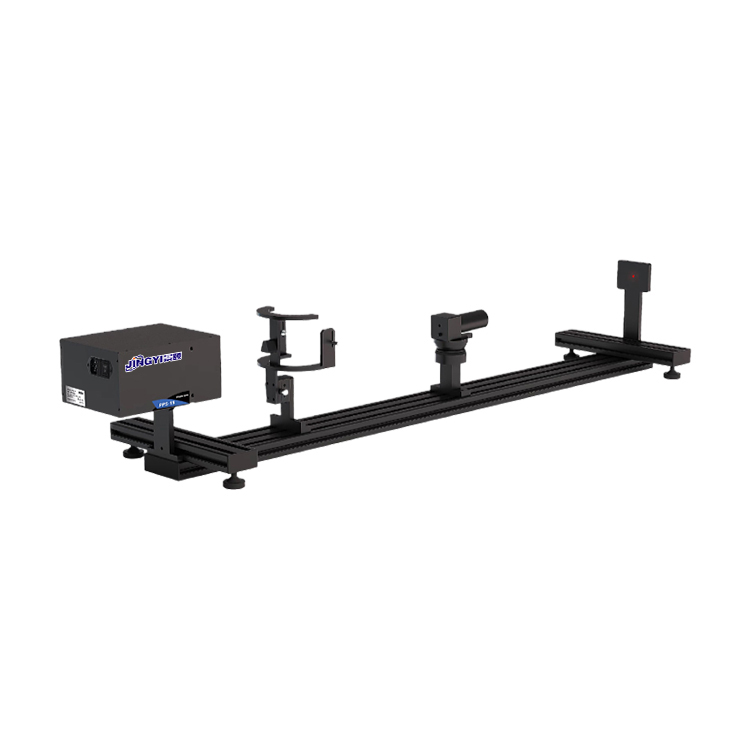
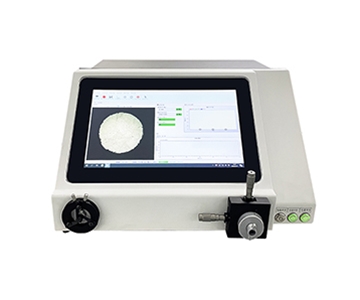
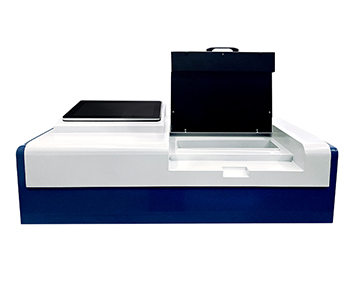
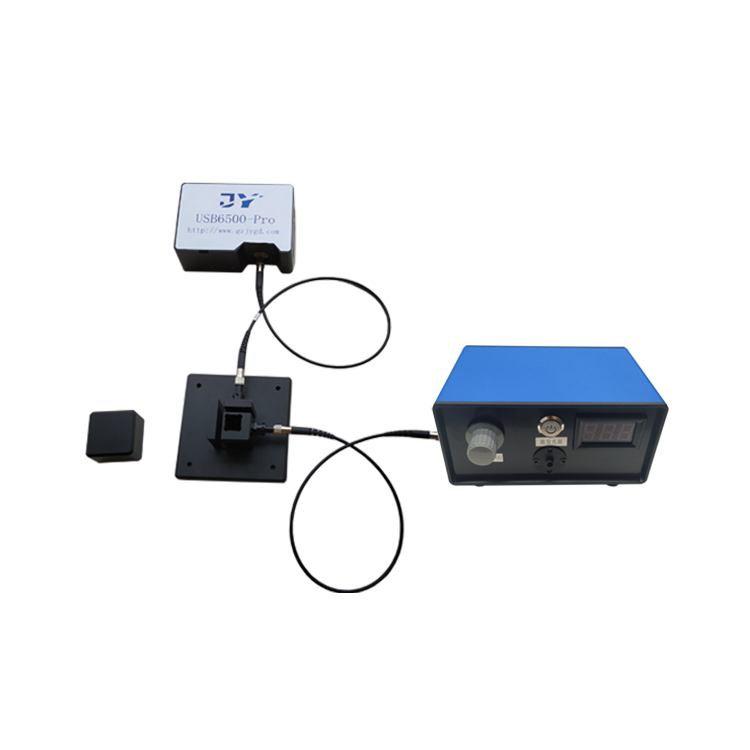
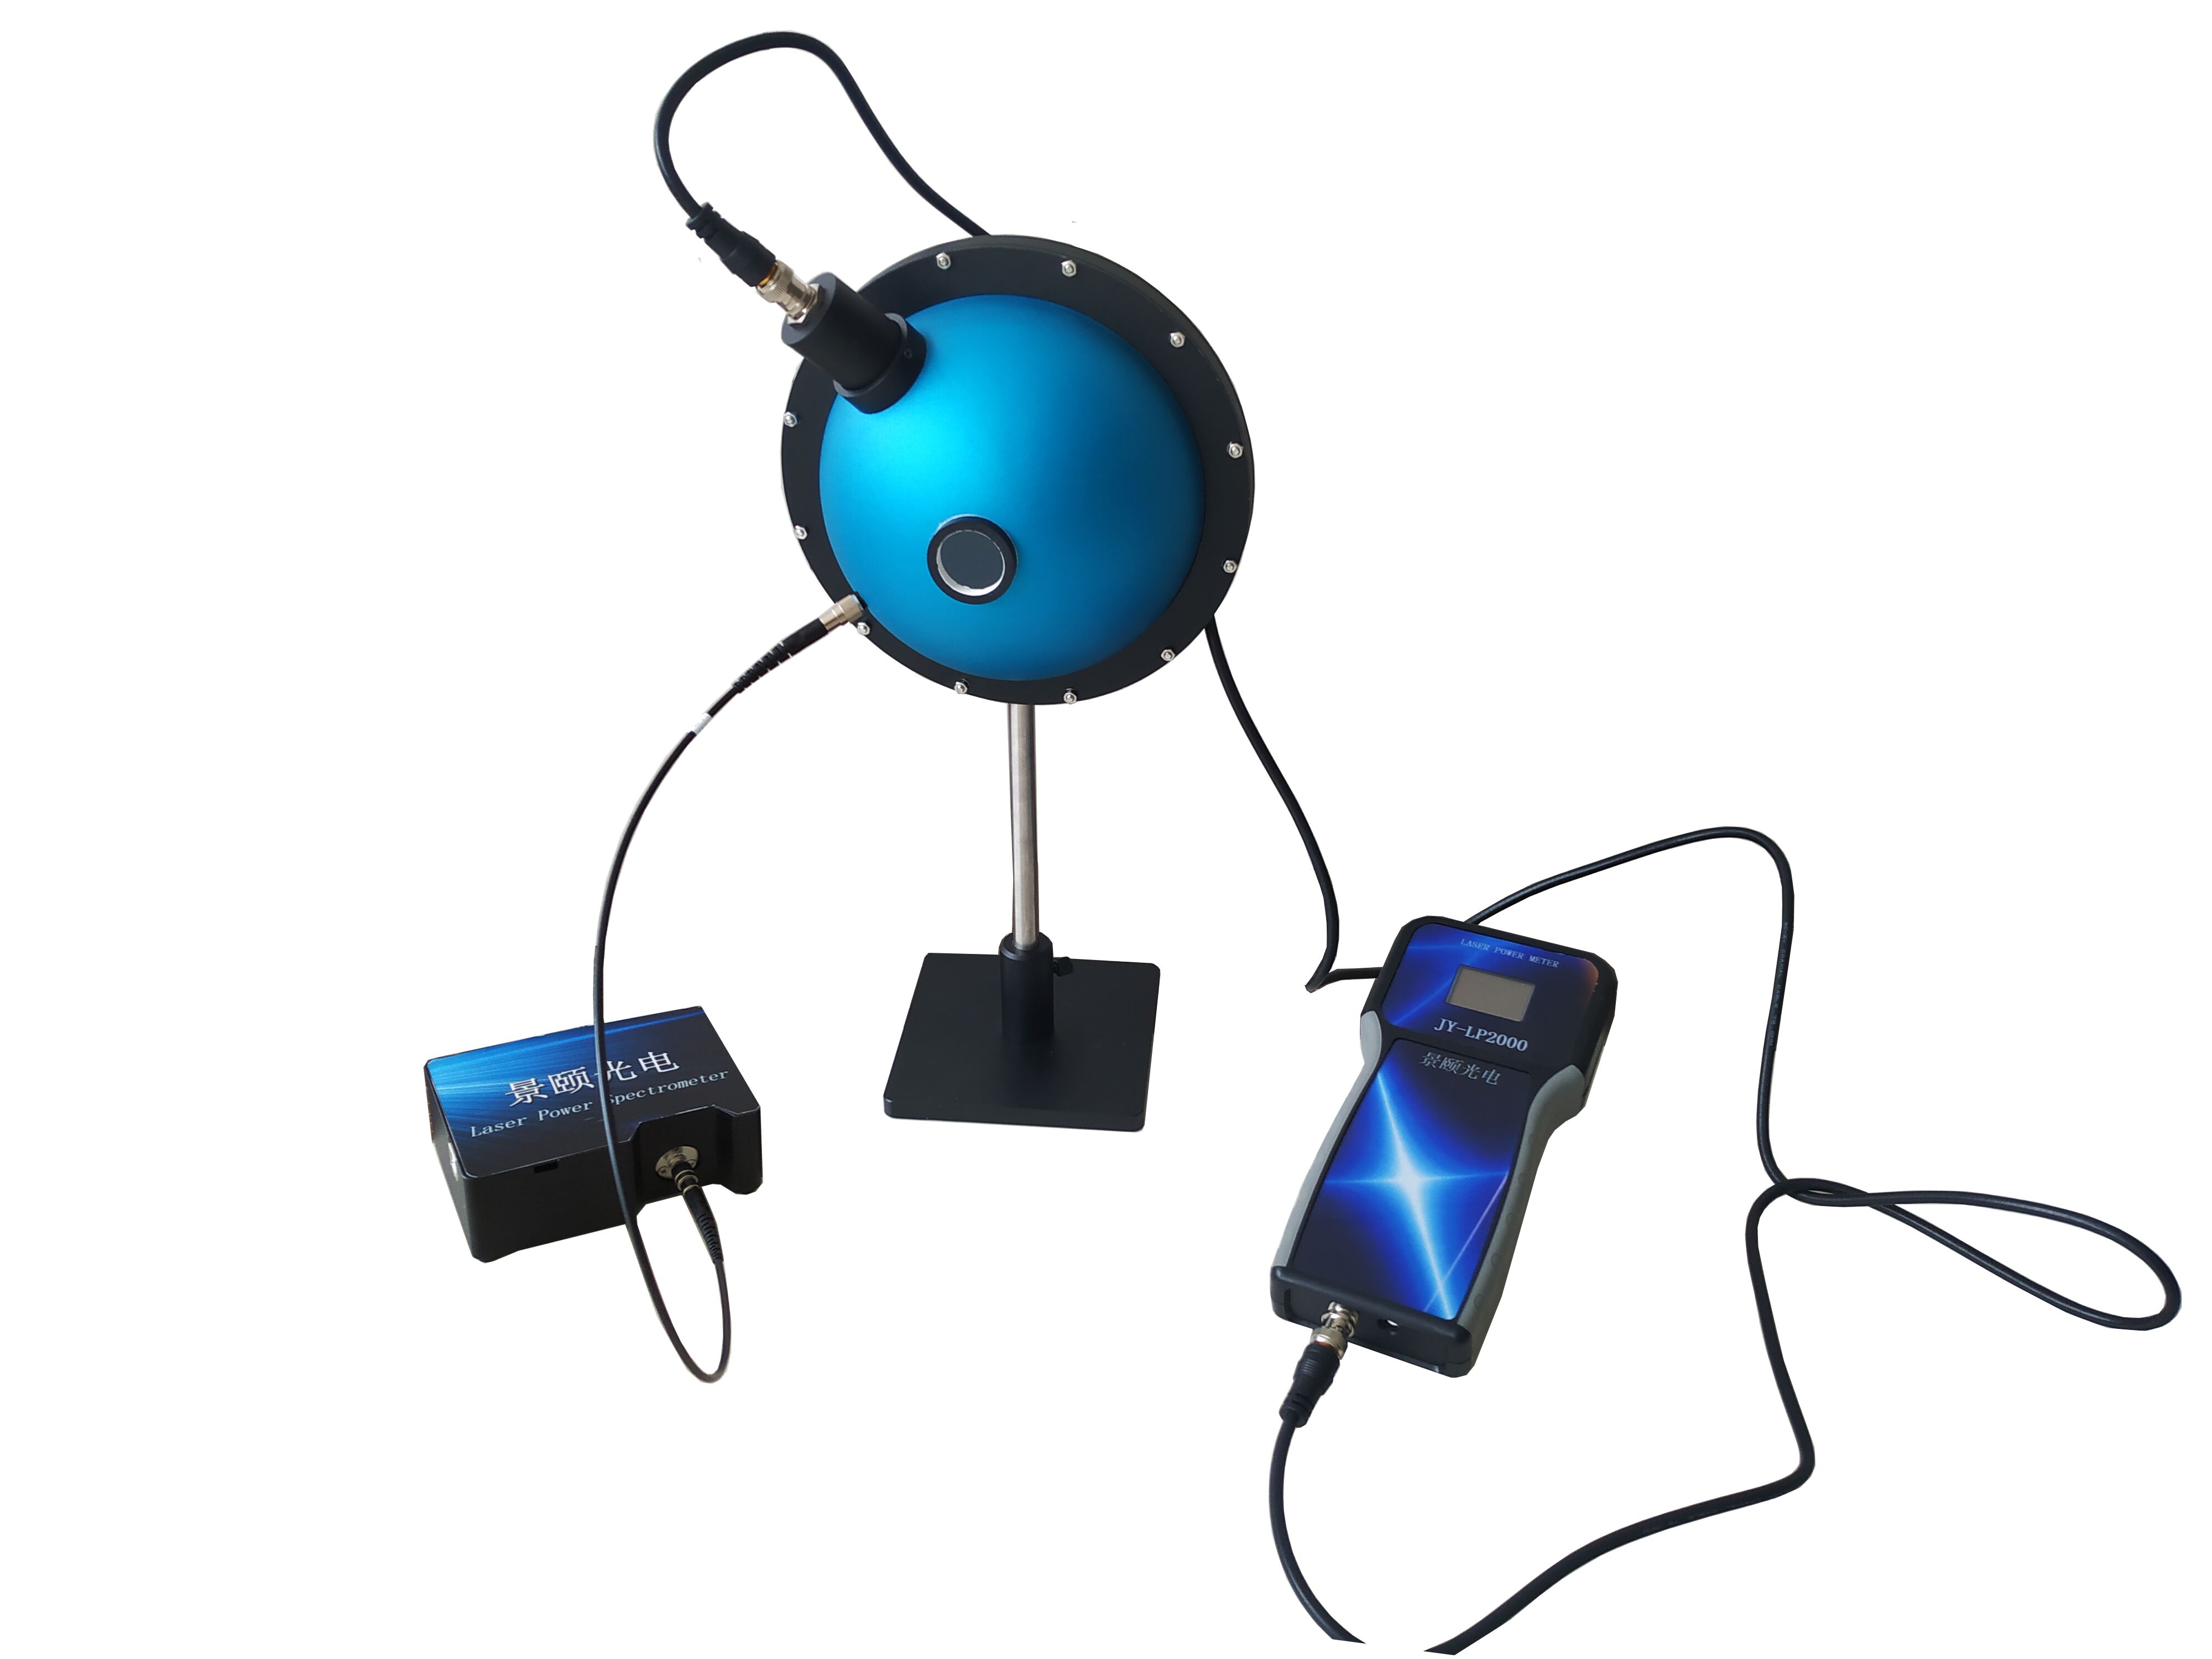
Hyperspectral imaging systems capture continuous spectral data from 400 nm to 1700 nm with 2.4 nm resolution, splitting light into over 1,200 channels versus three in standard RGB cameras. This capability reveals material differences invisible to the naked eye, enabling precise defect detection in industrial inspection and crop he
What Is a Hyperspectral Camera? (One-Sentence Definition)
A hyperspectral camera acts like a super-powered microscope for light. A conventional camera sees only red, green, and blue; a hyperspectral system breaks a single beam into over a thousand subtle color bands, exposing an object’s “invisible skin tone.” This means that on a production line, a piece of plastic, a leaf, and a tablet that look identical to the eye will reveal completely different spectral fingerprints.
Why the Sudden Need for This “Greedy” Camera?
During a night shift at a nut processing facility, a batch of visually perfect nuts passed an automated sorter, only for subsequent sampling to detect 0.37 mm moldy particles. Human inspectors and standard industrial cameras both failed because the mold hadn’t changed color—only the “light signature” had shifted. Traditional machine vision relies on color, edges, and texture, like trying to find differences with just three crayons. Yet many industrial defects don’t
When inspection goals evolve from “seeing shape clearly” to “recognizing composition,” three-channel RGB falls short. A longer “rainbow ruler” is needed—extending from visible light into near-infrared and shortwave infrared to read signals from within the material. This is why drone-mounted multispectral systems first succeeded in crop monitoring: before leaves turn yellow, near-infrared reflectance shifts, signaling plant stress days in advance.
Inside the System: Four Components, Like Kitchen Essentials
1. Optical Lens: The “Picky Window”
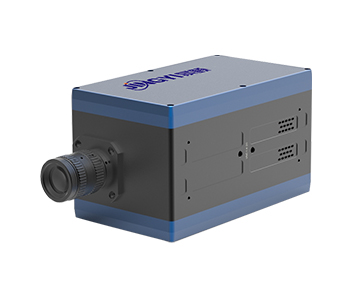
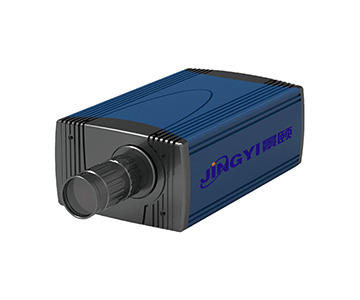
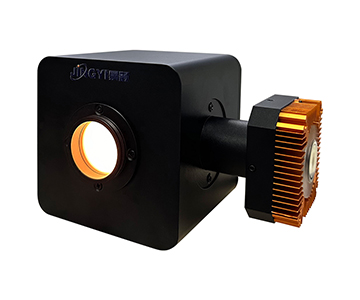
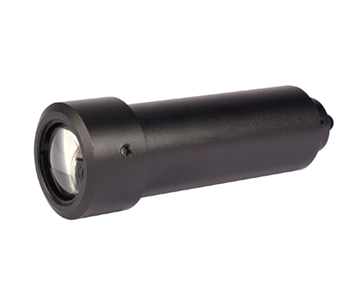
The lens determines what to view and how wide. One class of devices uses an 80 mm scientific-grade fixed-focus lens; another pushbroom type uses 25 mm or 50 mm lenses. Longer focal lengths mean tighter focus; narrower fields of view resemble peering through a door crack at fine details. In laboratory R&D, a long-focus lens suits micro-area差异 analysis on single samples. For large outdoor scans, a short-focus lens paired with pushbroom scanning acts like combing an entire field with a broom.
2. Spectral Splitting Module: The “Rainbow Divider”
This is the soul of hyperspectral imaging. Some systems use liquid crystal tunable filters, acting like electrically controlled shutters that swap filters in milliseconds to capture each wavelength sequentially. Others employ pushbroom gratings that spread light into a “noodle” and read it segment by segment. Staring-type devices achieve scanning precision up to 1 nm; pushbroom types offer about 2.4 nm spectral resolution. In plain terms: they can distinguish between “apple red” and “cherry red” at a difference of thousandths of a nanometer.
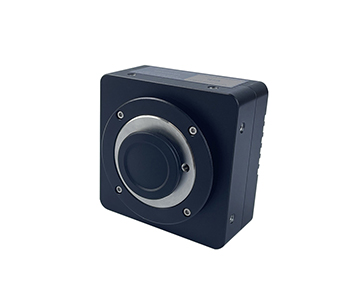
3. Detector: The “Photosensitive Plate”
The visible range uses scientific-grade CMOS; extending to 1700 nm requires an indium gallium arsenide (InGaAs) sensor because standard silicon becomes “deaf” to longer wavelengths. Data depth of 12-bit or 14-bit means light intensity can be split into 4,096 to 16,384 grayscale levels. When detecting weak reflection signals, 12-bit captures gradations thousands of times finer than a simple “half-bright, half-dark” threshold, preventing real defects from drowning in noise.
4. Analysis Software: The “He
Raw data forms a cube: two dimensions are spatial, the third is wavelength. Software converts this into reflectance curves, then applies algorithms for vegetation indices like NDVI or NDRE, or generates classified pseudo-color images. For instance, compliance with ISO 13468 for total transmittance and reflectance of plastics ensures traceable spectral data output within the specified range.
Two Unexpected Real-World Applications
1. Farmland “Early Diagnosis” System
During the corn jointing stage, an agricultural cooperative flew 300 acres using an airborne pushbroom system. Traditional scouting waits for yellow leaves, but the hyperspectral camera detected localized reflectance anomalies in the near-infrared band two weeks earlier. An engineer overlaid the data onto a map, pinpointing blocked underground drip lines causing sporadic water stress. After repairs, estimated yield loss dropped from $21,800 to negligible—light took the pulse before any visible symptom appeared.
2. Recycling Line “Plastic Identification”
Recycling plants struggle with black plastic bags mixed with ABS and PS. Visually identical, their reflectance curves in the shortwave infrared (900–1700 nm) diverge sharply. High-speed pushbroom scanners examine each item on the fly, triggering pneumatic valves to sort materials by spectral ID—no line stoppage required.
Three Common Misconceptions
1. “More channels are always better.”
False. 1,200 channels sound impressive, but density doesn’t equal usefulness. If target differences concentrate in three bands, the remaining thousand-plus just consume storage. The correct approach is matching spectral range to application: 400–1000 nm suffices for leaf analysis; identifying plastics or pharmaceutical coatings demands extension to 1700 nm. Range relevance beats channel count.
2. “Hyperspectral replaces laboratory testing.”
Not entirely. It excels at rapid screening and large-area ranking, flagging “suspicious areas.” Precise quantitative calibration still requires lab verification to build models. Think of it as a scout, not a judge.
3. “Raw images equal reflectance.”
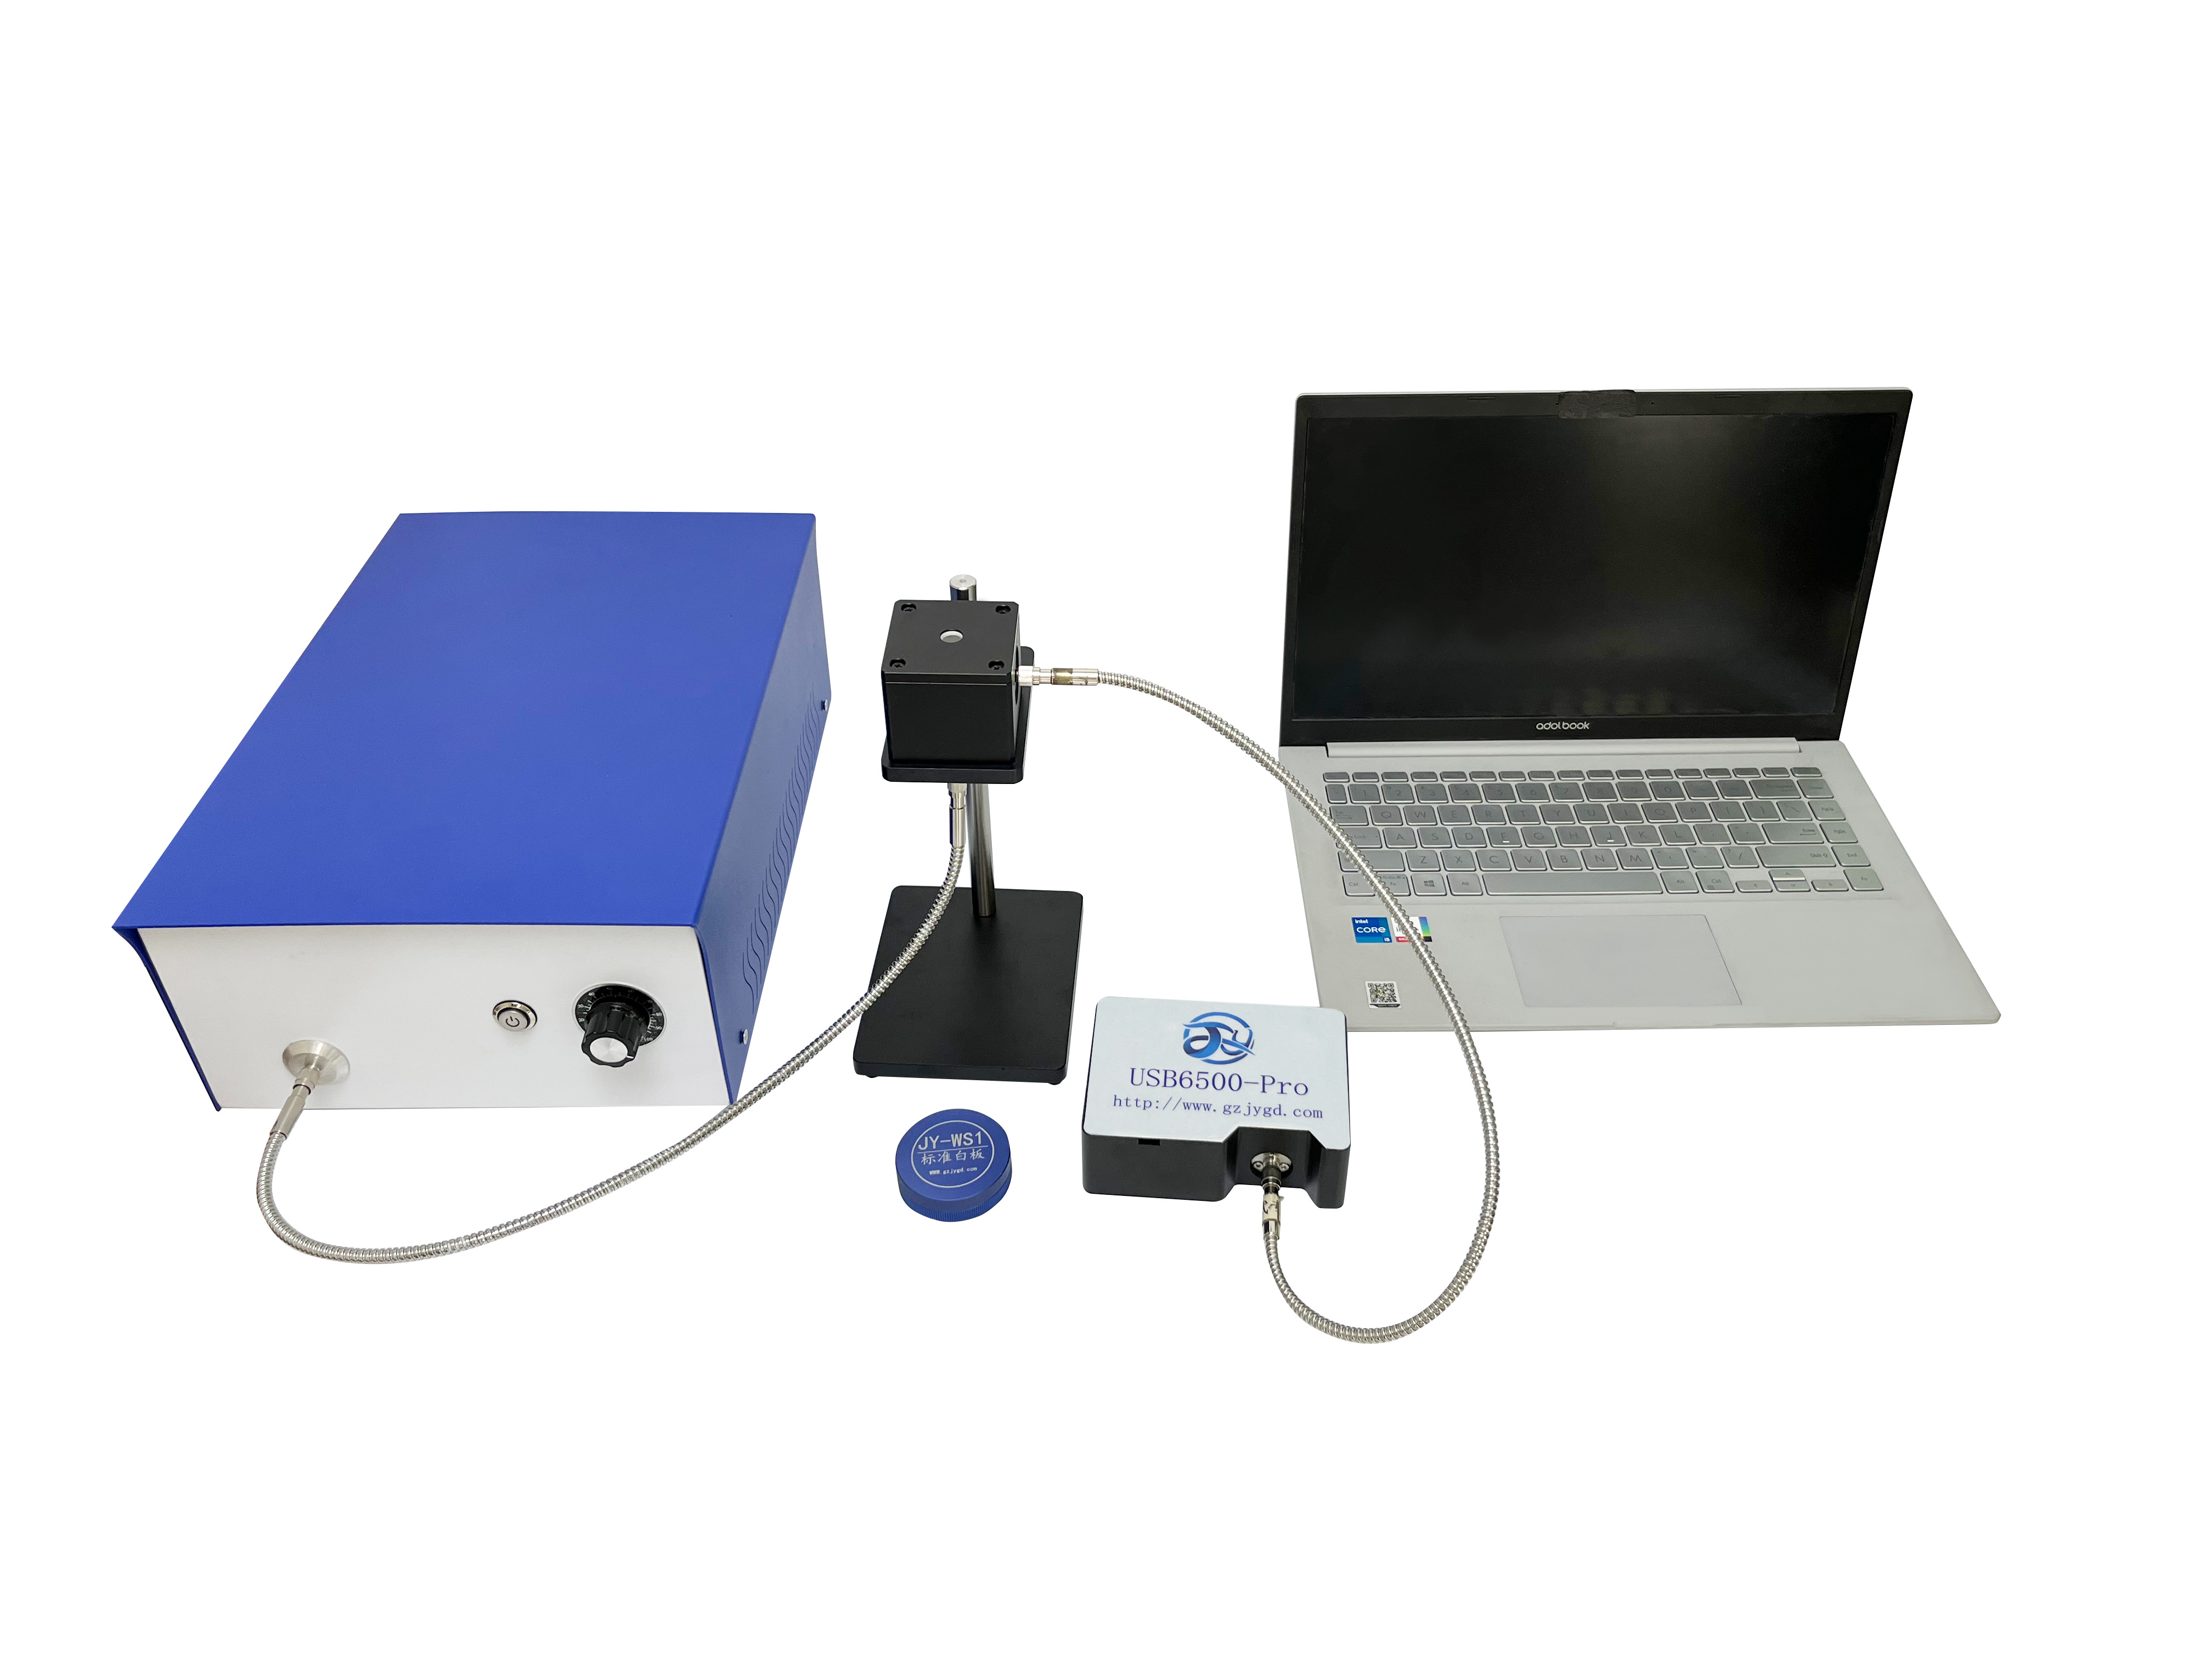
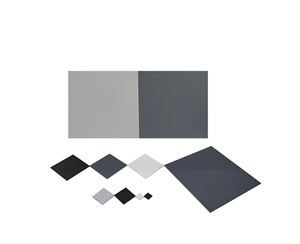
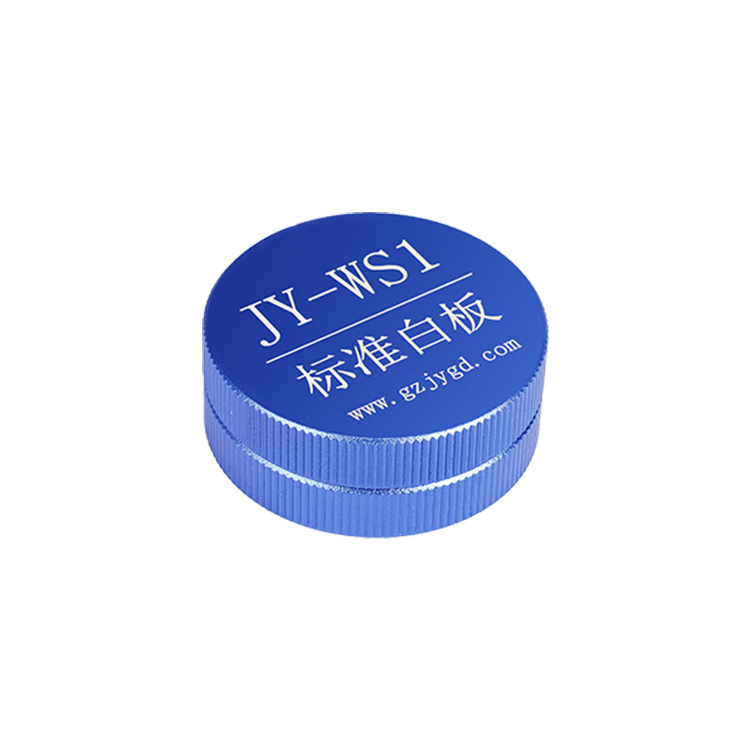
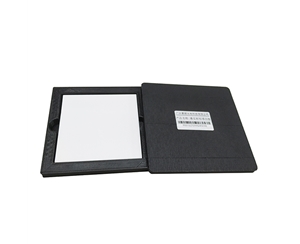
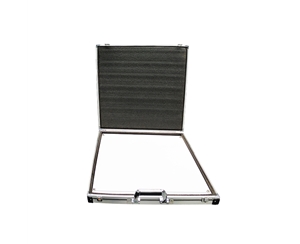
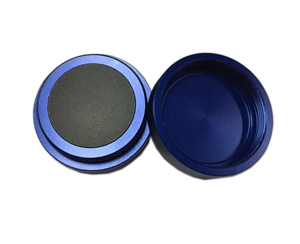
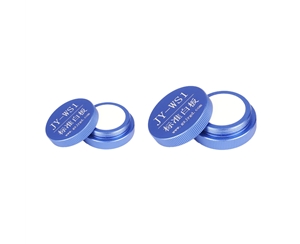
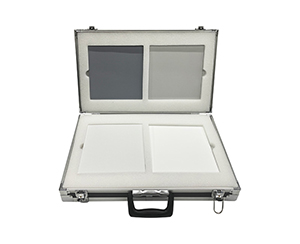
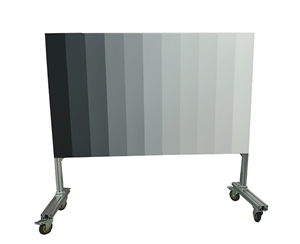
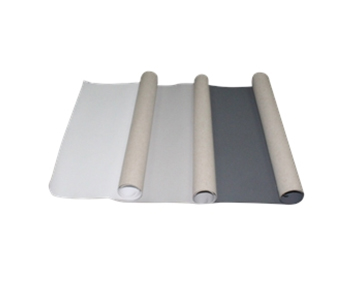
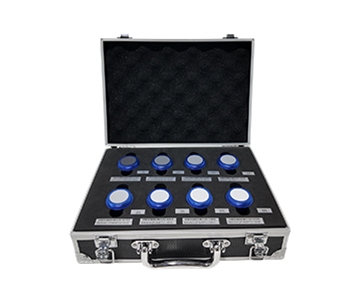
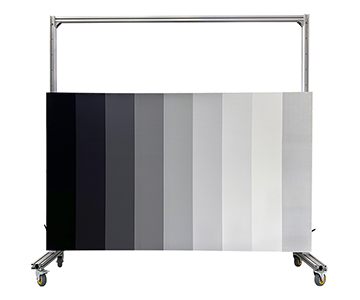
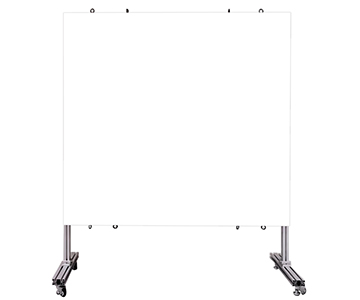
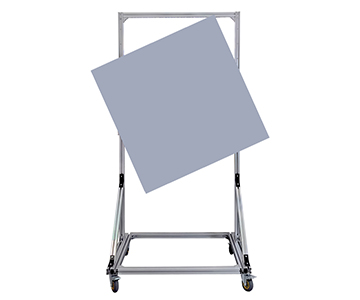
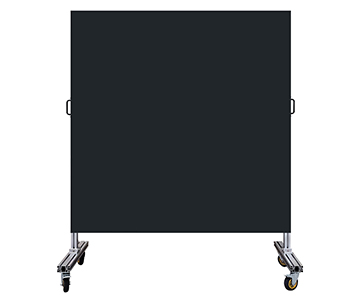
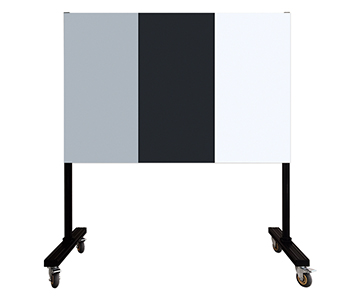
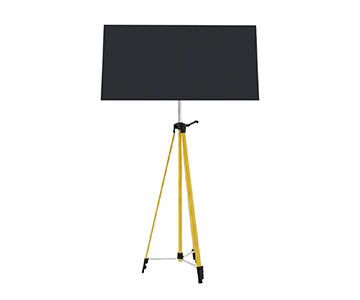
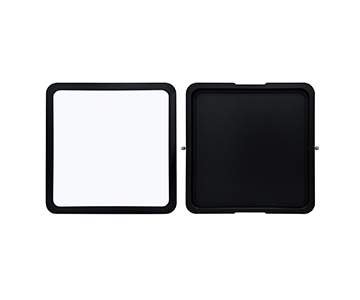
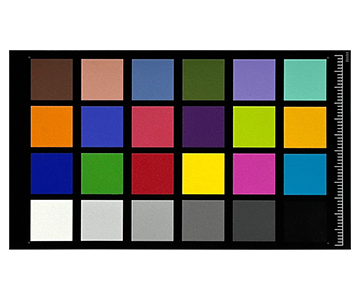
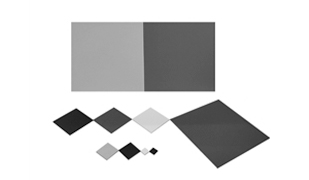
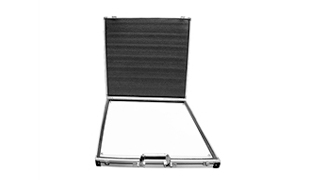
Uncalibrated images are merely brightness maps. Without white-board calibration, calling them reflectance is like using an un-tared scale—you get relative weight, not true weight. Radiometric calibration and illuminance correction are non-negotiable steps.
Further Reading (Public Resources)
Before visiting any brand page, consult these third-party materials:
•ISO 11146 series: General methods for laser beam and optical measurement, helping you understand spatial resolution apertures.
•ISO 13468 and ASTM D1003: Standards for total transmittance and reflectance, defining measurement values for plastic films.
•IEEE Xplore and SPIE Digital Library: White papers on vegetation indices and spectral band correlations.
When selecting equipment, confirm compliance with ISO 14976 or SEMI MF1840 for film thickness measurement system calibration to ensure complete metrological traceability, especially if the device also characterizes thin-film samples.
Honest Limitations and Boundaries
Hyperspectral is not a universal magnifier. First, pushbroom systems depend on stable platform motion; drone vibration or sudden wind gusts can misalign slit imaging, inflating post-processing costs. Second, data volume is a real headache: a single full-spectrum push creates not just one image but a wavelength cube, burdening storage, computing power, and analyst time. Airborne models equipped with 1 TB solid-state drives may still fall short during long-endurance missions. Third, shortwave infrared detectors are temperature-sensitive, typically operating within a narrower thermal window than visible-light devices; extreme factory environments demand additional thermal control. Before buying, ask yourself: do I truly need full-spectrum data, or will just two or three critical bands suffice?
FAQ
Q1: How does hyperspectral differ from multispectral imaging?
Multispectral uses a fixed set of roughly eight broadband filters—efficient but coarse. Hyperspectral grinds those bands into over 1,200 narrow slices, capturing fine detail at the cost of storage and processing. For rough agricultural zoning, multispectral works; for material composition identification, hyperspectral is essential.
Q2: Can you fly hyperspectral drones on cloudy days?
Yes, but absolute reflectance values may drift. A downward-light sensor enables real-time illuminance correction, compensating for most sky-light changes. However, heavy rain or strong backlighting remains unsuitable for quantitative data collection.
Q3: Can a standard factory computer handle the processing?
Light preview runs smoothly, but full-spectrum modeling demands a dedicated GPU and large RAM. Pseudo-color classification can run on edge devices; per-pixel curve fitting requires workstation-class configuration.
Q4: Which three parameters matter most when procuring a system?
Whether the spectral range covers your target absorption bands, whether spectral resolution is fine enough to separate adjacent peaks, and whether spatial resolution matches your flight
Q5: How can I independently verify that a hyperspectral camera isn’t overstating its specs?
Perform reflectance inversion using a standard diffuse reflectance white board, then cross-validate with known material samples. Simultaneously check the calibration certificate’s traceability chain to national metrology standards. Trust reproducible raw data, not demo videos.
Conclusion
The value of hyperspectral technology lies not in producing flashy images, but in translating light into a measurable language of matter. From farmland to production lines, it gradually converts empirical judgment into data-driven decisions. For detailed specifications and application notes on hyperspectral cameras, search “Jingyi Optoelectronics + hyperspectral camera” or visit our technical library.
Editorial Notes
Research Basis
: Product technical documentation, ISO 13468, ISO 14976, SEMI MF1840 public texts, and aggregated industry case studies.
Reviewed by
: Cai Xiaodong, Senior Application Engineer at Jingyi Optoelectronics, with 12 years of experience in optical inspection and spectral imaging equipment.
Sponsorship Disclosure
: Jingyi Optoelectronics manufactures hyperspectral imaging systems. Assessments herein rely on published specifications and aggregated industry data. No third-party compensation was involved.
Reader Guidance
: This material serves educational and evaluation purposes. Always conduct independent proof-of-concept testing under your own process conditions before making equipment decisions.
Publication Date
: November 2026