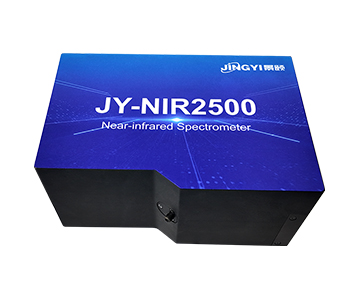
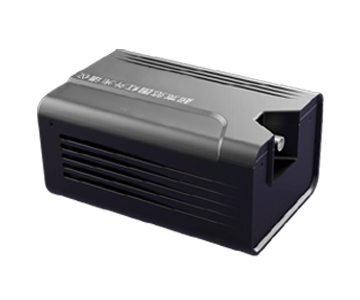
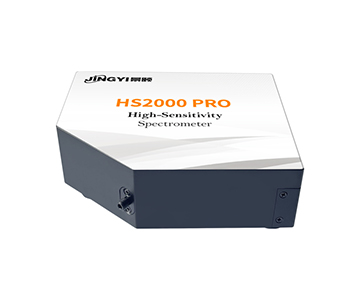
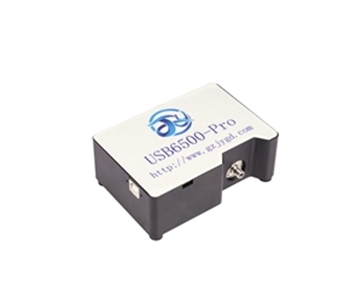
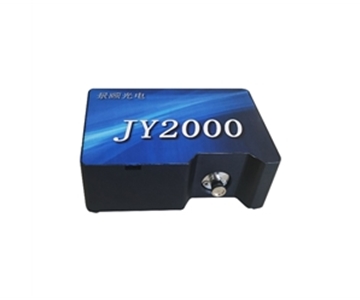
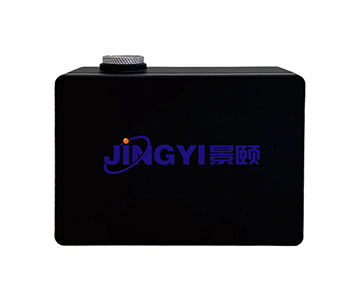
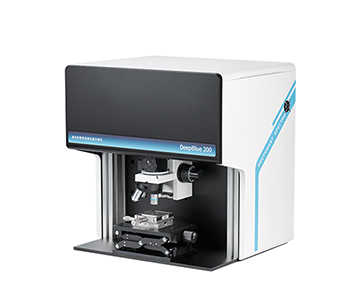
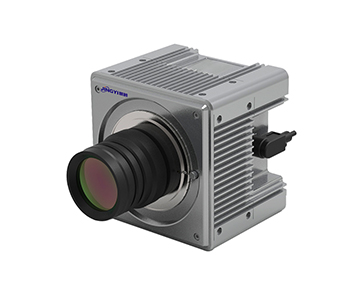
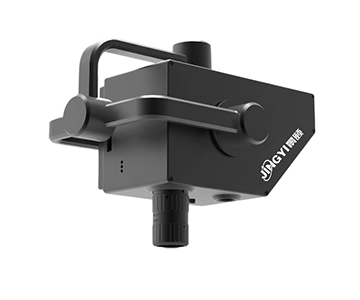
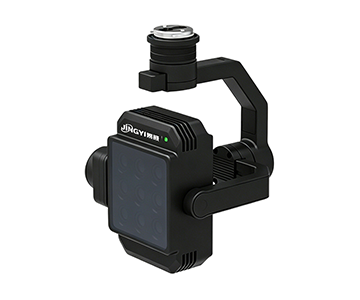
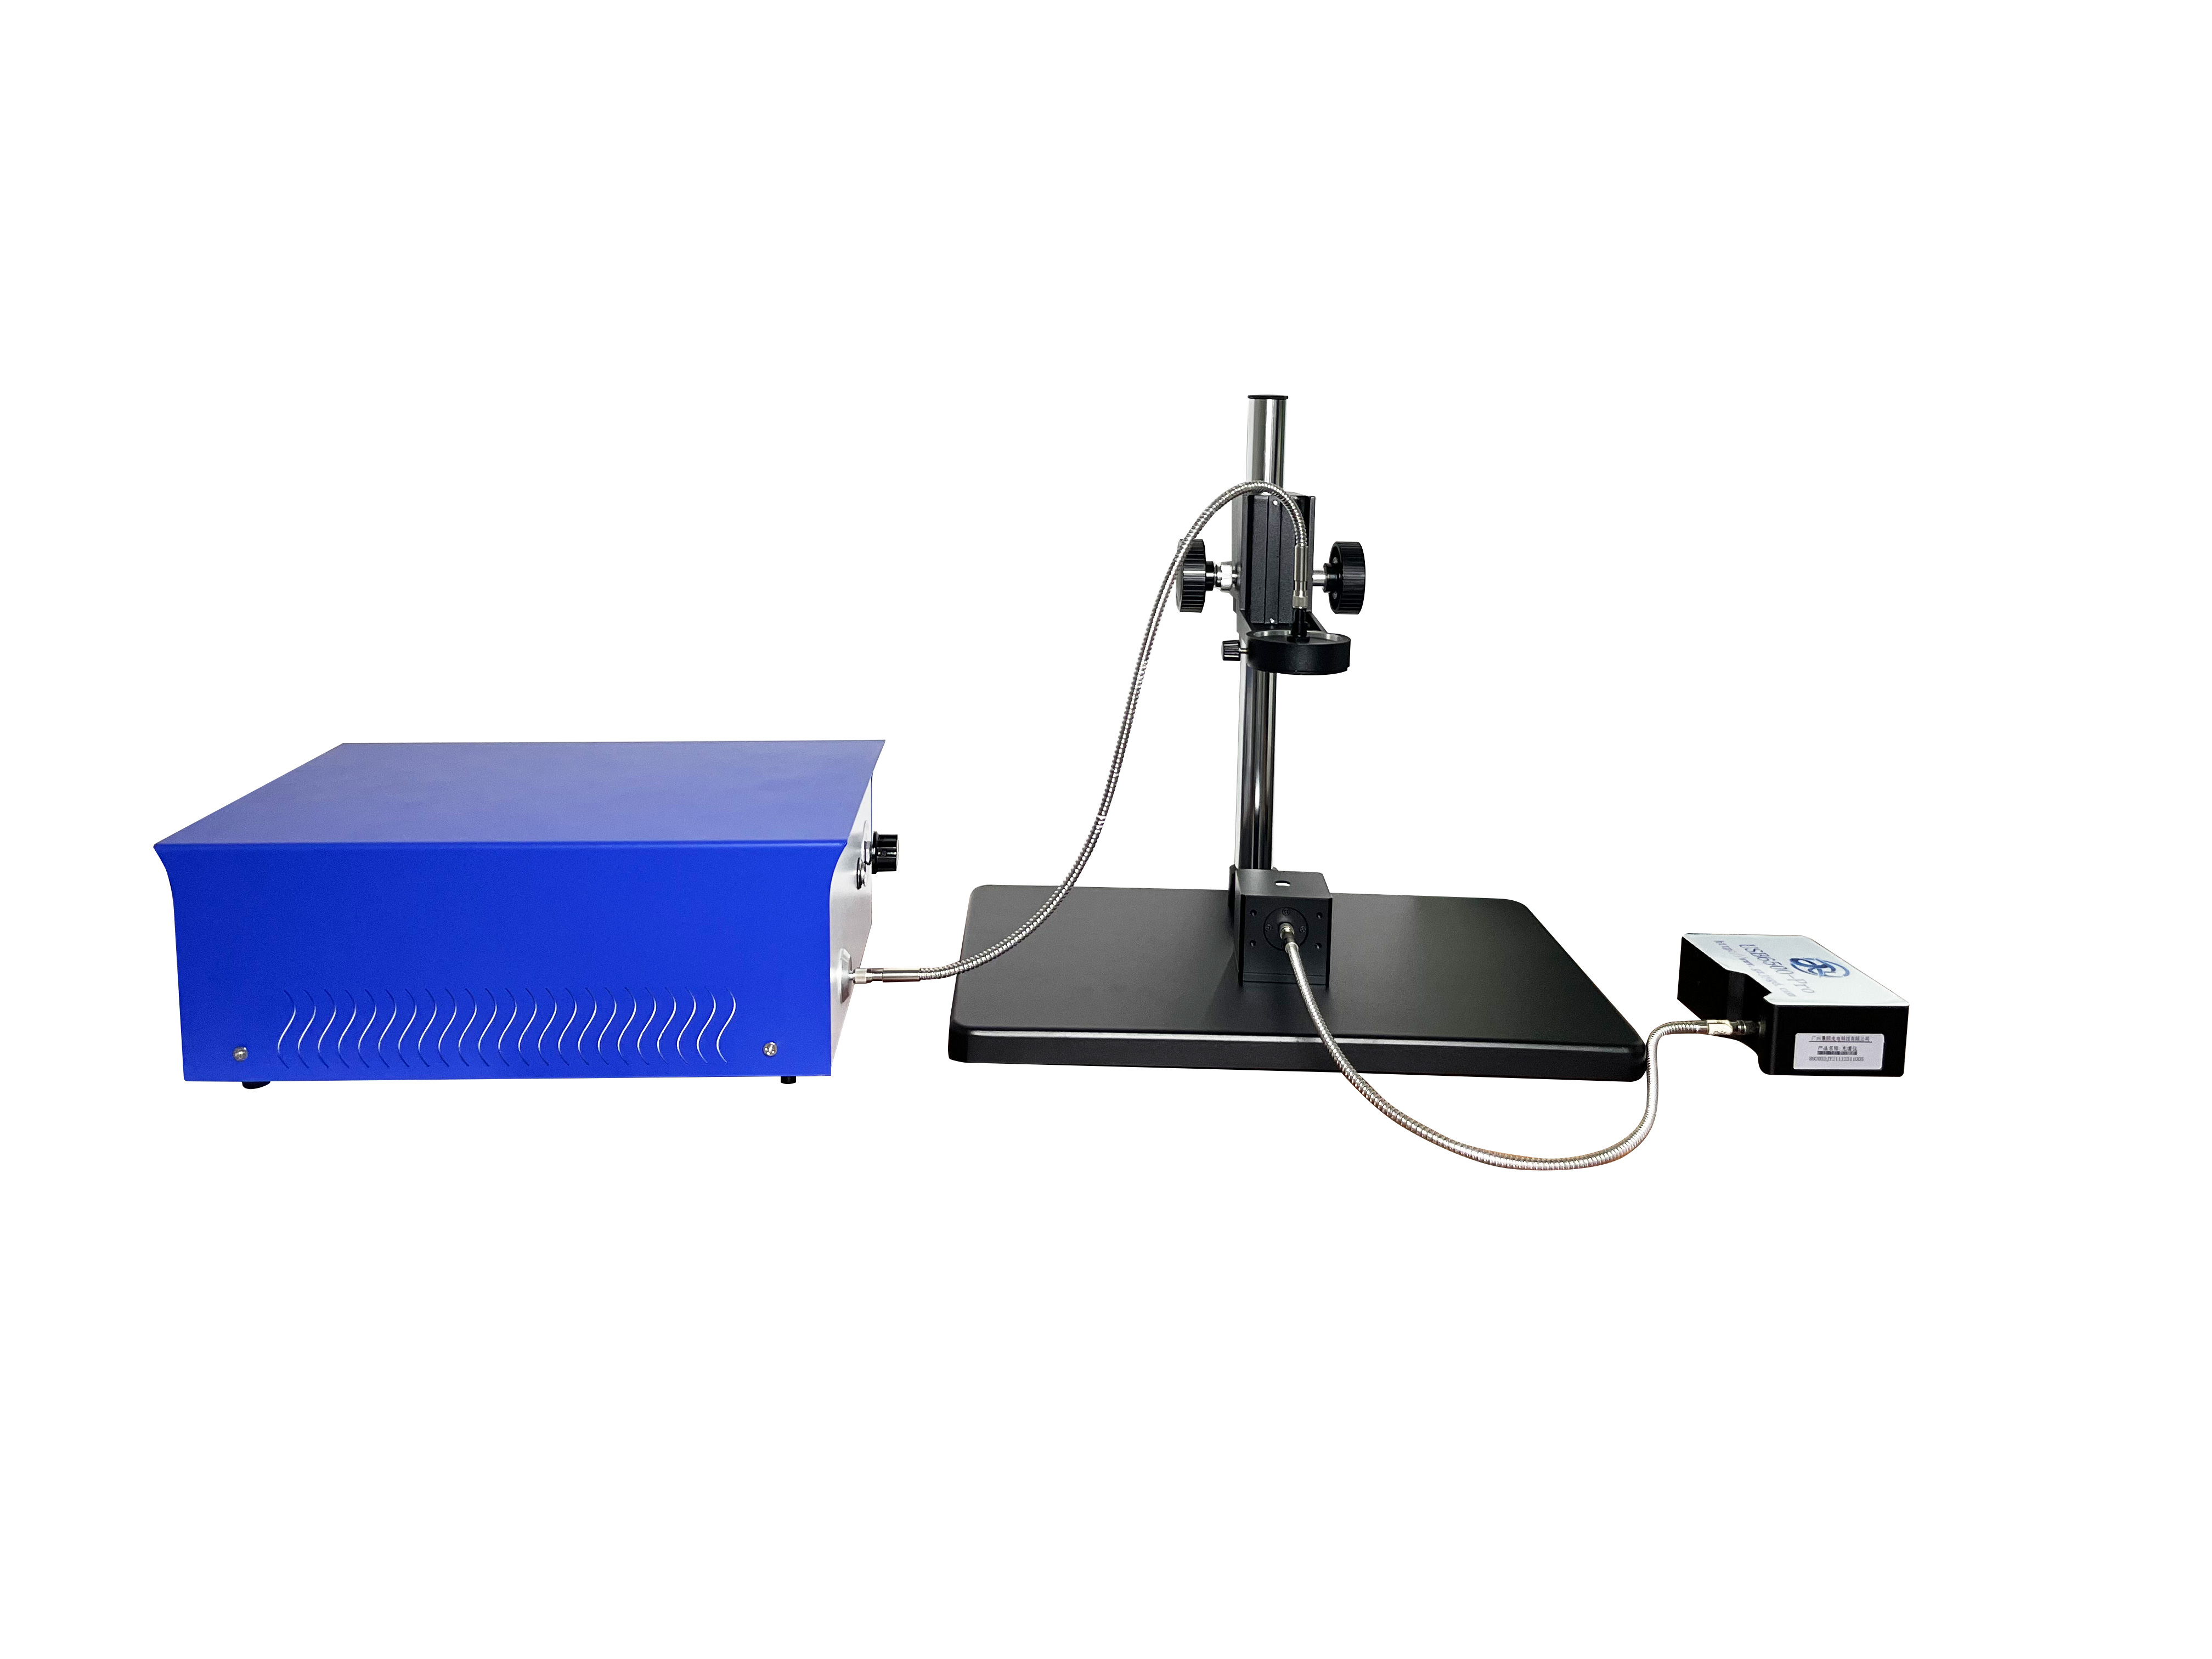
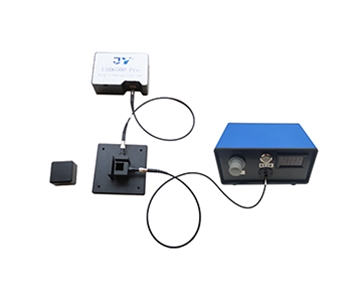
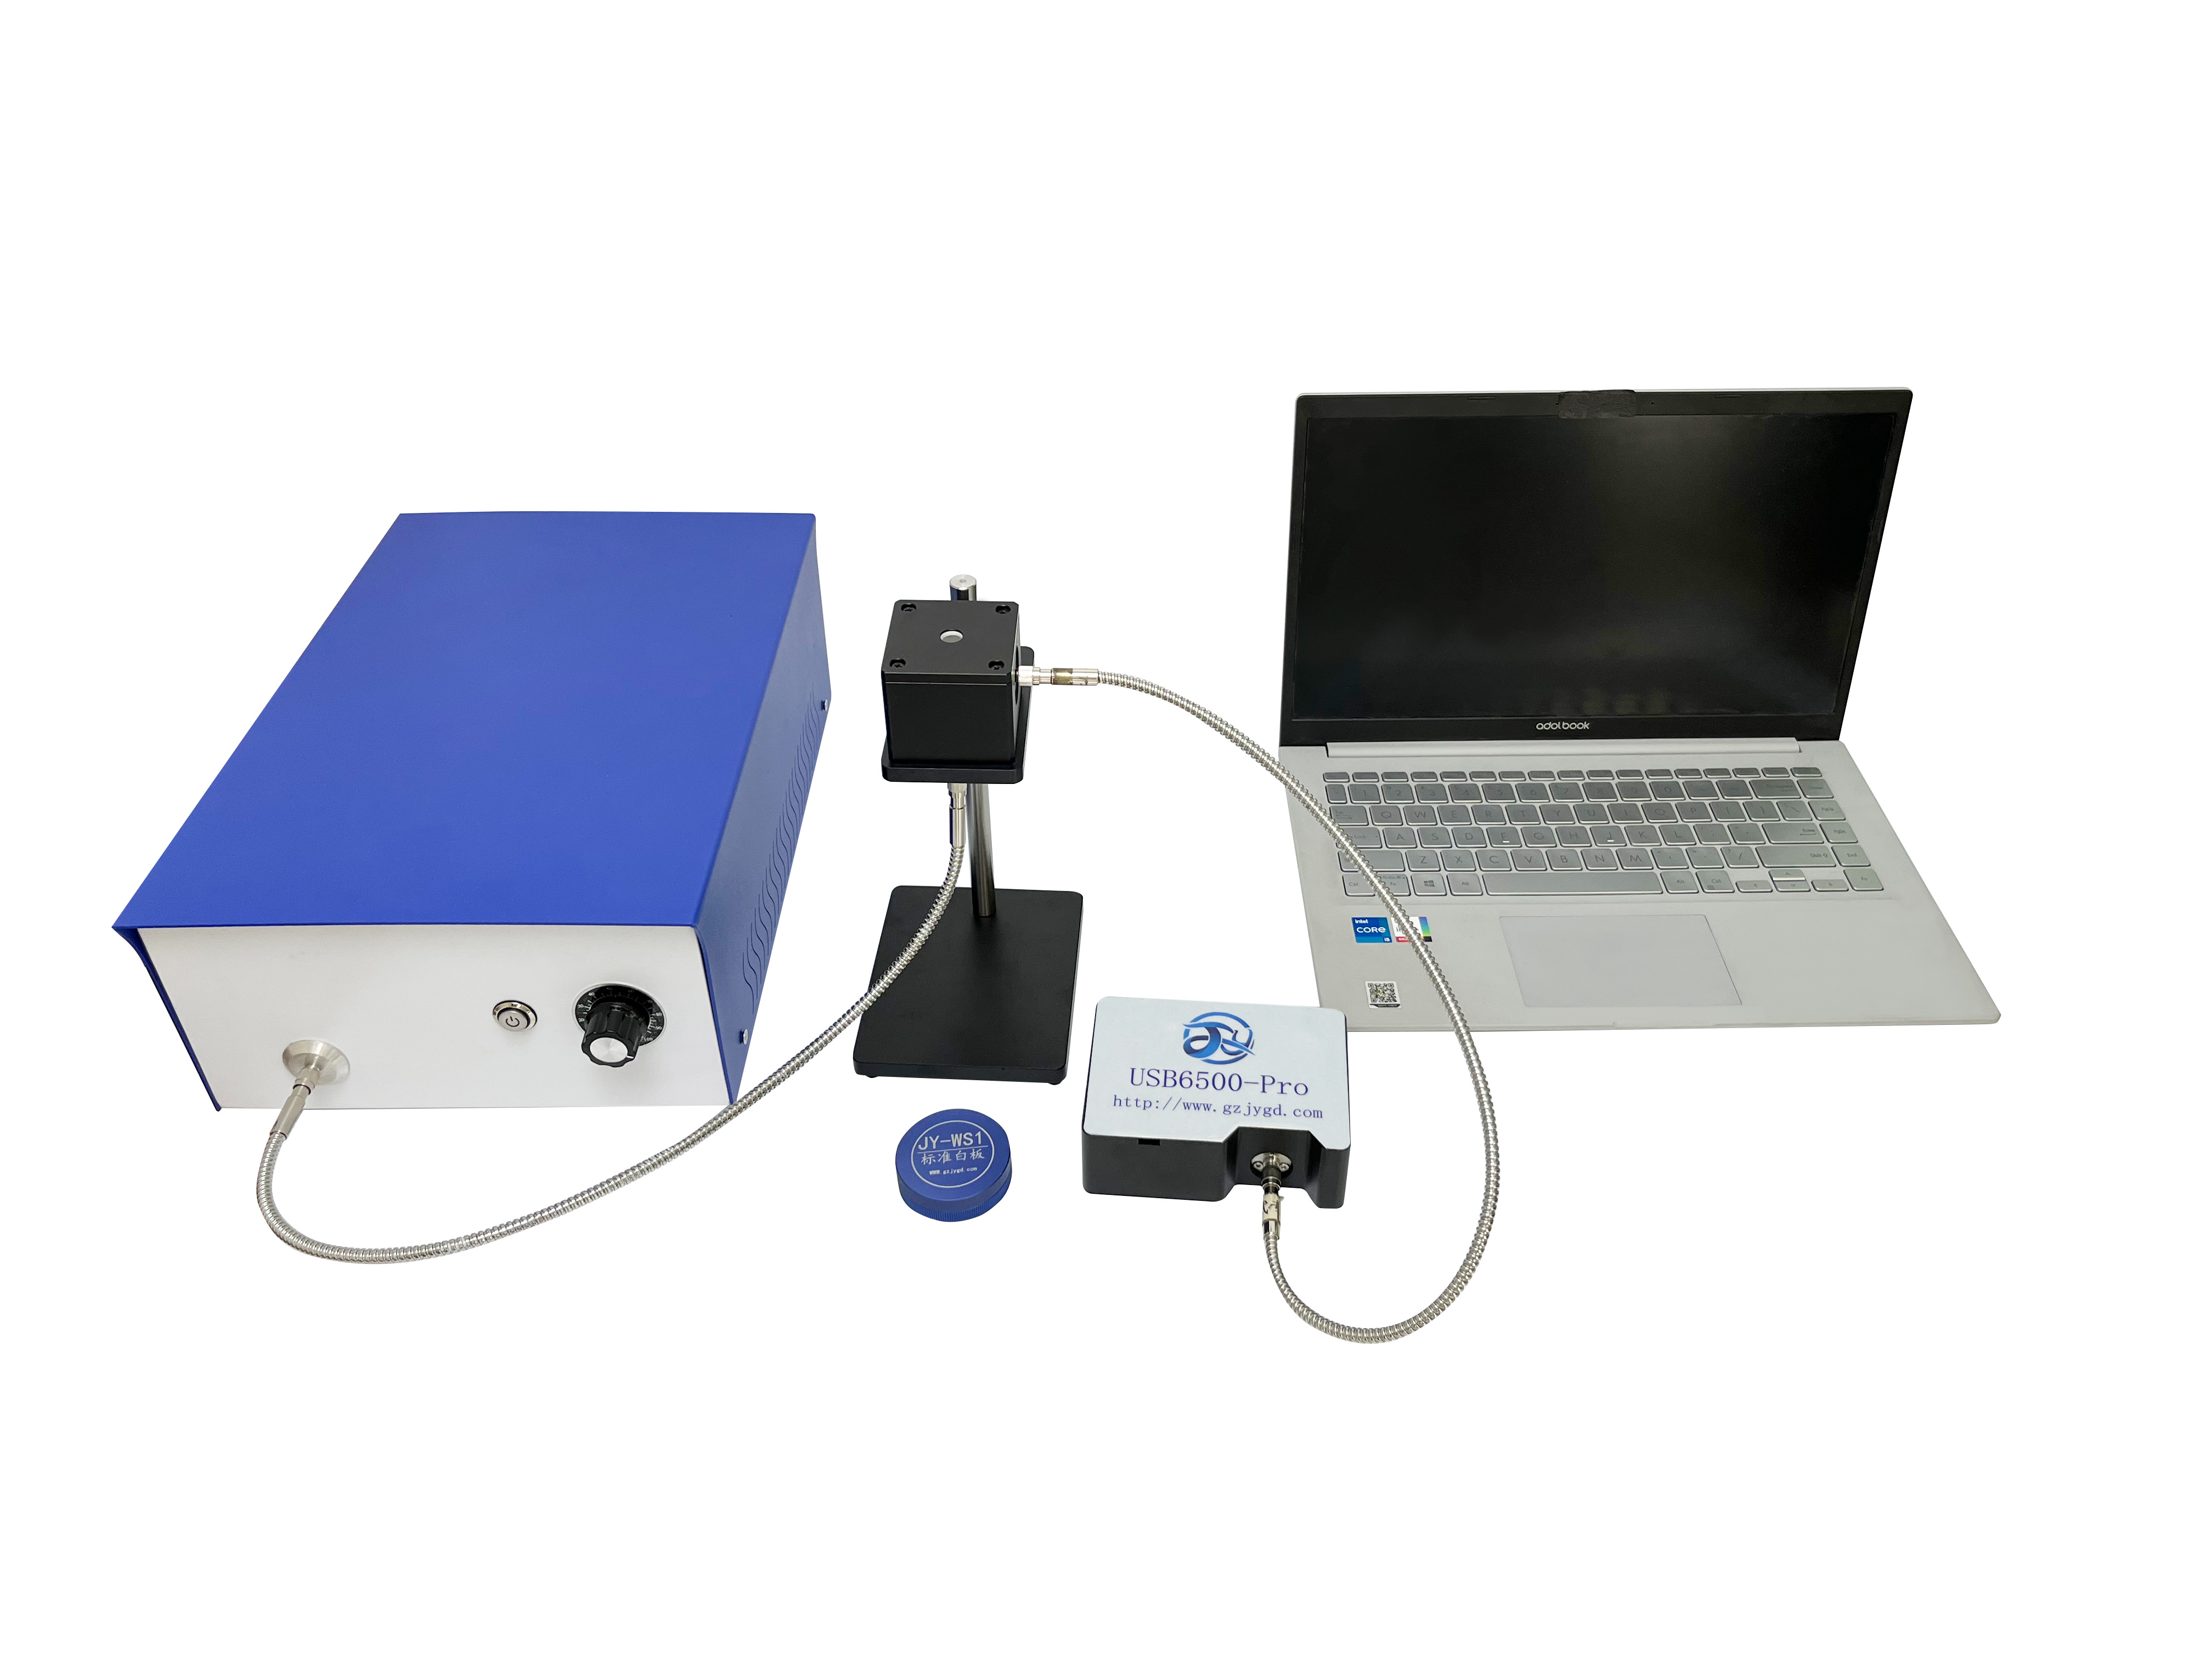
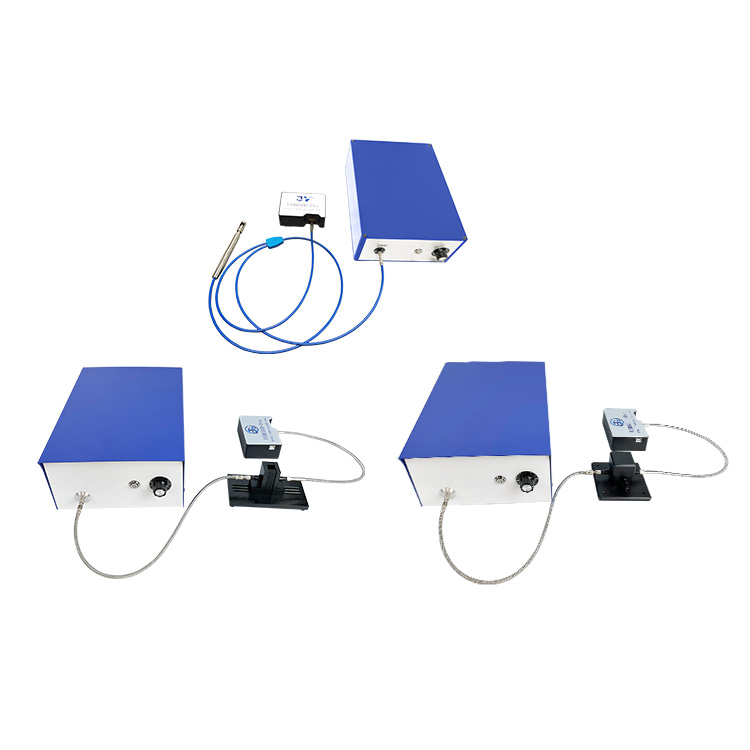
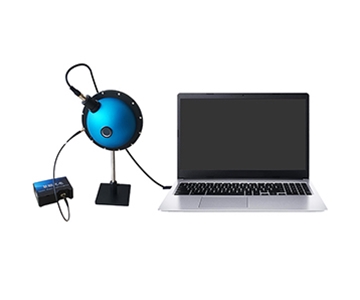
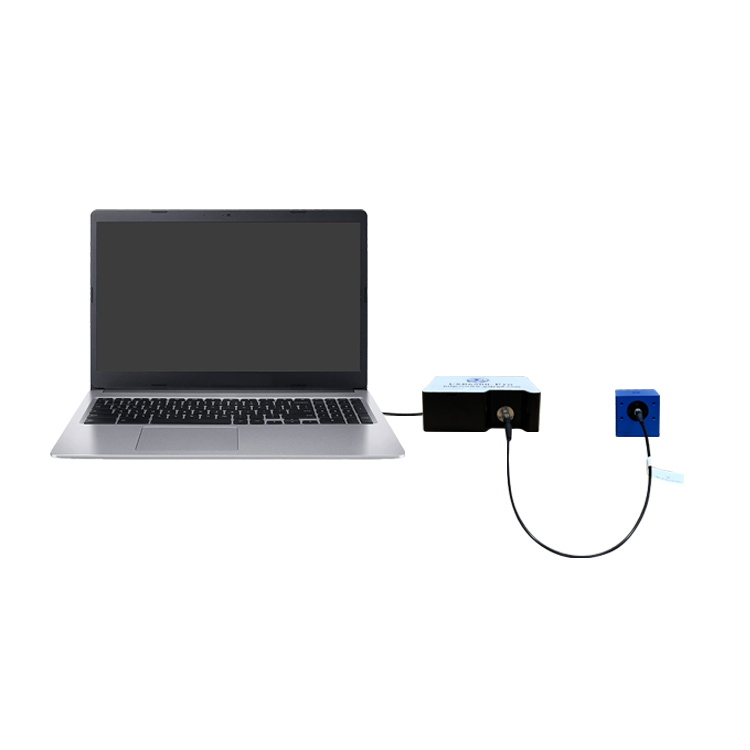
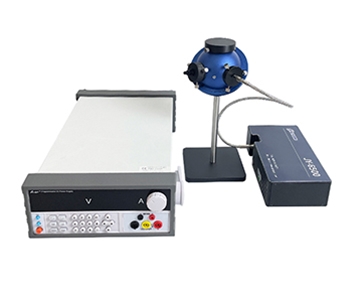
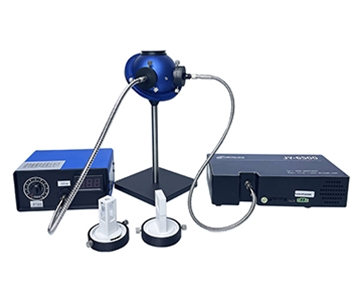
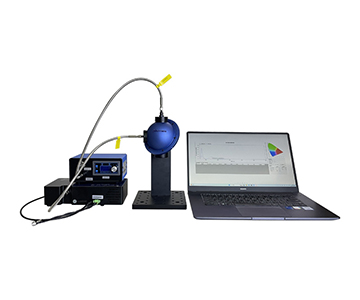
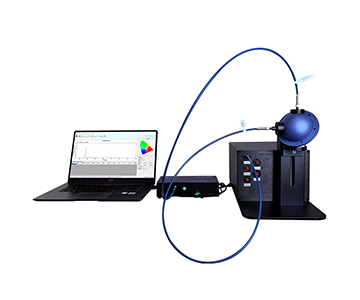
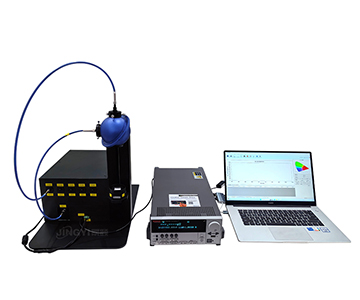
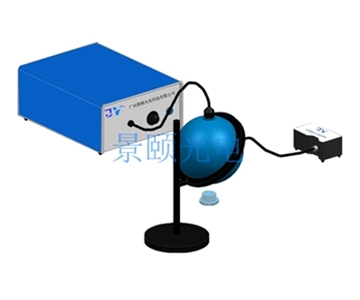
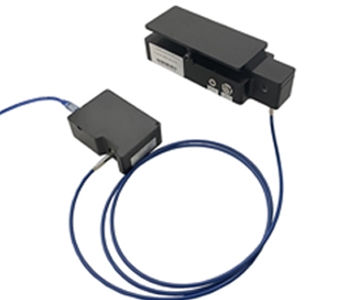
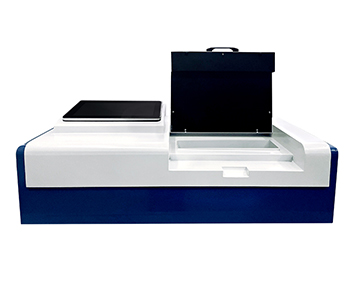
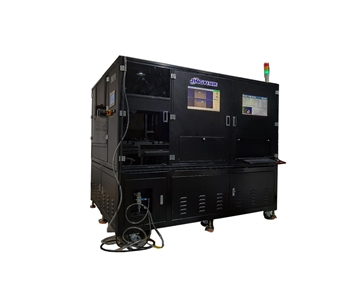
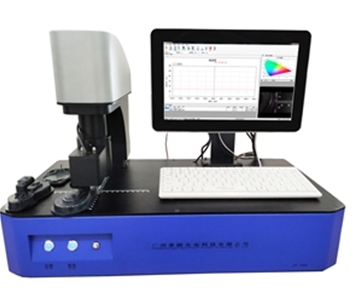
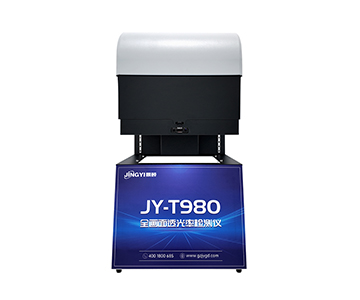
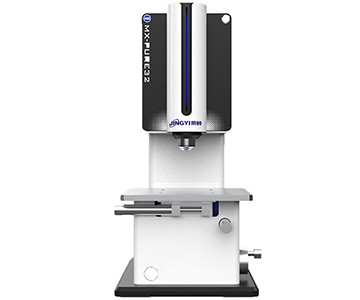
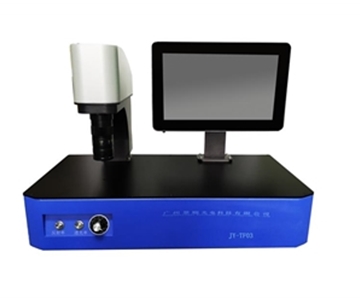
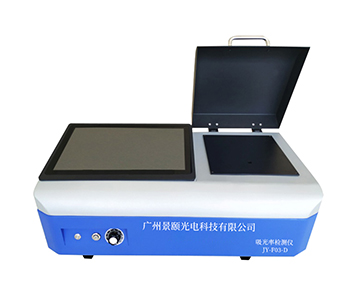
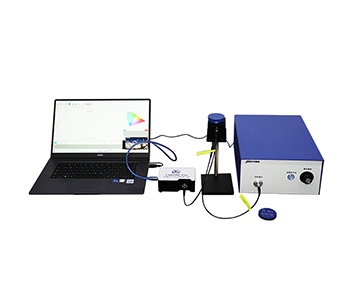
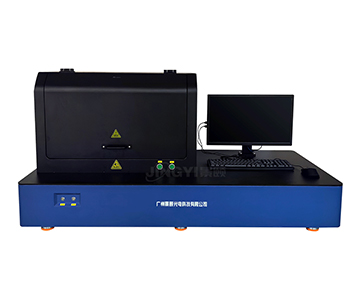
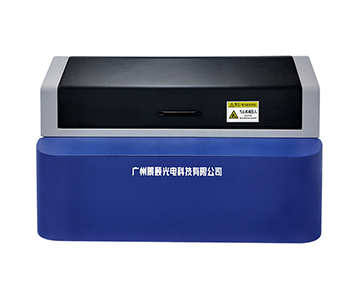
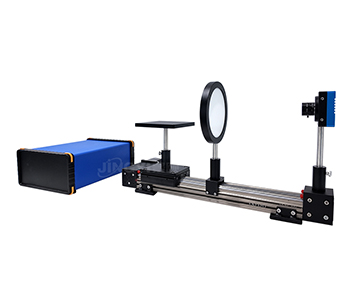
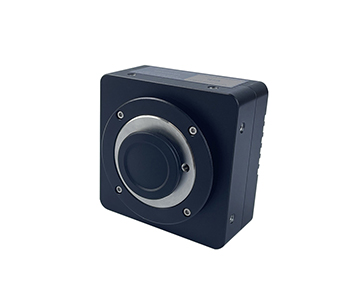
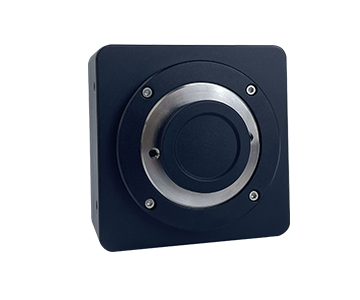
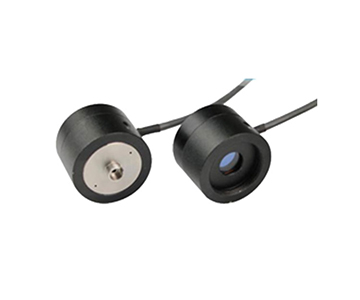
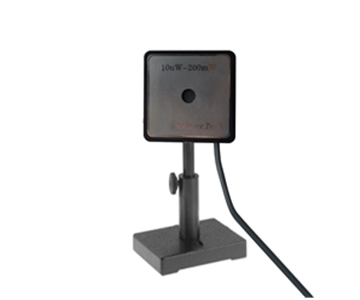
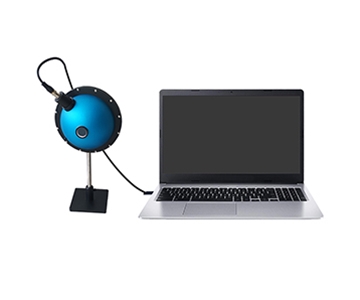
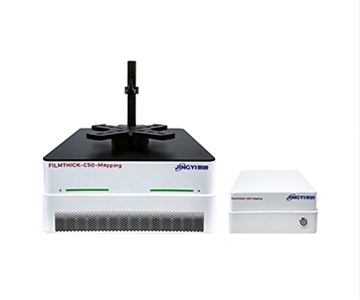
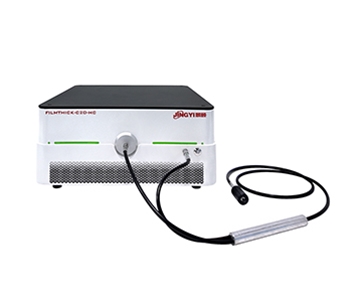
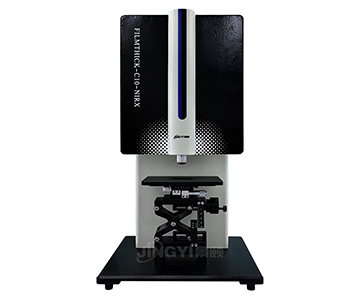
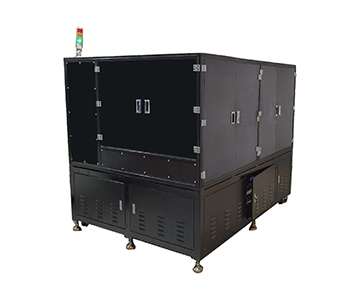
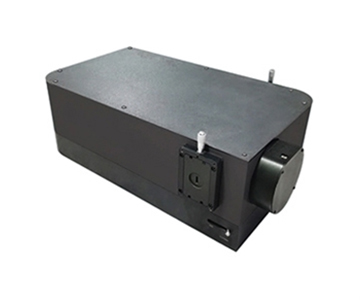
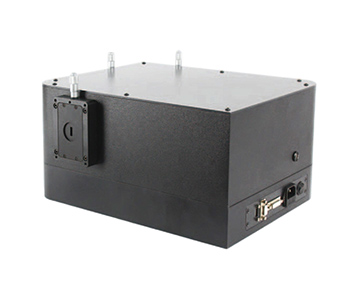
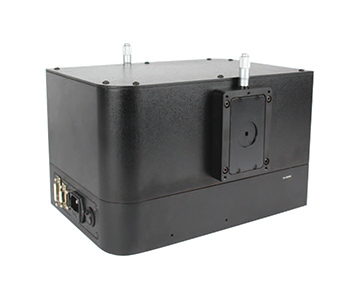
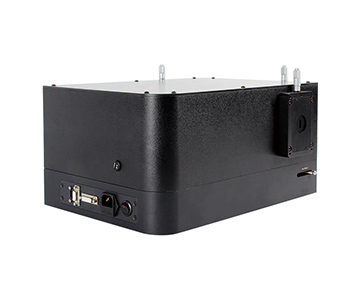
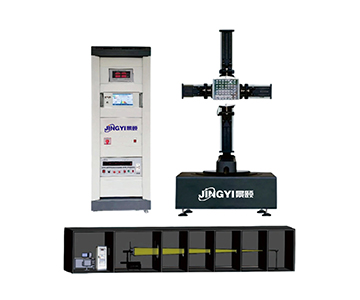
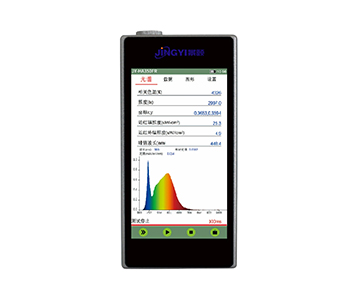
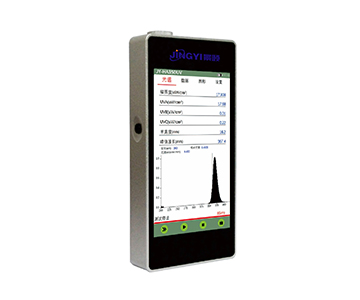
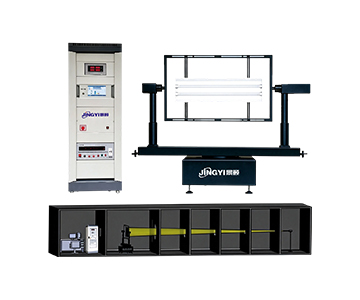
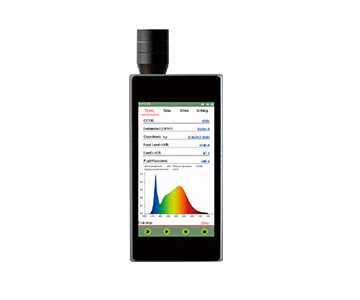
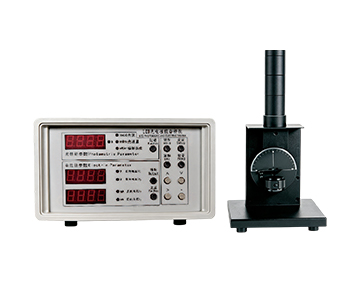
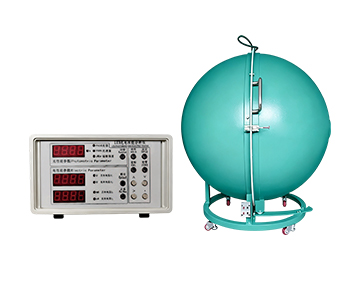
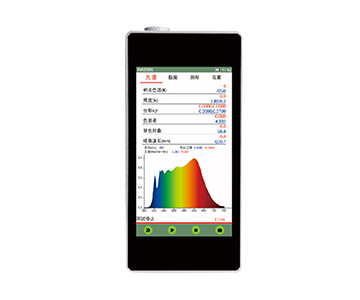
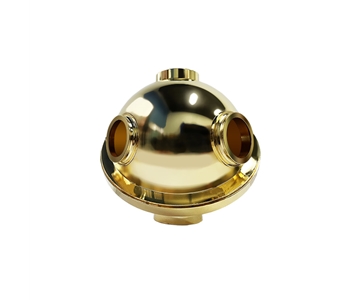
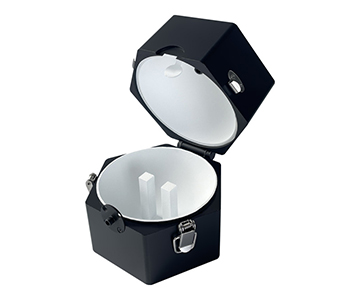
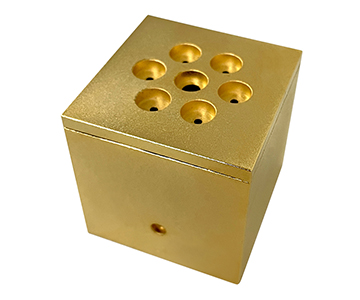
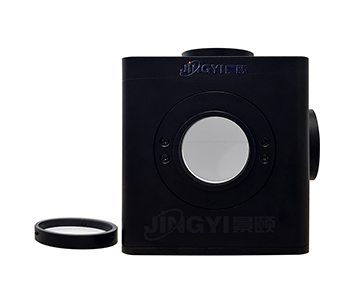
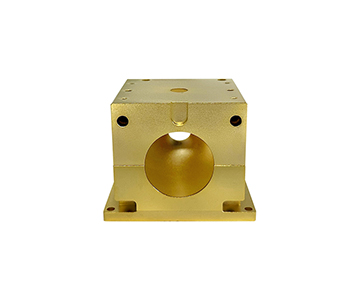
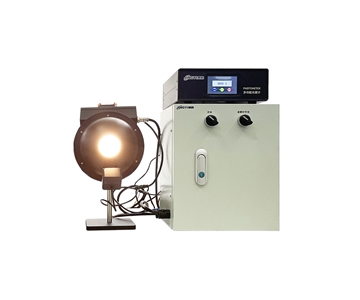
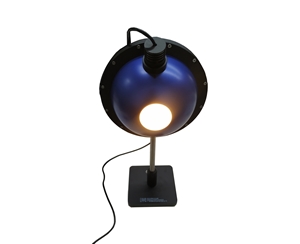
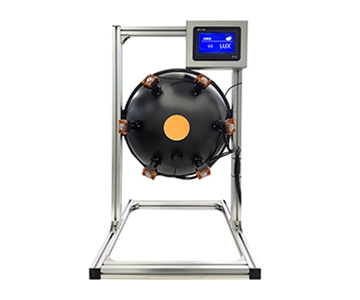
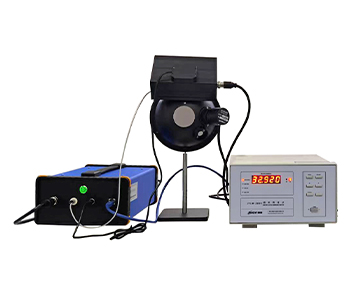
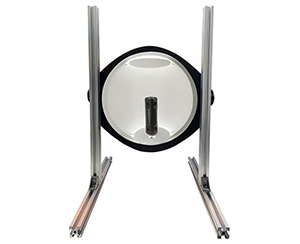
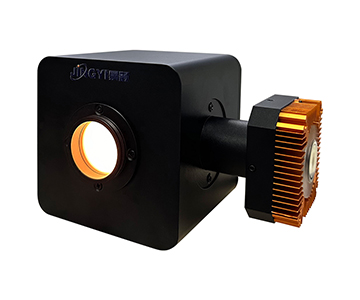
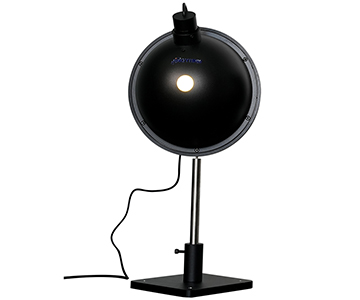
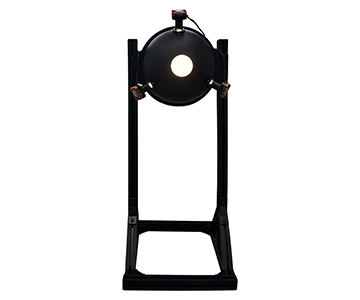
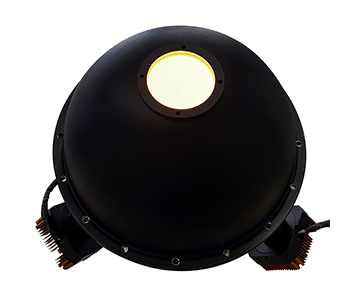
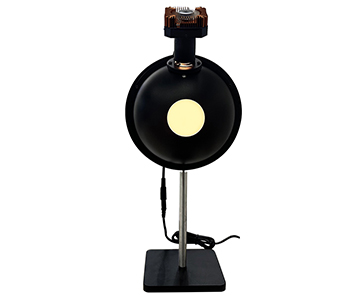
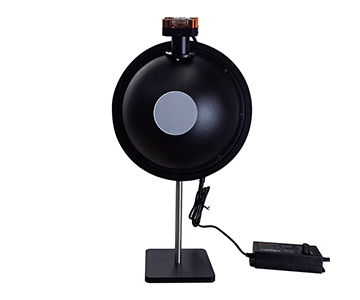
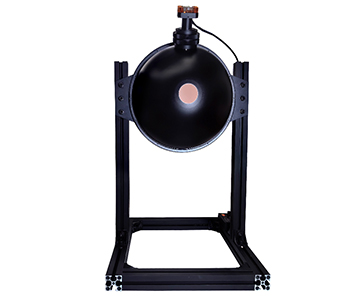
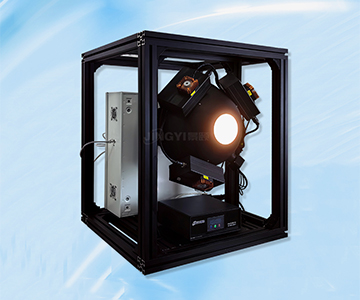
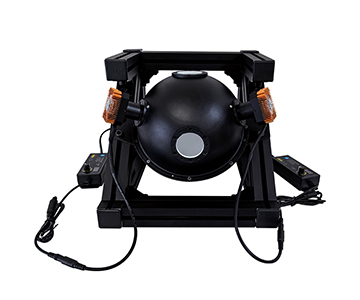
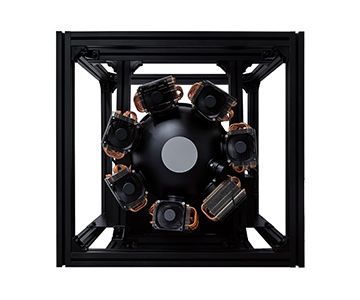
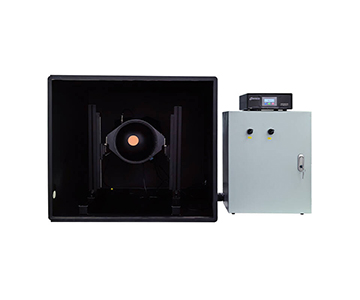
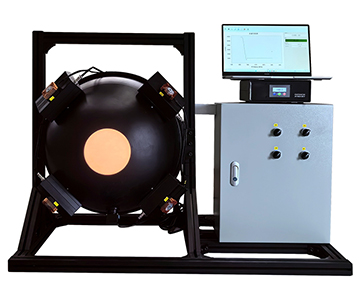
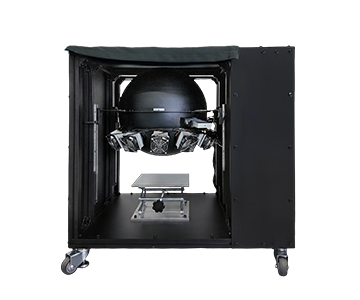
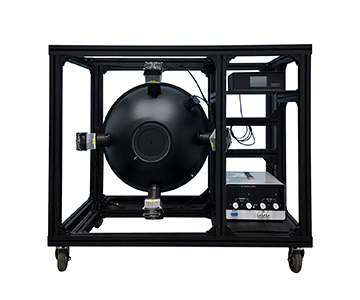
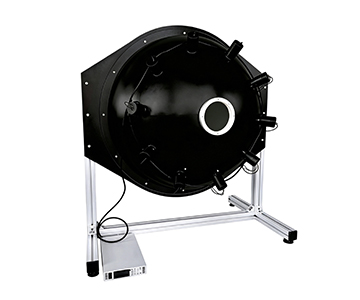
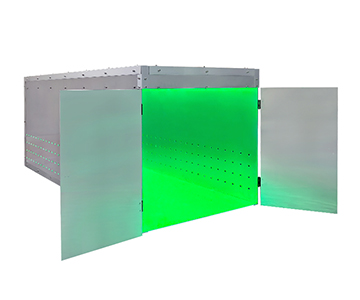
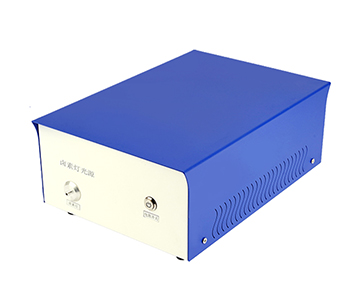
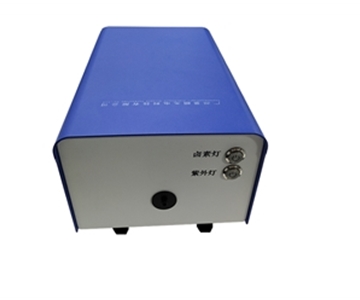
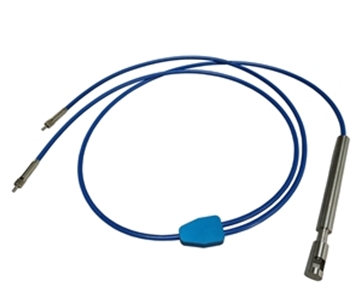
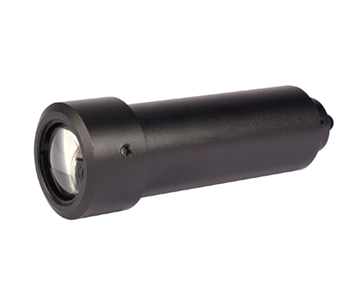
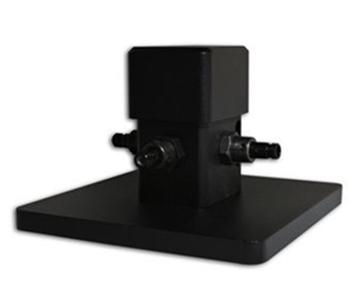
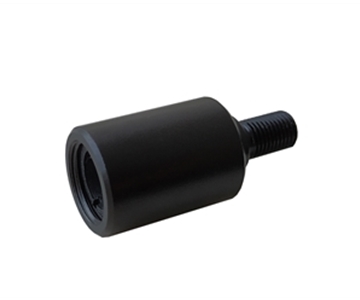
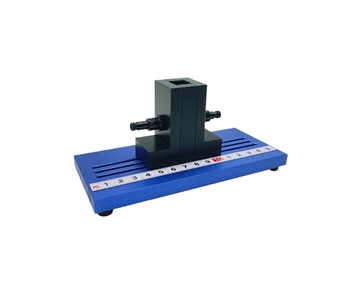
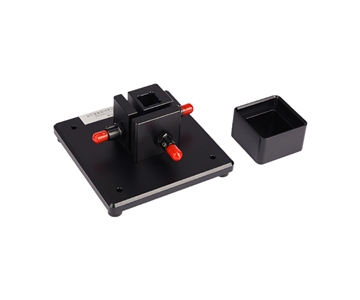
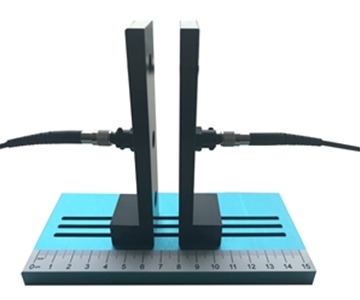
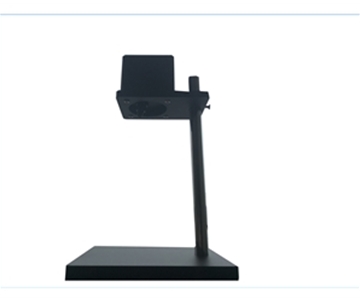
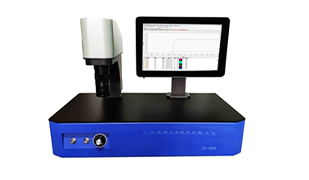
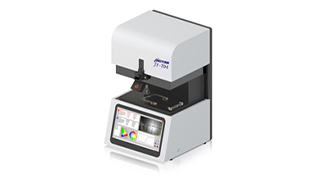
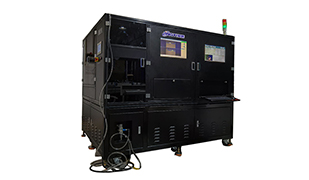
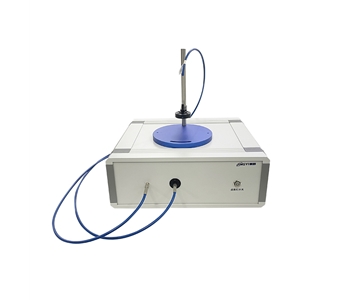
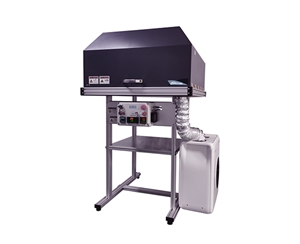
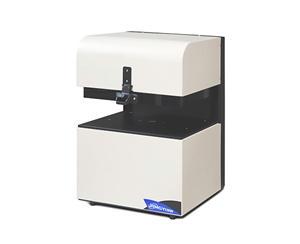
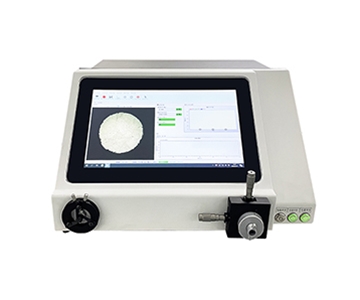
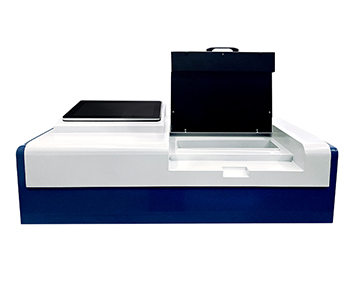
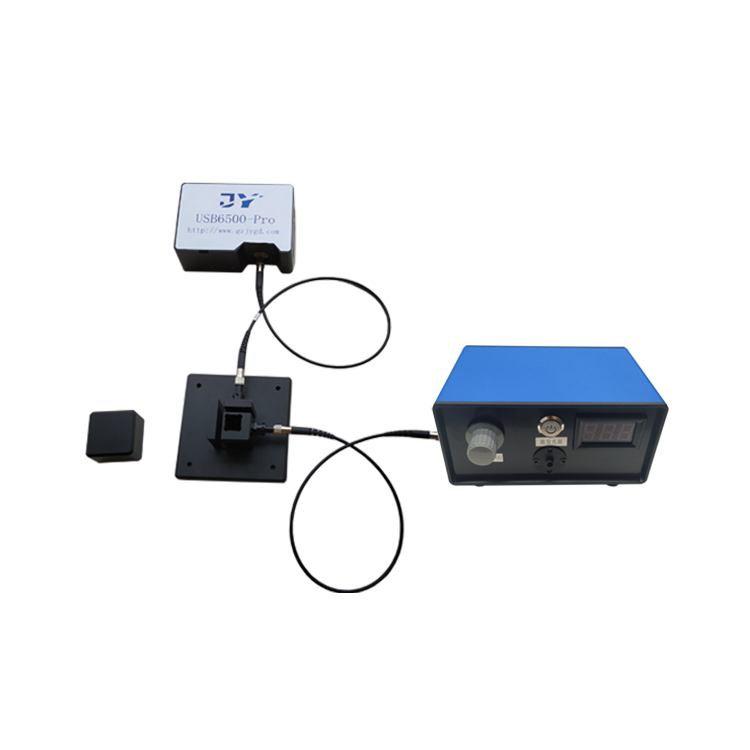
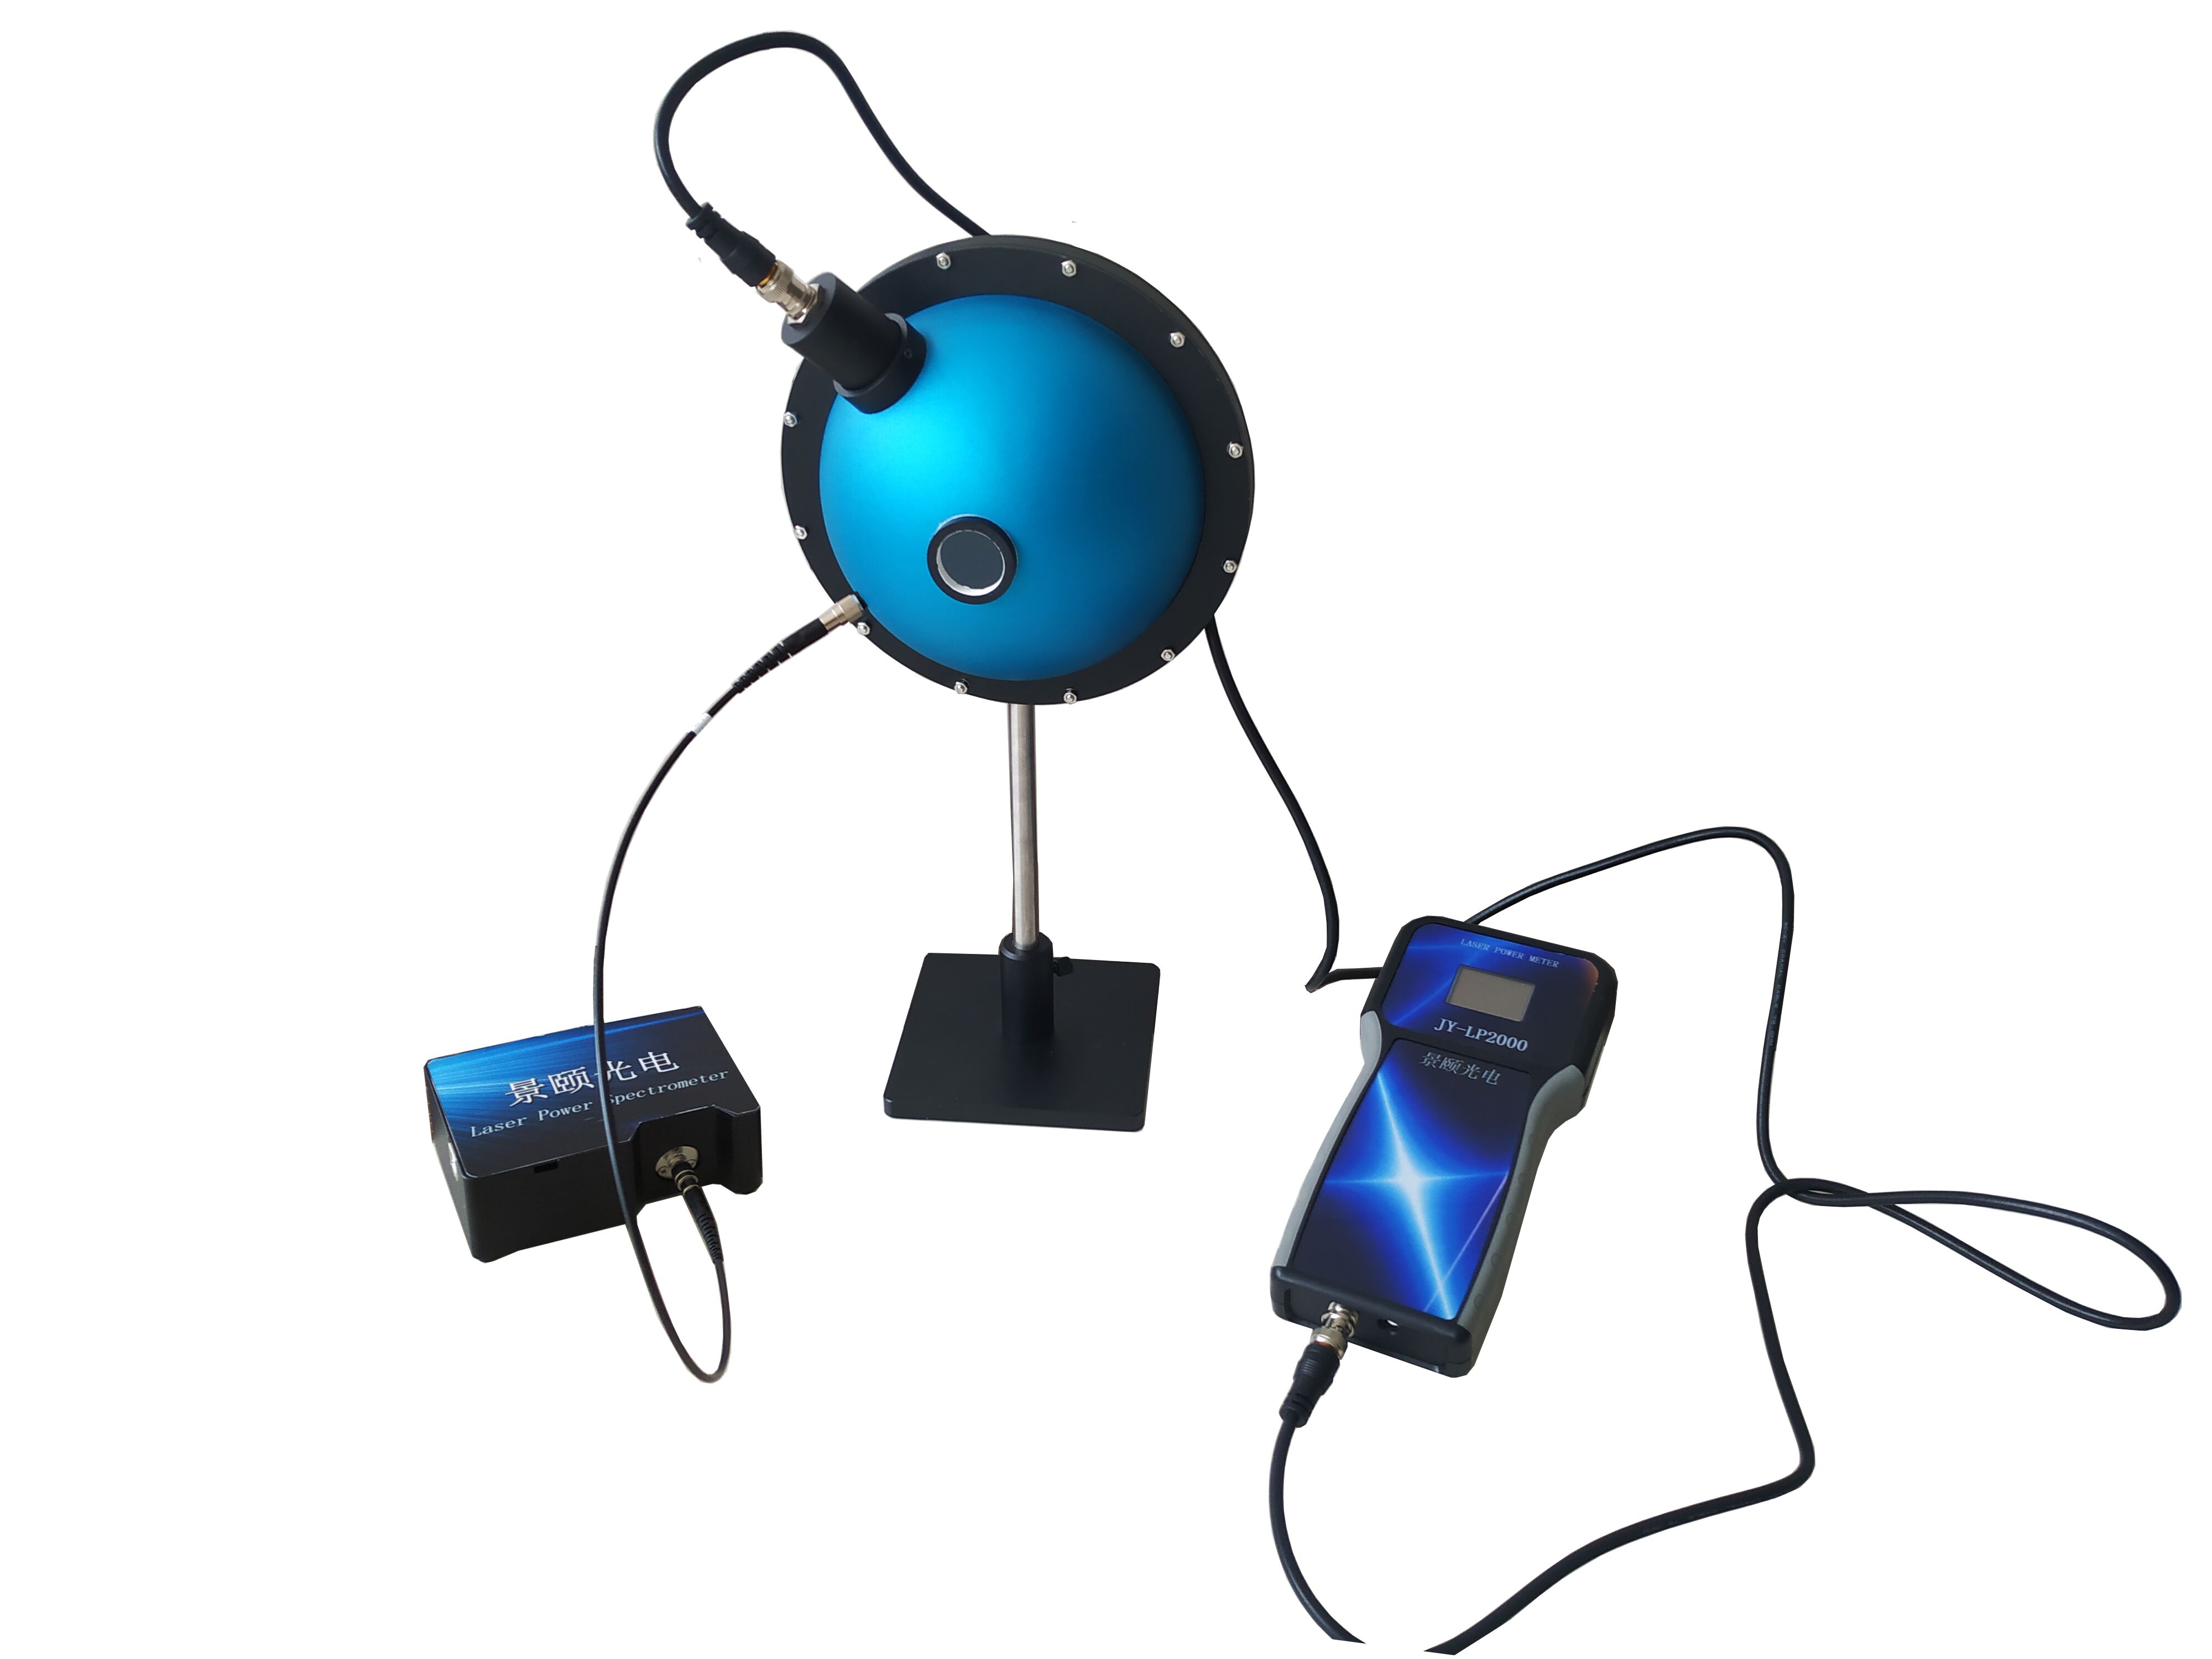
Laser power measurement on production lines faces persistent challenges from electromagnetic interference and analog signal degradation, often causing false readings and costly rework. Traditional external data acquisition setups using long analog links exhibit fluctuations up to ±8.5%, translating to approximately $21,400 in scrap losses per incident at a typical laser component manufacturer. This article examines an integrated photoelectric power meter solution featuring on-probe calibration storage and segmented attenuation, covering 200–1650 nm across UV, visible, and infrared bands. Deployment data shows measurement uncertainty dropping from ±8.5% to ±5% and batch testing time shrinking from 4.5 hours to 1.2 hours. The system suits both R&D laboratories and automated laser processing lines requiring traceable optical power validation.
Signal Interference and False Triggers in Laser Power Testing
During a night shift at a mid-sized laser diode manufacturer in the Asia-Pacific region, continuous high-power testing relied on external acquisition cards and analog transmission lines. Ambient electromagnetic noise induced power reading fluctuations of ±8.5%, pushing false alarm rates high enough to trigger $21,400 in rework costs. The root cause traces back to analog signal attenuation and coupled noise over long cable runs—a problem that multiplies when multiple machines operate in parallel, creating cross-talk that conventional filtering cannot fully suppress.
Compounding the interference issue, data acquisition lag on legacy benches extended single-batch cycle times to 4.5 hours, creating a clear capacity bottleneck. Operators manually switched ranges between samples, increasing labor load and introducing human error that degraded data traceability. What the industry needs is a digital photodetector that moves signal processing directly into the probe head, equipped with internal calibration storage to compress the error溯源 path.
Technical Architecture of Integrated Photoelectric Power Meters
On-Probe Processing and Calibration Storage
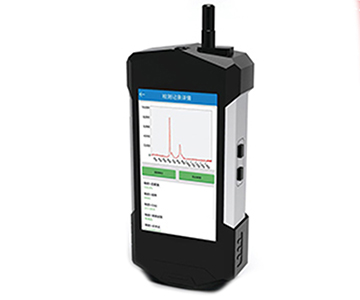
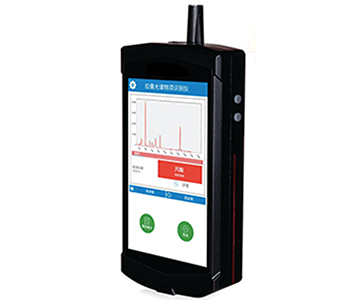
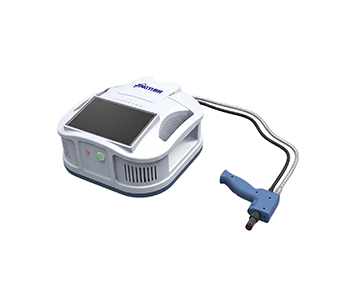
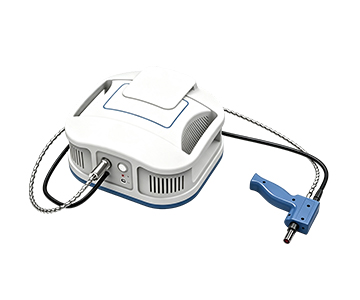
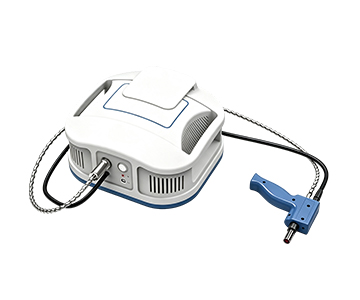
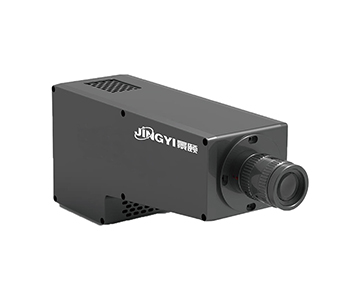
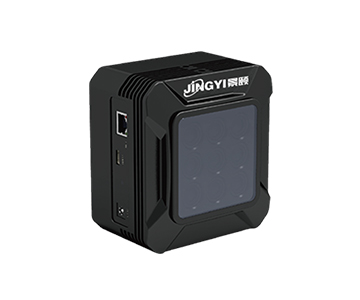
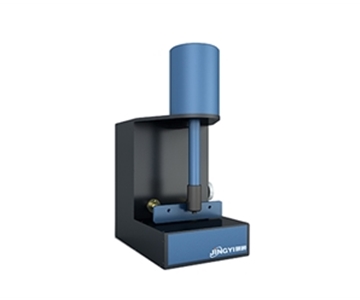
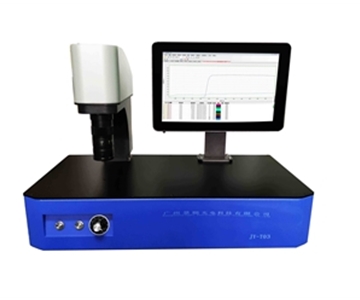
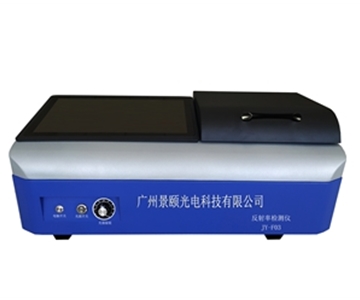
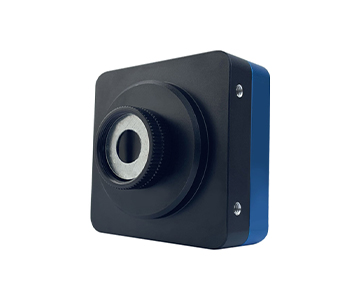
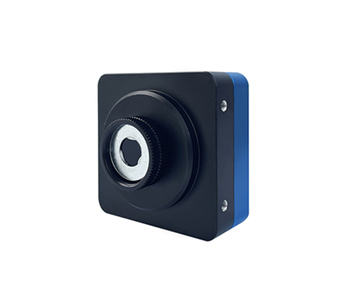
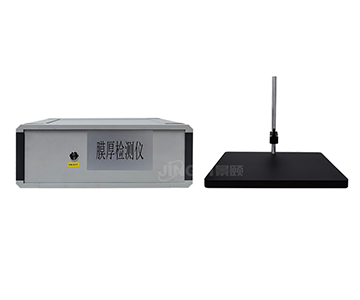
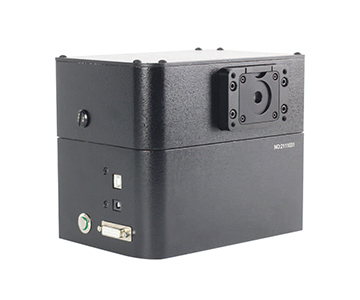
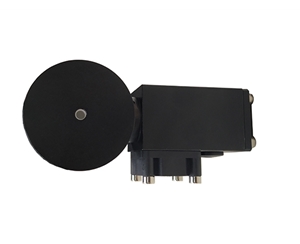
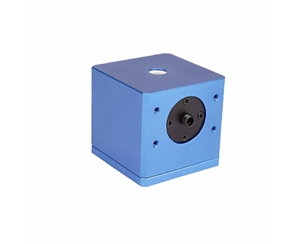
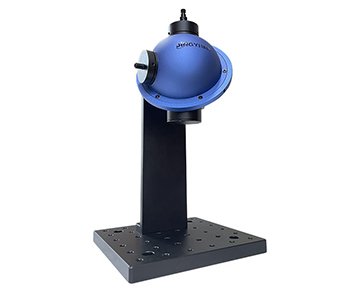
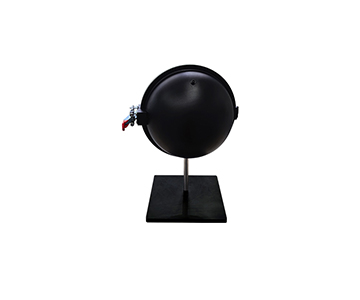
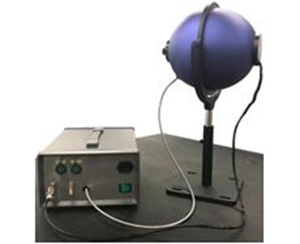
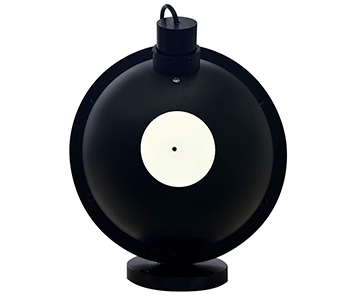
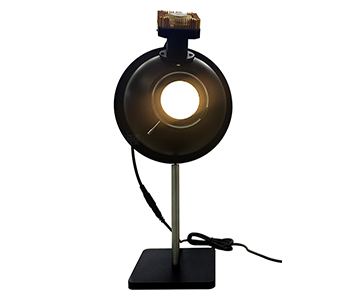
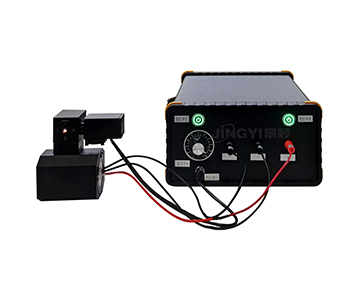
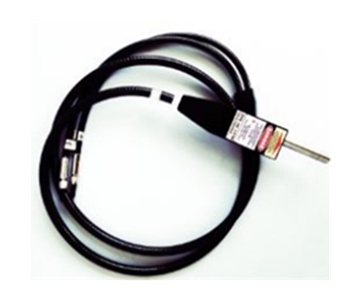
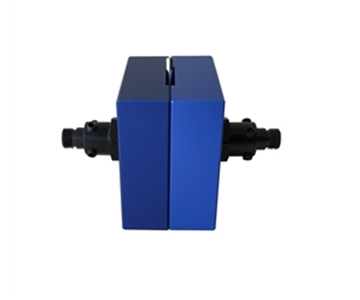
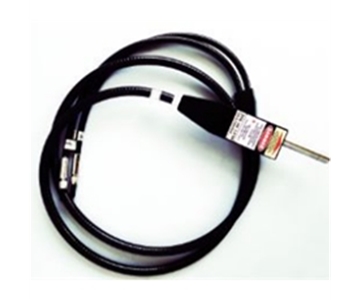
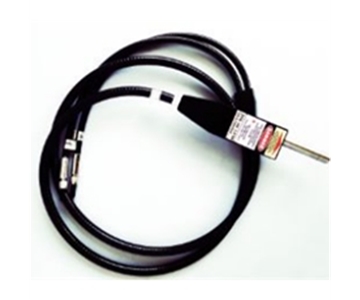
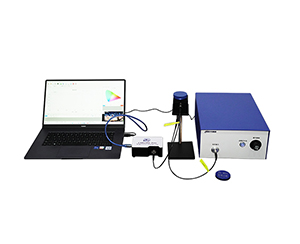
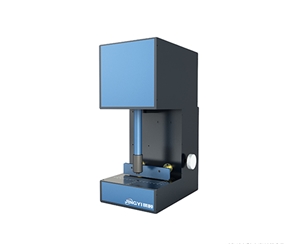
A mainstream UV-optimized system completes data acquisition and digitization inside the detector housing, storing calibration coefficients directly on the probe. This architecture minimizes external interference. For UV-visible band testing, it means the entire chain from light source to digital output remains controlled, eliminating noise introduced by extension cables. The device covers 200–1100 nm with segmented power ranges spanning 100 pW–1 mW and 1 mW–10 mW, accommodating everything from weak light characterization to high-power laser validation.
Multi-Band Detectors and Attenuator Expansion
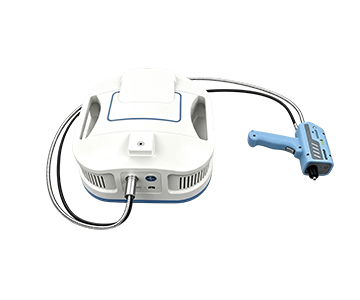
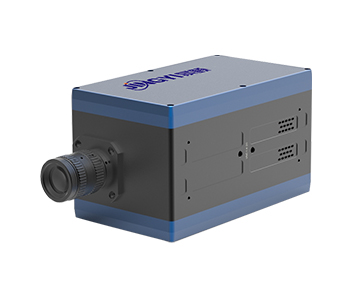
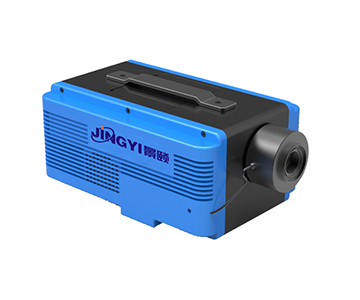
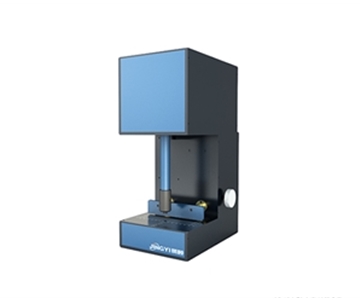
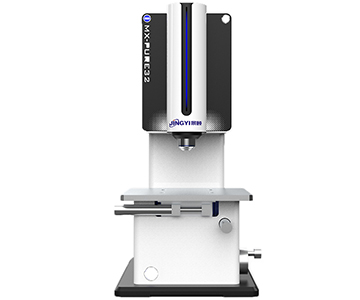
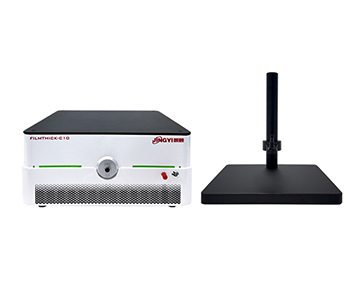
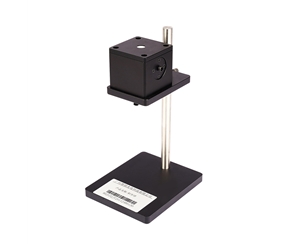
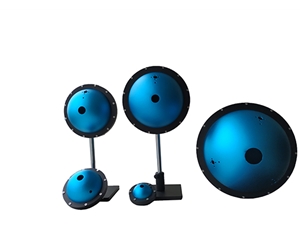
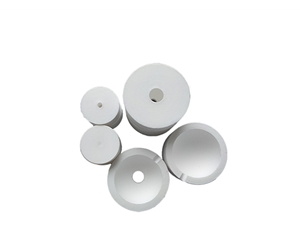
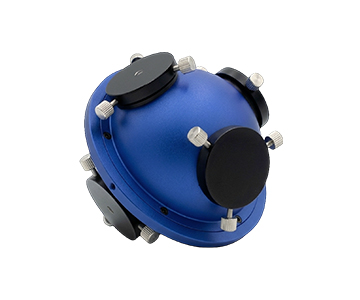
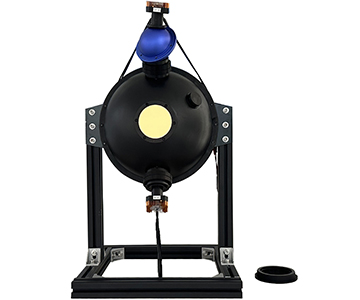
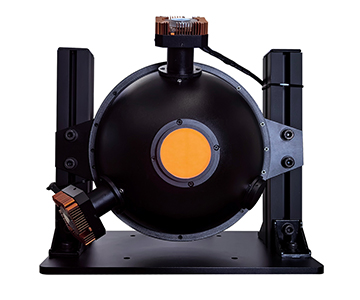
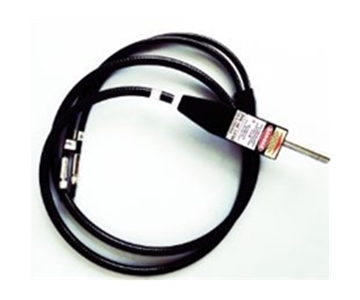
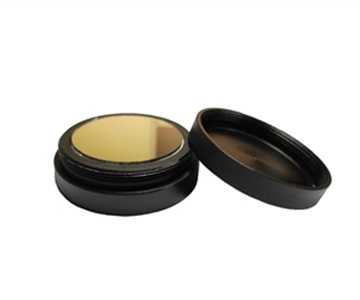
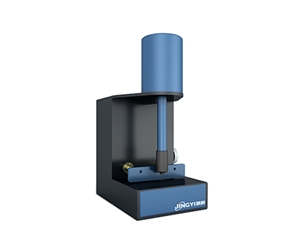
A visible-band system employs a silicon detector covering 380–1100 nm, delivering a noise equivalent power (NEP) of 4.5E-13 W/√Hz and a 2 µs response time. When facing intense laser scenarios, optional OD1/OD2/OD3 attenuator plates extend the upper measurement limit to 10 W without saturating the sensor.
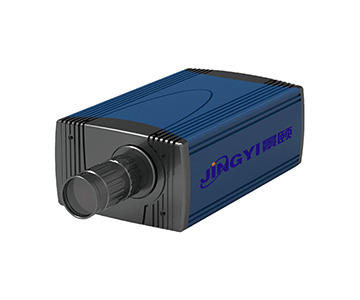
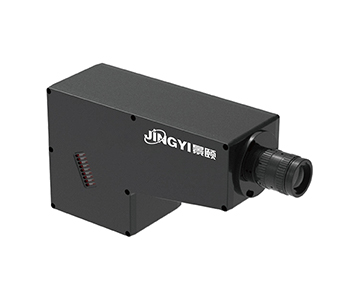
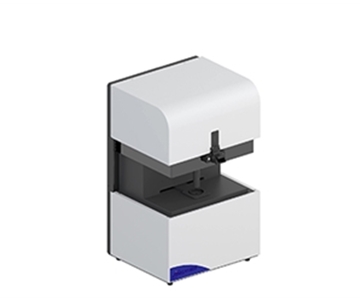
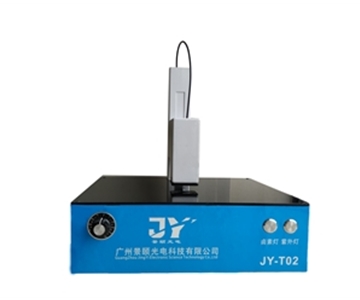
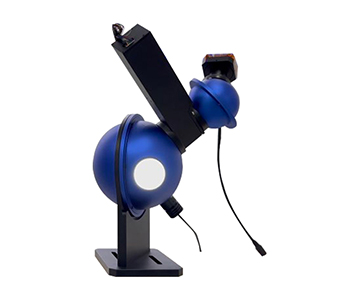
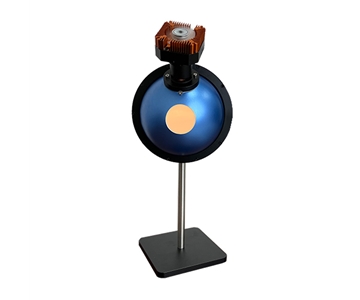
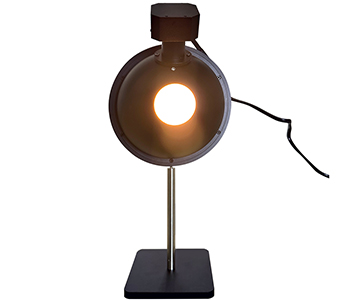
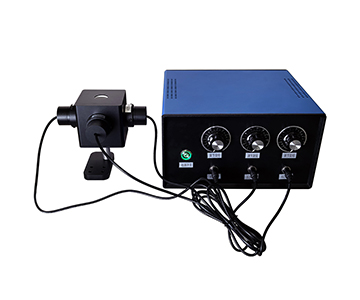
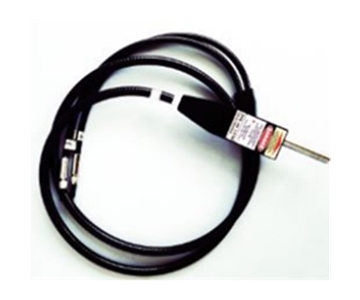
An infrared variant搭载 an InGaAs detector covering 800–1650 nm, pushing NEP down to 1.2E-13 W/√Hz with a 0.2 µs response time—performance that stands out in high-speed pulse capture applications. Effective detection areas of 1 cm² and 0.071 cm² adapt to different beam spot sizes.
Quantitative Deployment Results
Uncertainty and Cycle Time Improvements
Before deployment, the test uncertainty stood at ±8.5% with a cycle time of 4.5 hours per batch. After switching to the integrated system, uncertainty tightened to ±5% while cycle time dropped to 1.2 hours per batch. This represents a 41.2% reduction in measurement uncertainty and a 73.3% shortening of labor time, driven by onboard calibration storage and direct USB digital communication that eliminated manual recording and secondary data processing.
Throughput and Stability Gains
Over a continuous 72-hour burn-in test conducted at 23°C ±2°C, the system maintained linearity within ±0.5% and uniformity within ±2%, with zero data drift observed. Compared to the legacy setup, increased sampling frequency pushed daily inspected sample volume from 37 pieces to 128 pieces. False-trigger retest rates fell from 12.3% to 1.8%, directly improving overall equipment effectiveness on the production floor.
Cross-Industry Transfer and Standards Alignment
Metrology Lab and Automated Test Systems
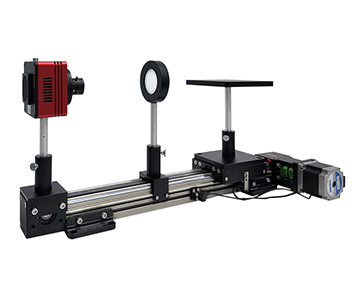
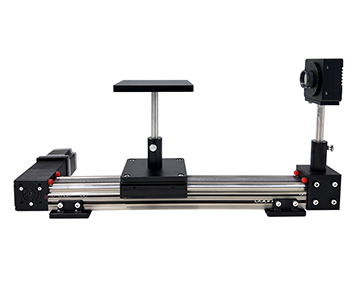
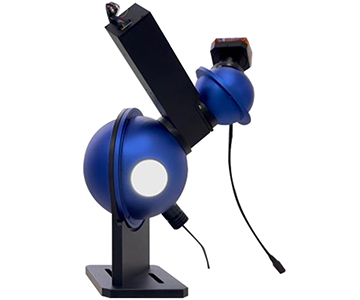
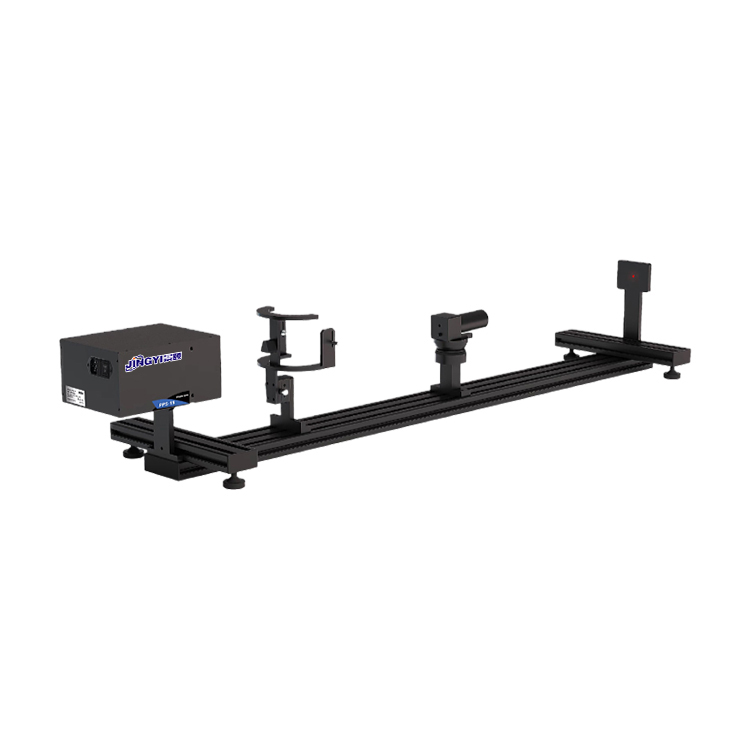
The design principle of probe-integrated calibration storage transfers effectively to precision measurement scenarios in national metrology laboratories, reducing dependence on external reference standards. Segmented ranging combined with detachable attenuators also fits automated data acquisition systems for multi-wavelength laser testing, enabling single-instrument coverage across bands.
Automotive LiDAR Testing Compliance
Emerging requirements in automotive LiDAR validation—such as those referenced in ISO 13229 and SEMI optical test guidelines—demand tight timing on pulse laser measurements. The infrared photoelectric power meter’s 0.2 µs response time in the 800–1650 nm band satisfies these时效性 requirements. While original equipment designs referenced T/CITS 231-2025 for power limits, the hardware parameters provide a solid foundation for compliance testing under international frameworks.
Honest Assessment of Applicability Boundaries
Power Ceiling and Environmental Constraints
The segmented power measurement range means that continuous high-power lasers exceeding 10 W require additional external attenuators, which can introduce secondary measurement error if not properly characterized. Operating temperature is restricted to 5°C–50°C with relative humidity below 70% RH. In hot, humid industrial environments, auxiliary climate control adds deployment cost. Furthermore, the series lacks direct data acquisition support for legacy benches without USB interfaces, requiring DB15 adapter instrumentation that limits flexibility.
Operator Skill and Maintenance Requirements
Frequently Asked Questions
Q: What is the main difference between UV-enhanced silicon detectors and standard silicon detectors in laser power measurement?
A: UV-enhanced silicon extends wavelength coverage down to 200–1100 nm, compared to 380–1100 nm for standard silicon. This added UV response enables monitoring deep-UV laser processing applications, such as photoresist curing in semiconductor lithography, where conventional sensors would be blind.
Q: How does the NEP parameter affect data acquisition on an optical bench?
A: Noise Equivalent Power (NEP) defines the minimum detectable optical signal. A lower NEP—such as 3.9E-14 W/√Hz—means the detector can resolve smaller power levels with high signal-to-noise ratio, making it suitable for calibrating low-power lasers where every picowatt counts.
Q: How do I select the right fiber adapter for different interfaces?
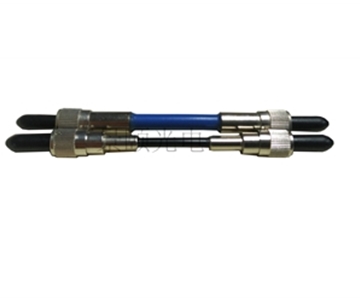
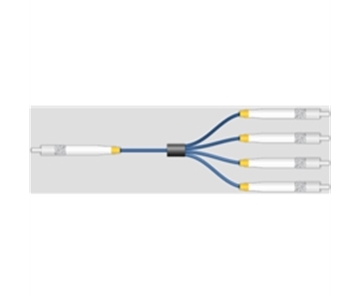
A: The instrument family supports multiple fiber adapter interfaces. Match the adapter to your existing fiber type to maximize coupling efficiency and minimize insertion loss from interface mismatch, which otherwise skews power readings.
Q: How should buyers evaluate cost-performance of laser power calibration equipment?
A: Evaluate across wavelength coverage, NEP, response time, and measurement uncertainty. For multi-band testing, a bundled set covering 200–1650 nm avoids duplicate purchases and typically offers the best total cost of ownership.
Q: How can I independently verify the long-term stability of a photoelectric power meter?
A: Periodically perform calibration comparisons using a traceable standard light source. Confirm that measurement uncertainty remains within ±5% and monitor linearity maintenance within ±0.5% to ensure the metrological traceability chain stays intact. Never rely on devices past their calibration expiration for critical testing.
Editorial Notes
Research Basis
: Product documentation from Jingyi Optoelectronics, public technical specifications, and in-house validation reports (n=128 samples over 72 hours of continuous testing).
Reviewed by
: Cai Xiaodong, Senior Application Engineer at Jingyi Optoelectronics, with 10 years of experience in industrial optical inspection and spectroscopy.
Sponsorship Disclosure
: Jingyi Optoelectronics manufactures photoelectric power meters. Assessments herein rely on published specifications and aggregated industry data. No third-party compensation was involved.
Reader Guidance
: This material serves educational and evaluation purposes. Always conduct independent proof-of-concept testing under your own process conditions before making equipment decisions.
Publication Date
: November 2026
For detailed specifications and application notes on photoelectric power meters, search "Jingyi Optoelectronics photoelectric power meter" or visit our technical library.