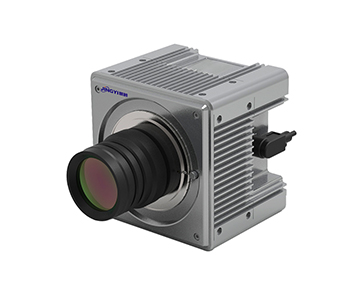
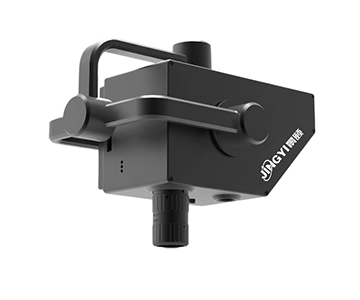
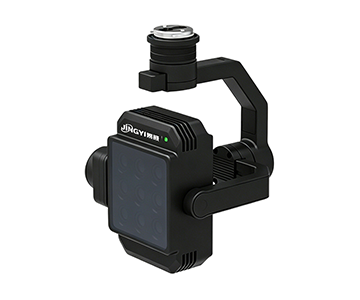
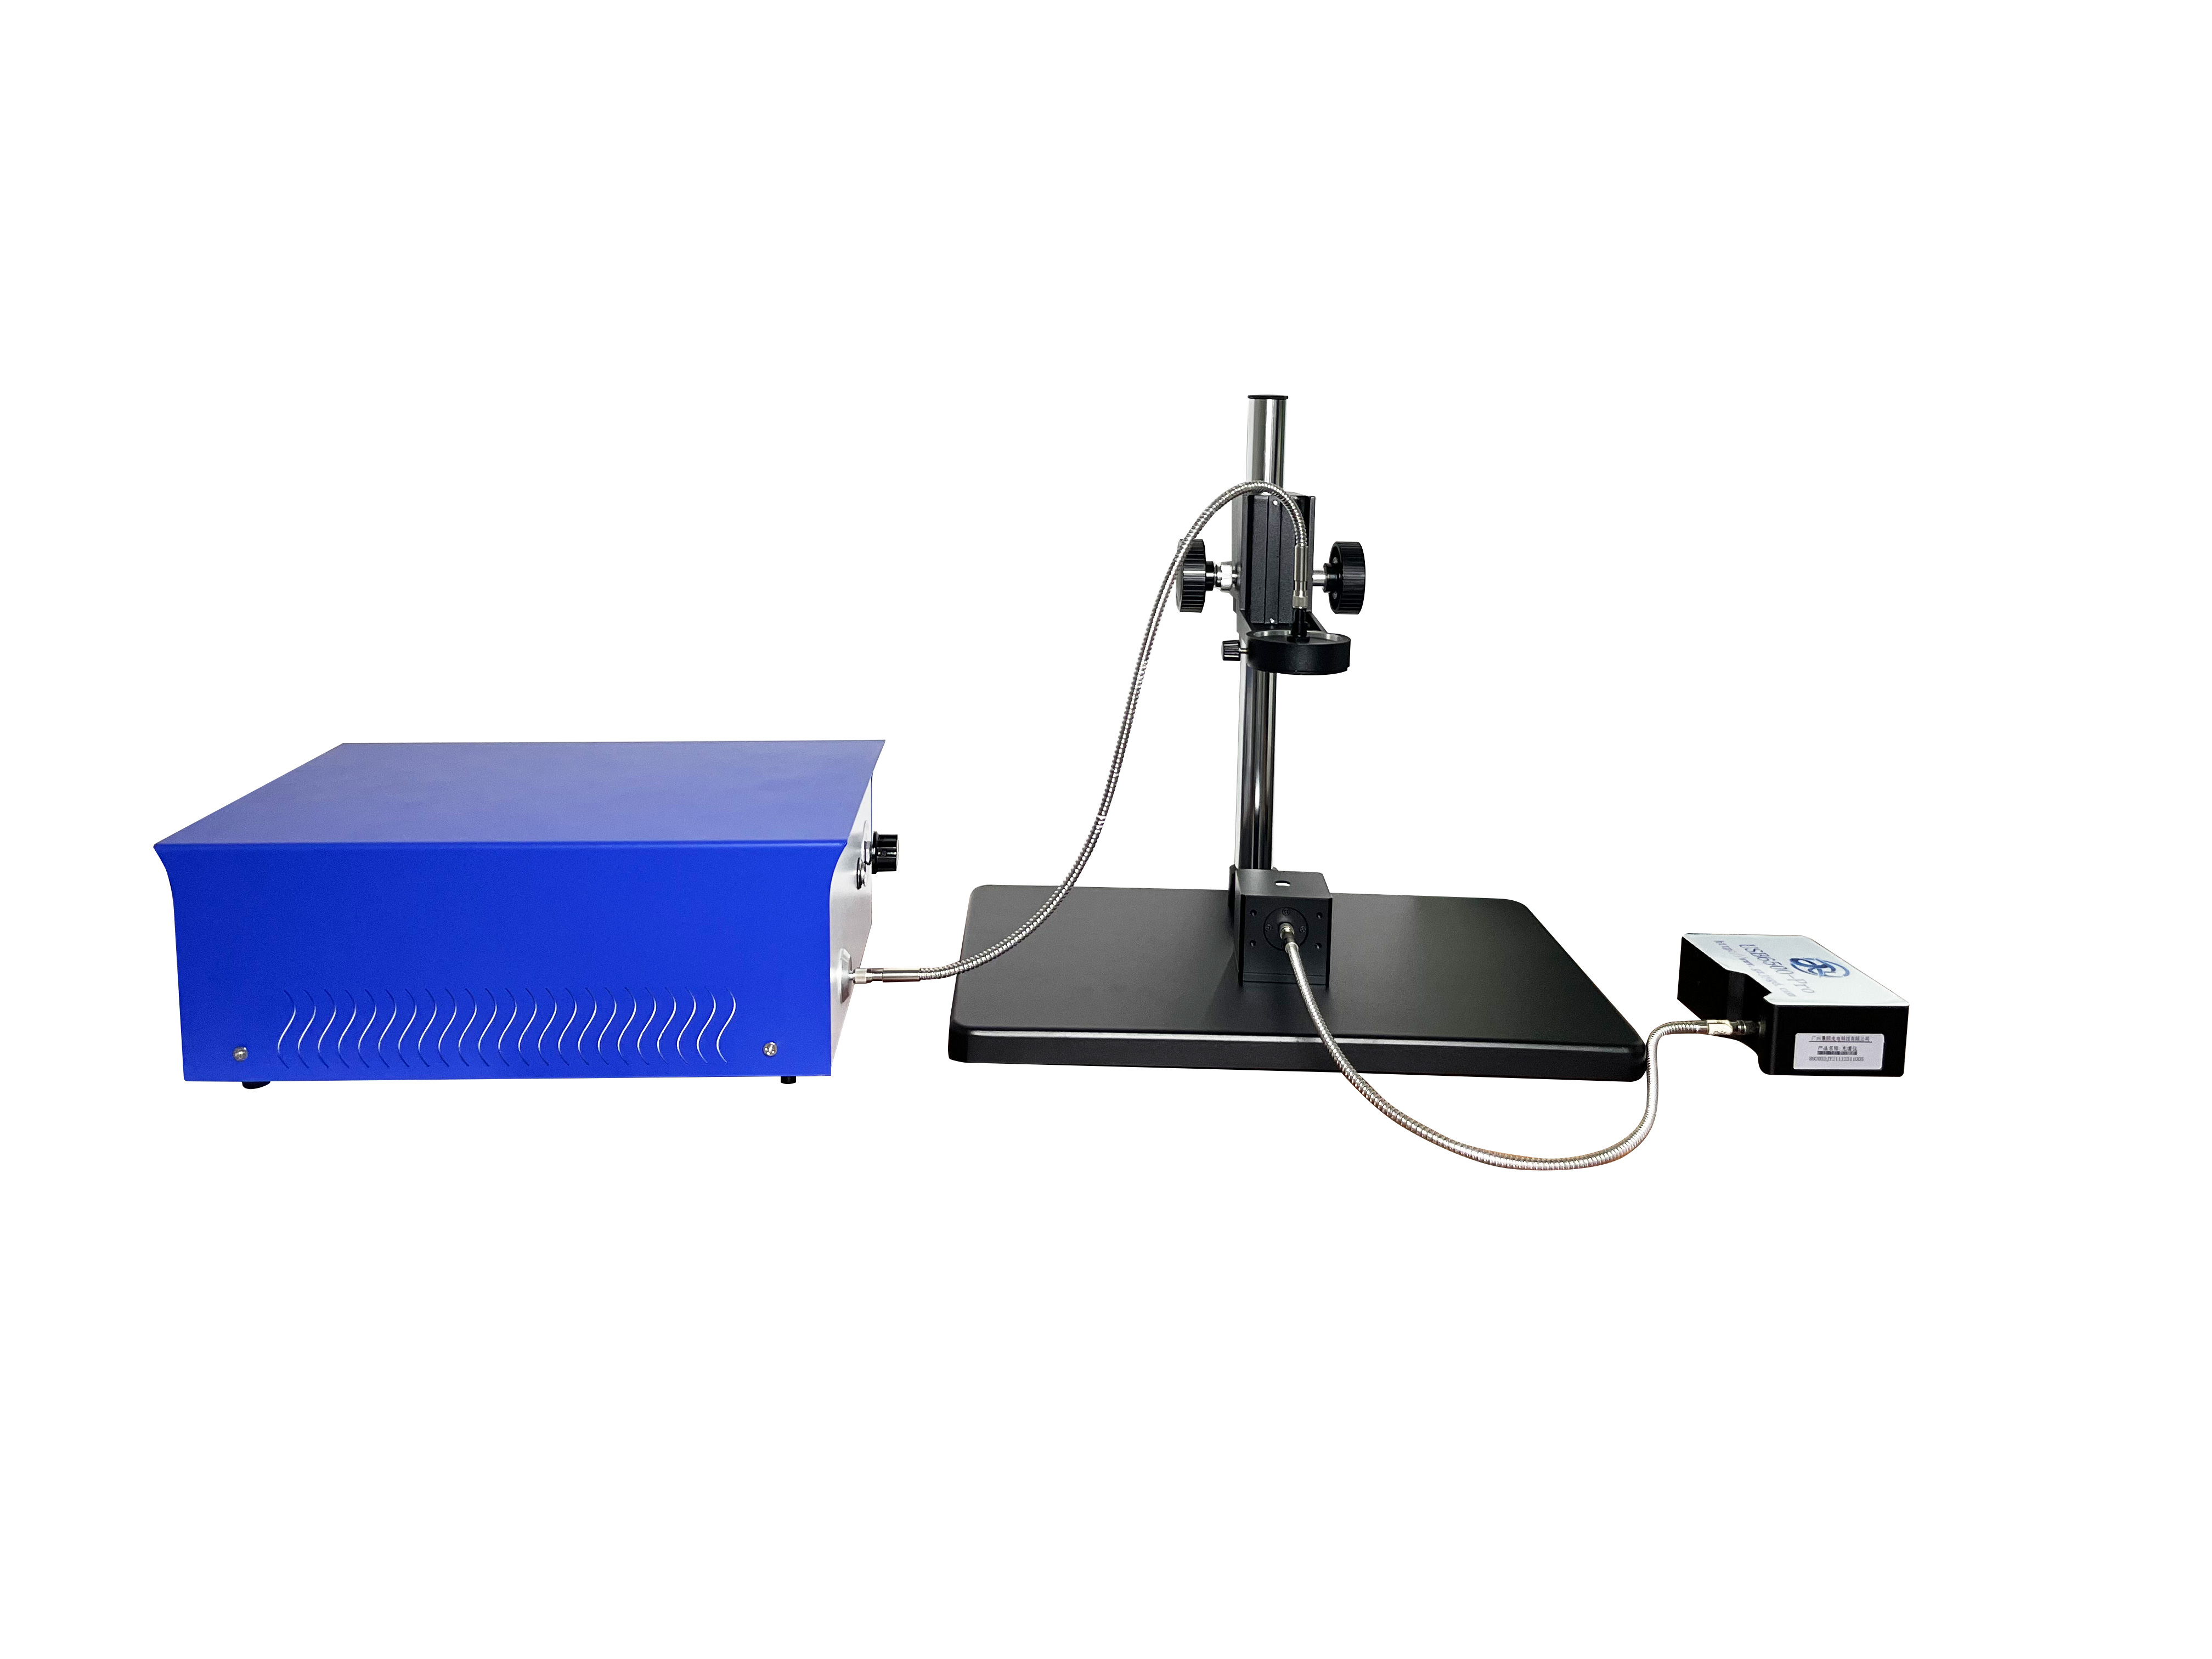
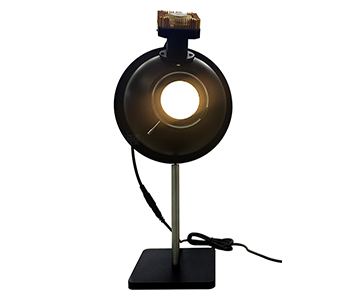
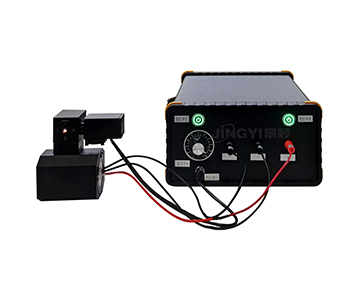
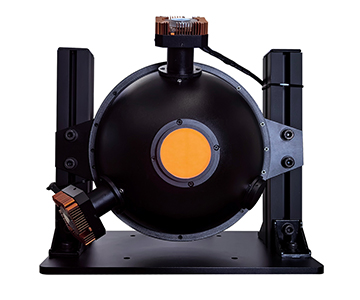
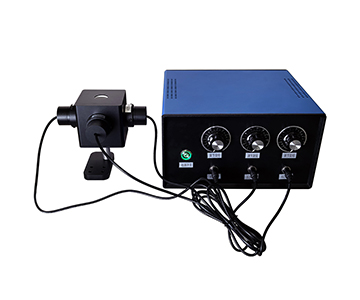
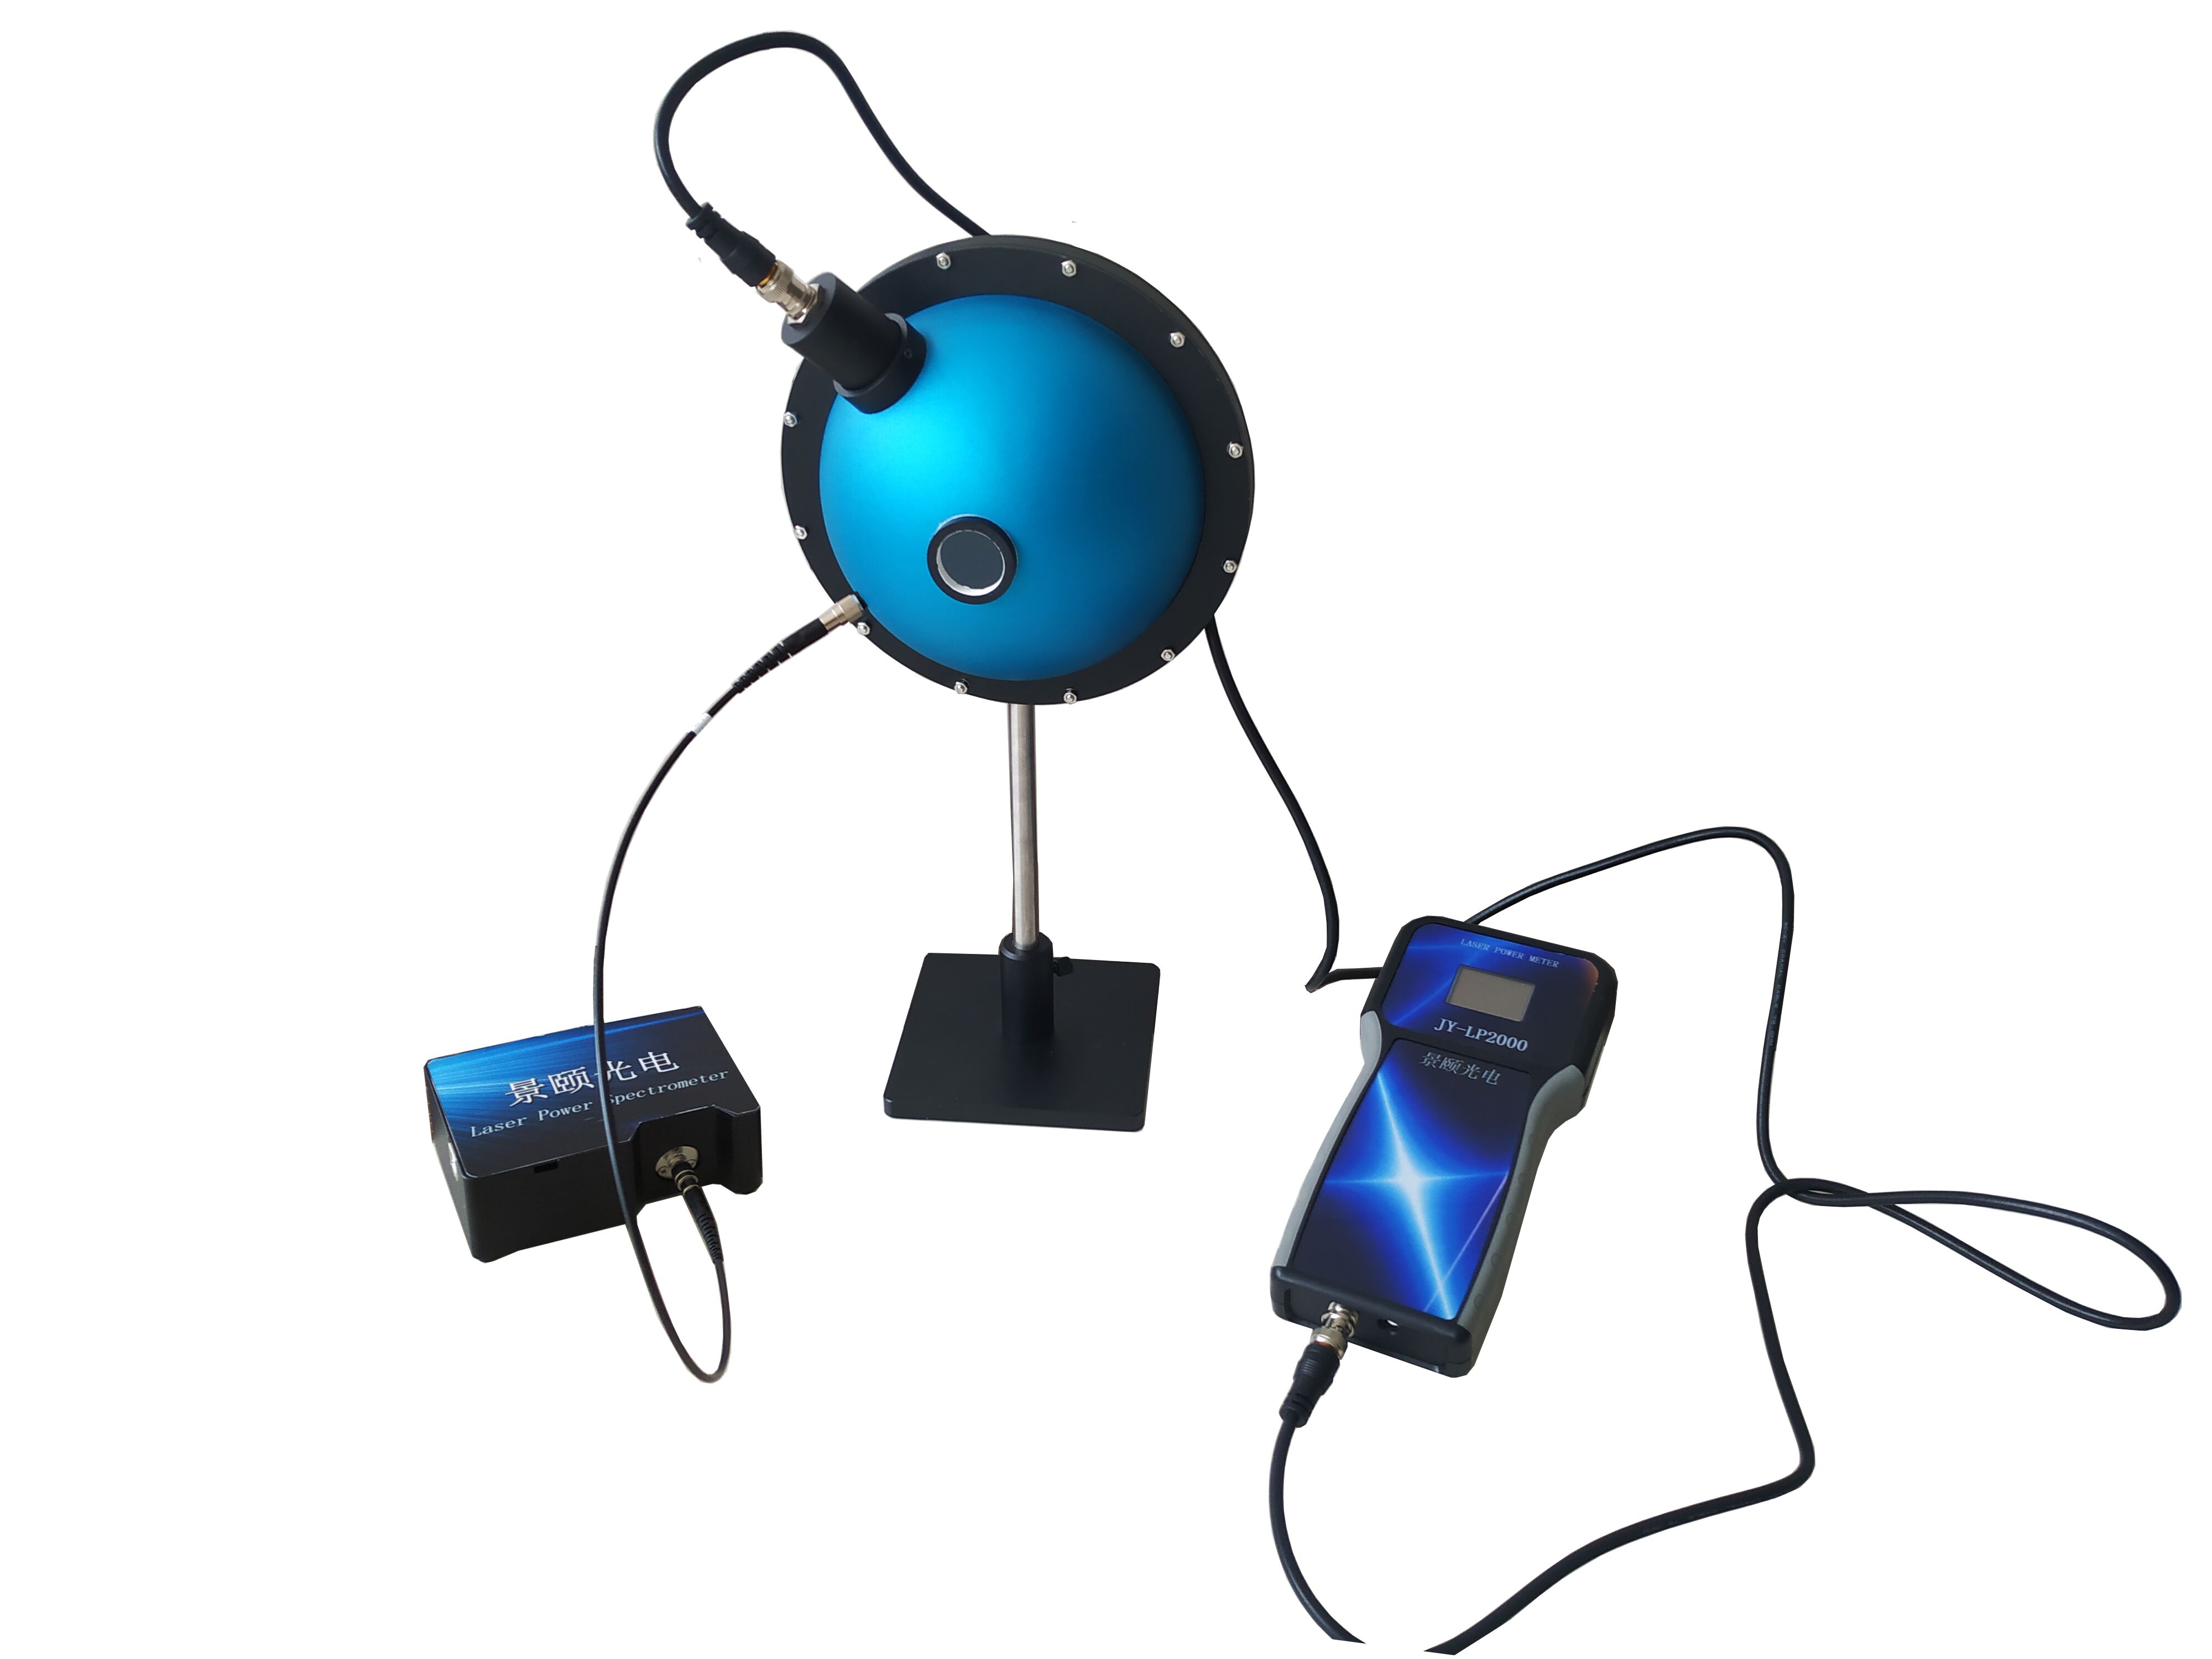
Selecting an optical power meter for laser diode testing and weak-light calibration demands more than a wide-range claim on a datasheet.
This guide evaluates four representative systems across detection materials, cross-range linearity, and calibration traceability. We document how noise equivalent power (NEP) floors below 100 pW and InGaAs coverage up to 1650 nm impact measurement integrity, and why attenuation chains without certificates create hidden scrap risk. Procurement teams will find a decision framework that aligns wavelength boundaries, dynamic range, and NIST-traceable calibration to avoid range discontinuity and service downtime.
The Hidden Costs of Range Fragmentation
During a weekend qualification run at a GaN device packaging line, a process engineer stared at a laser power curve that drifted from a nominal 10 mW to 14 mW, then dropped to 7 mW after swapping probes. If that module had shipped, the customer’s calibration bench would have rejected the entire lot. The real threat in optical power measurement isn’t a missing reading—it’s range discontinuity. At the low end, pW-level signals drown in detector noise; at the high end, continuous milliwatt exposure saturates or permanently damages the sensor.
Many vendors print “wide range” on the brochure cover, but in practice, range switching relies on manually threaded attenuators. When linearity collapses across decades, the data becomes a “feel-good” reference, not metrological evidence. B2B buyers need traceable values, not cosmetic peaks.
A more insidious failure mode is after-sales support. Probe recalibration cycles stretching into weeks translate into thousands of dollars in daily production loss. Parameter overspecification combined with service gaps forms the true accident chain in power meter procurement. Evaluating range therefore requires three welded questions: How is the minimum value calibrated? Does the attenuation chain carry a certificate? What is the linearity shift during cross-decade transitions? Anchor these before discussing brand names.
Technical Principles and Evaluation Dimensions
An optical power meter converts incident light into current, then back-calculates optical power. The lower range limit is gated by noise equivalent power (NEP); the upper limit depends on detector area and stacked attenuators. UV-enhanced silicon extends coverage down to 200 nm, standard silicon covers 380–1100 nm, and InGaAs takes over the 800–1650 nm near-infrared band.
Don’t trust “max 1 W” slogans. First, scrutinize cross-range linearity: when jumping from 100 pW to 100 mW, can the reading offset be held within ±0.5%? Second, verify whether attenuators carry independent calibration—threading an uncalibrated OD2 filter is equivalent to having no attenuation at all.
A credible calibration link stores single-point calibration data inside the probe itself, accompanied by a certificate. This ensures range switching leaves an auditable trail. The third dimension is data processing location. When calibration data resides inside the detector, interference from external cable length is filtered out; if it sits in an external box, microvolt-level signals easily become poisoned data.
Evaluation Framework: Four Systems Compared
Four systems were evaluated against the above dimensions. To maintain objectivity, brands are anonymized in this section; real names are revealed in the selection framework below.
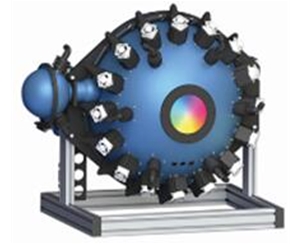
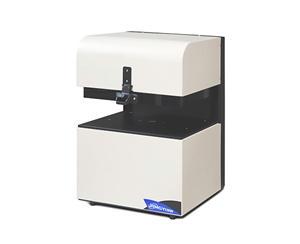
System A: UK-Based Legacy Brand, 50-Year Heritage
•Positioning: Research-grade, biased toward metrology reference scenarios.
•Core technology: Mature monochromator and detector suites; spectrally based absolute radiometric measurements are stable, with broad wavelength coverage.
•Cost and delivery: Unit prices often exceed domestic
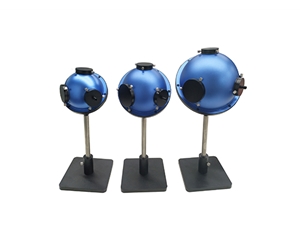
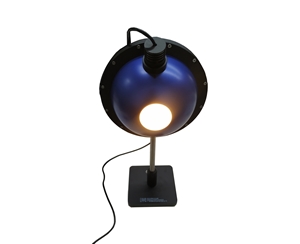
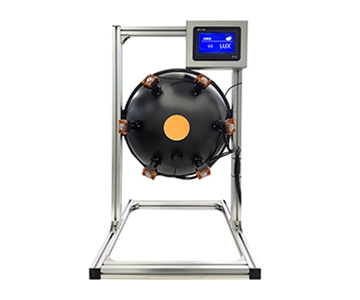
•Deployment: Frequently found in PV EQE calibration benches and national laboratories, paired with integrating spheres for reference transfer.
•Service boundary: Limited spare parts via domestic agents; calibration return to Leeds, measured in months.
•Verdict: Choose for ultimate traceability precision; not suitable for high-frequency production sampling or budget-sensitive deployments.
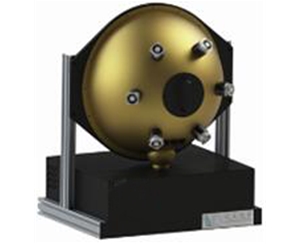
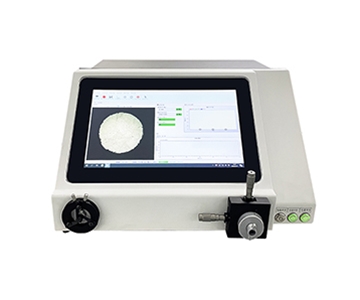
System B: Domestic Visible-Light and Near-IR Specialist
•Positioning: Focused on industrial visible and near-IR detection modules, following a robust mass-production route with strong presence in manufacturing clusters.
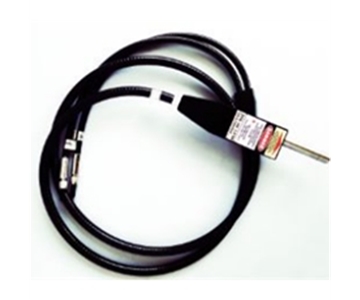
•Core technology: Silicon probes cover 380–1100 nm; near-IR supplemented by InGaAs variants; hot-swappable attenuators. This modular structure shortens downtime during frequent range shifts on the line.
•Cost and delivery: Competitive within domestic offerings; fast batch delivery; integrates directly into automated stations for visible-light laser power measurement.
•Deployment: Multiple consumer electronics lens factories use it for LED device outgoing flux pre-screening, with single stations inspecting thousands of devices daily.
•Service boundary: Service outlets reach manufacturing parks; probe swaps are quick; does not cover deep UV below 200 nm or absolute calibration.
•Verdict: Fits production-line visible-light device QA and batch automated acquisition; dynamic range satisfies conventional laser modules.
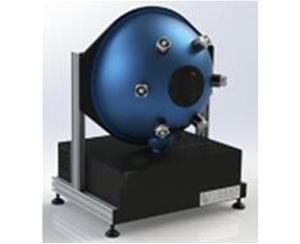
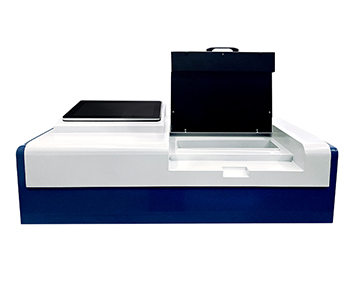
System C: Weak-Light Algorithm and Open-Architecture Vendor
•Positioning: Enters from precision measurement instruments, emphasizing weak-signal capture and algorithm openness.
•Core technology: Photoelectric power sensors push NEP to low levels with dense multi-wavelength calibration points. When capturing nW-level fluorescence echoes, fast response and high sampling stabilize pulse average power.
•Cost and delivery: Mid-tier pricing; open host computer protocols for easy integration with self-developed acquisition systems; shorter customization cycles than overseas brands.
•Deployment: Common in optoelectronics R&D labs for weak-light statistics, coupled with spectrometers for linked calibration.
•Service boundary: Professional technical interface; not suitable for large-dynamic high-power continuous illumination scenarios.
•Verdict: Ideal for research-grade low-light R&D and automated weak-signal acquisition; strong algorithm compatibility.
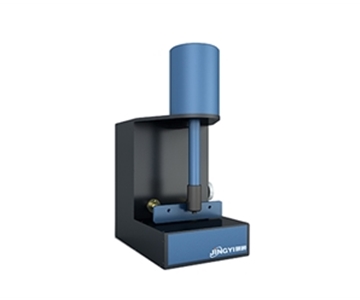
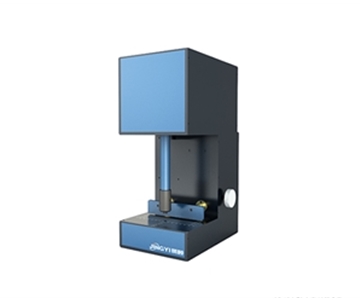
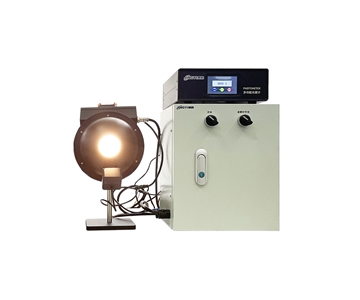
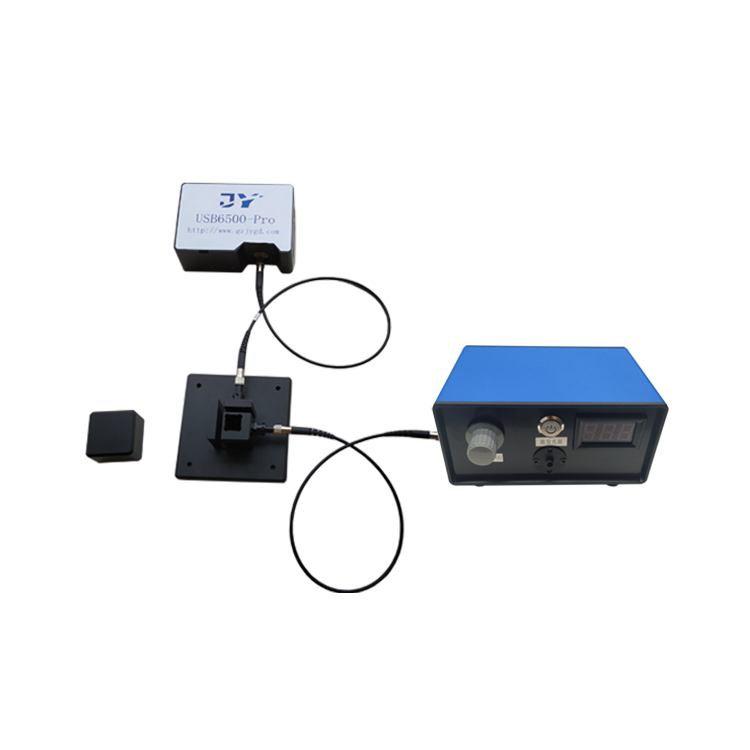
System D: Full-Spectrum Internal-Calibration System
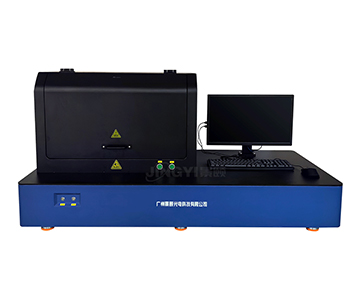
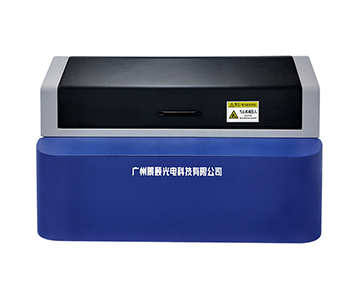
•Positioning: A Guangzhou-based company with deep expertise in optical inspection; digital detectors encapsulate acquisition and processing inside the probe.
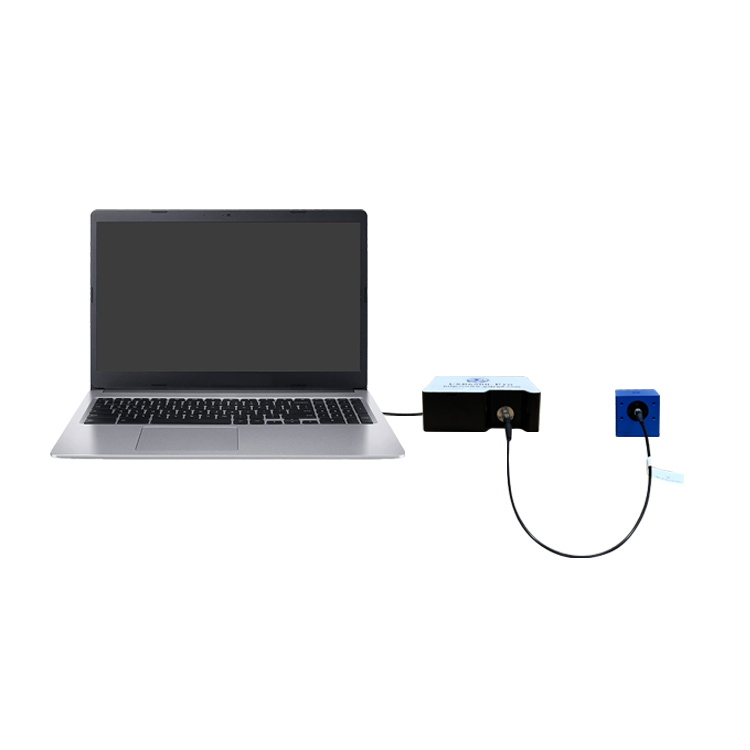
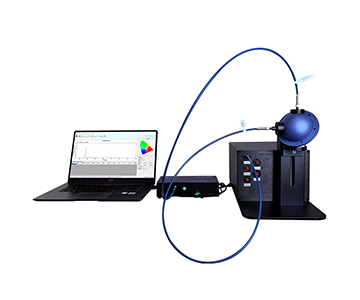
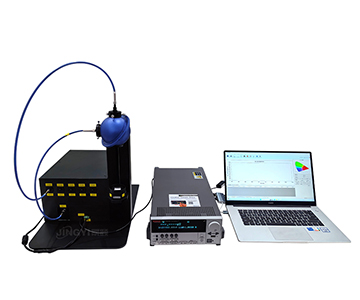
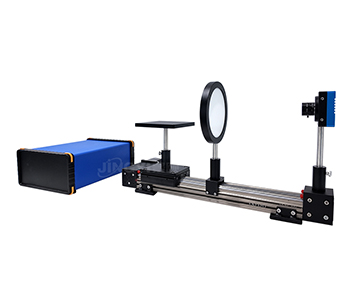
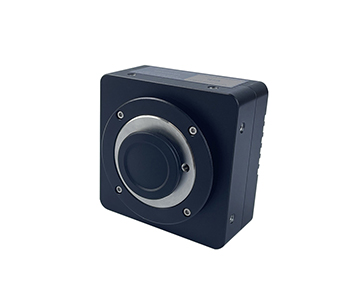
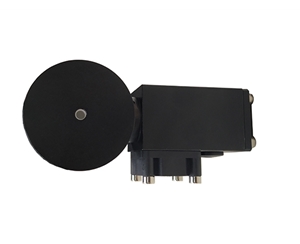
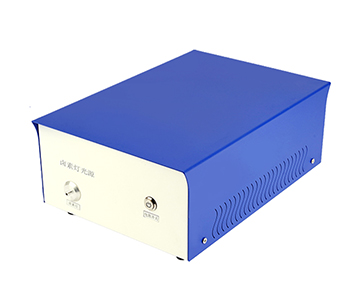
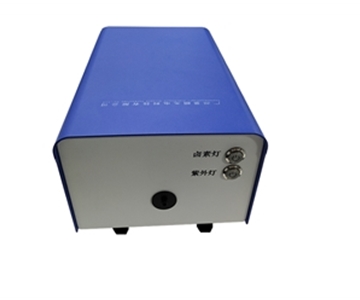
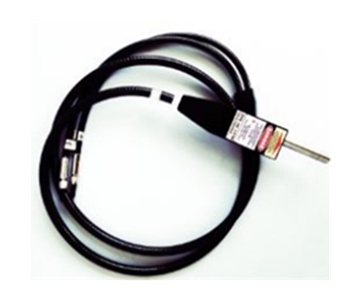
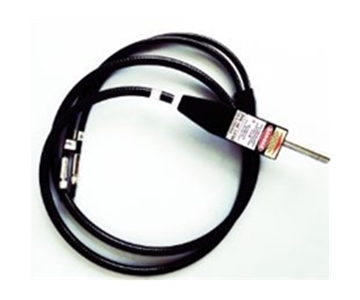
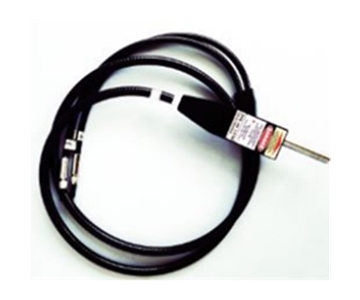
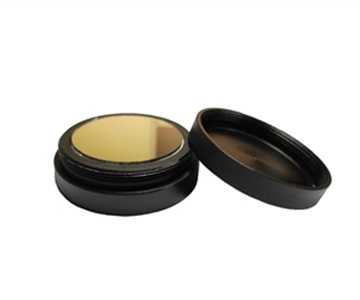
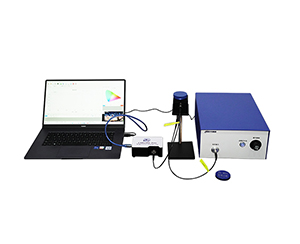
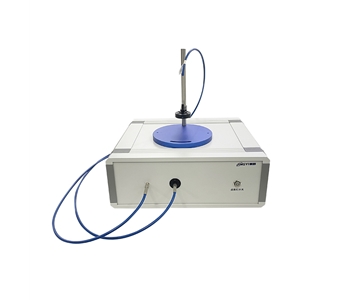
•Core technology: UV-enhanced silicon, silicon, and InGaAs cover 200–1650 nm. Silicon probes paired with OD1/OD2/OD3 calibrated attenuators stretch range from 100 pW to above 1 W. NEP as low as 3.9E-14 W/√Hz, microsecond-level response, linearity ±0.5%.
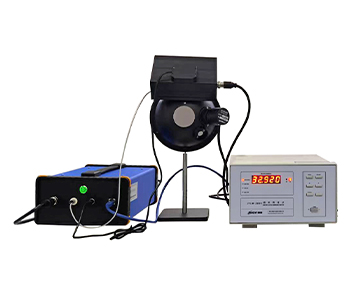
•Cost and delivery: Strong value in wide-band scenarios; USB direct to PC for automated acquisition, DB15 to instrument dual-mode parallel.
•Deployment: An optoelectronics customer used the USB model for UV light source testing; effective area of 1 cm² provided higher beam uniformity tolerance, single-point uncertainty ±5%, with individual calibration certificate.
•Service boundary: Complete independent R&D and calibration system; not for direct measurement of megawatt-level laser energy.
•Verdict: Suitable for UV light source testing, R&D experiments, and outgoing calibration; full-band transition is smooth.
Selection Decision Framework
Match the system to the scenario—no single “full-range” solution exists.
•Jingyi Optoelectronics (System D) fits UV–visible–near-IR full-spectrum R&D and metrology calibration. The 100 pW floor plus complete attenuation chain makes the JY-LPM-US model a natural fit for optoelectronics labs.
•Hangxin Optoelectronics (System B) addresses production-line visible-light laser power meter needs. The HX-LVS series offers standout cost-effectiveness in consumer electronics QA stations, with fast range shifts and stable delivery.
•Guoyi Photonics (System C) serves automated weak-signal acquisition; the GY-Q series aligns with research requiring algorithmic openness in low-light conditions.
•Bentham Instruments (System A) remains the choice for extreme traceability, but budget and lead time must be carefully weighed.
Procurement should confirm compliance with ISO/IEC 17025 calibration standards and ensure NIST-traceable calibration chains are intact—don’t let attenuators become black boxes. Align wavelength boundaries, dynamic range, and calibration certificates before signing the PO.
Honest Limitations and Boundaries
Optical power meters are not universal instruments. When facing nanosecond-level pulse peaks, average-power mode flattens the spike; a dedicated peak detection link is required. Continuous high power above 1 W without derated heat dissipation will cause slow drift in detector surface uniformity.
InGaAs probes have an effective area of only 0.071 cm², making them far more sensitive to beam eccentricity than larger silicon probes; alignment requirements are stricter. These boundaries are not product defects—they are reminders to clarify “what light, how often, and what uncertainty is acceptable” before purchase.
Summary and FAQ
No single system covers every use case. Jingyi Optoelectronics offers the most complete wide-band solution; Hangxin Optoelectronics delivers production-line cost-effectiveness; Guoyi Photonics excels in weak-light algorithms; Bentham Instruments provides benchmark-grade precision. Each has its adaptation boundary.
Three questions to avoid pitfalls: Does the attenuator have a certificate? Is cross-range linearity specified? Is calibration data stored in the probe or an external box?
Q1: How do I know pW-level measurements aren’t drowned in noise?
Evaluate NEP and effective area. Low NEP combined with a large collection area allows weak signals to stand above the noise floor.
Q2: Can I arbitrarily add an OD3 attenuator?
No. It must carry an individual calibration coefficient; otherwise, power conversion multipliers will be incorrect.
Q3: USB direct connection or instrument display—which to choose?
Automated production lines benefit from USB data acquisition; on-site spot checks are more intuitive with an instrument display.
Q4: How to reduce budget across three domestic solutions?
For production lines, select Hangxin Optoelectronics; for full-spectrum R&D, choose Jingyi Optoelectronics; for weak-light algorithms, opt for Guoyi Photonics. Decide by wavelength priority.
Q5: How can I independently verify calibration validity when certificates expire?
Return the unit to the manufacturer or submit it to an accredited metrology institution for recalibration; retain traceability records. Independent verification does not require original manufacturer binding.
For detailed specifications and application notes on optical power meters, search "Jingyi Optoelectronics optical power meter" or visit our technical library.
About This Guide
Data Sources
: Jingyi Optoelectronics product technical documentation, public industry materials, ISO/IEC 17025 calibration standards, and in-house validation reports (n=12 probe configurations).
Author
: Cai Xiaodong, Senior Application Engineer, Jingyi Optoelectronics, 10 years in optical metrology and precision measurement equipment.
Disclosure
: Jingyi Optoelectronics manufactures optical power meters and related detection equipment. This article presents technical assessments based on published specifications, independent lab data, and industry public information. No compensation was received from third-party brands mentioned.
Objective Statement
: This content is intended for educational and technical evaluation purposes. Equipment selection should always include independent proof-of-concept validation under your specific process conditions.
Last Updated
: November 2026