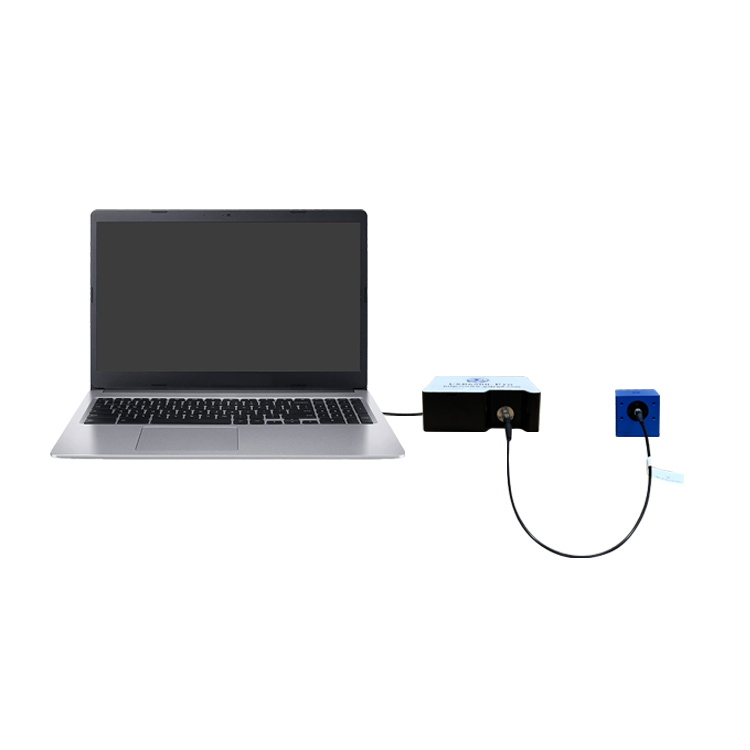
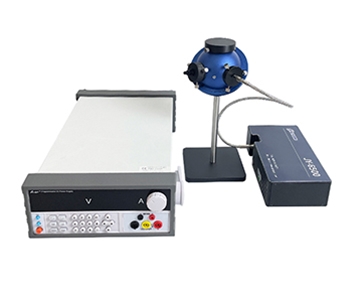
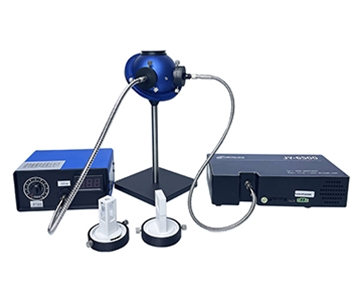
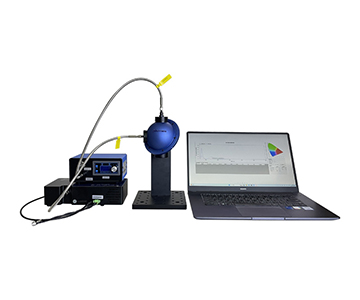
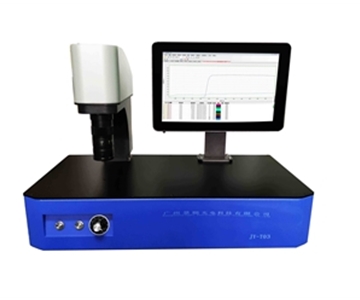
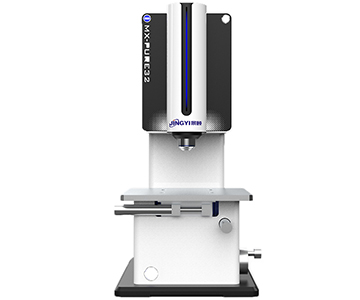
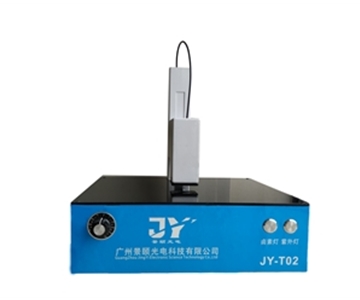
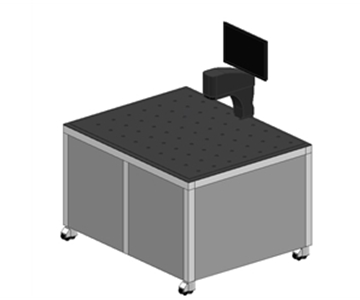
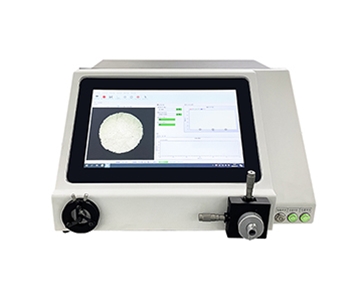
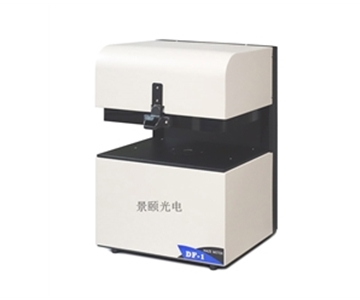
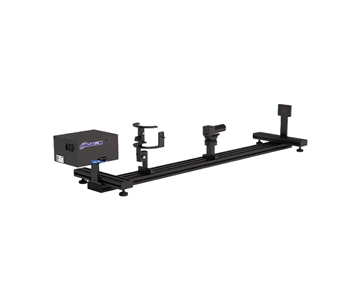
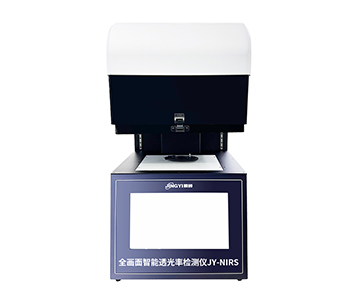
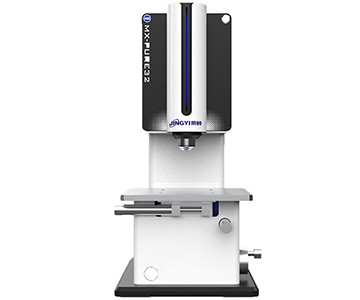
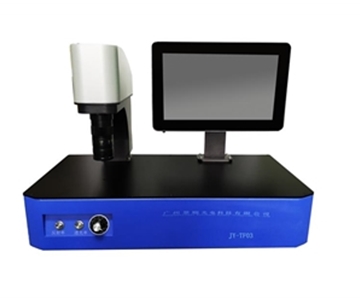
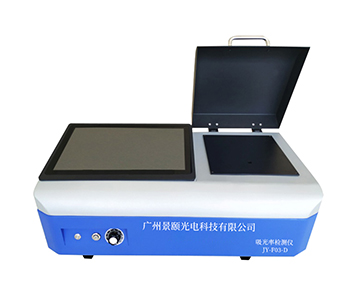
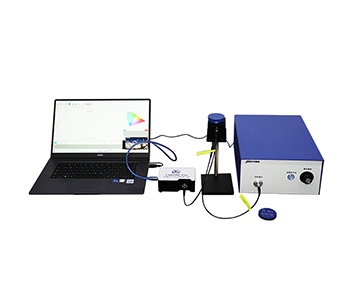
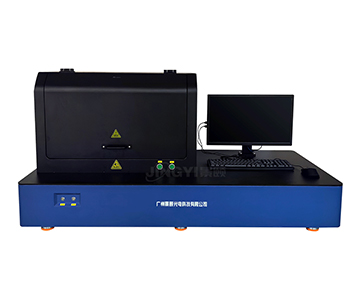
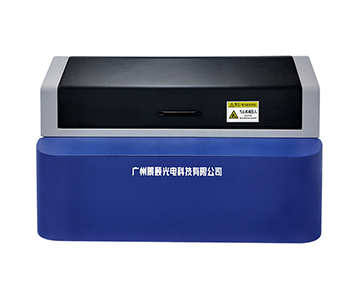
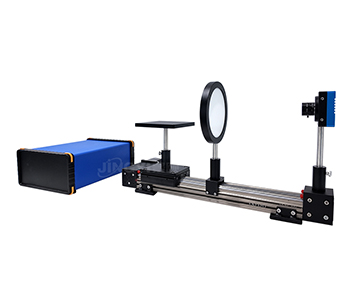
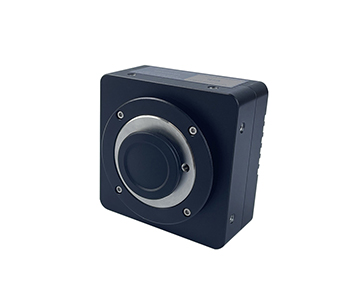
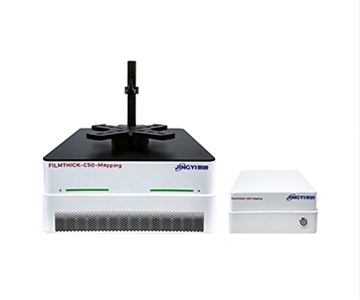
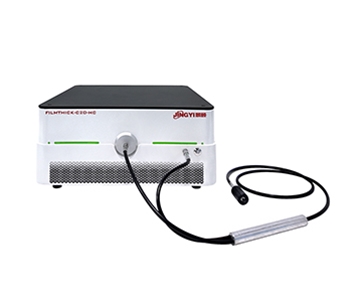
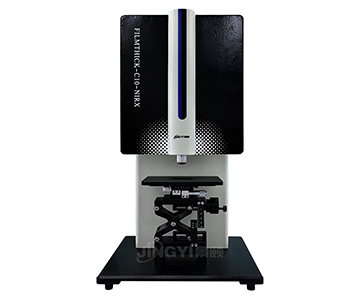
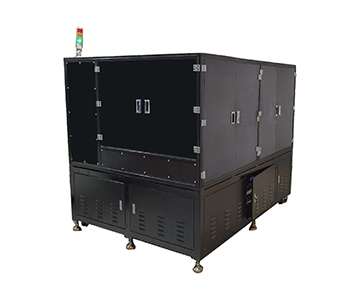
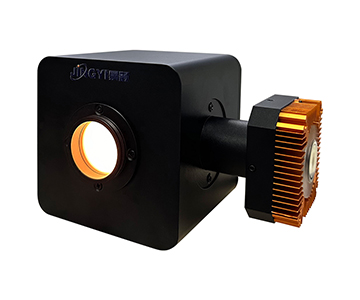
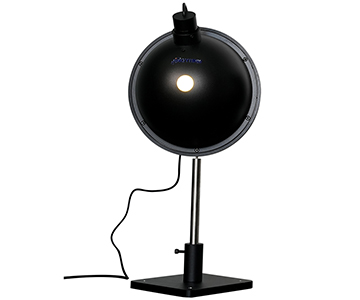
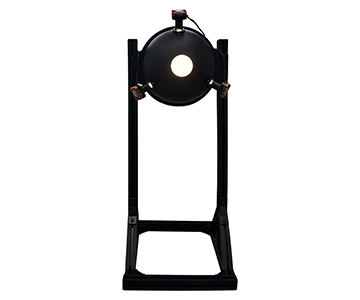
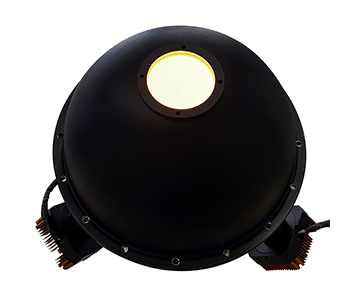
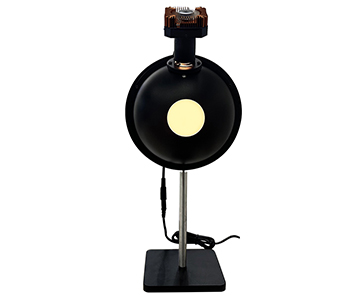
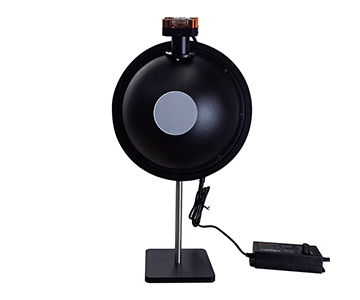
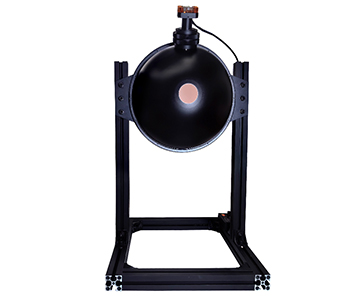
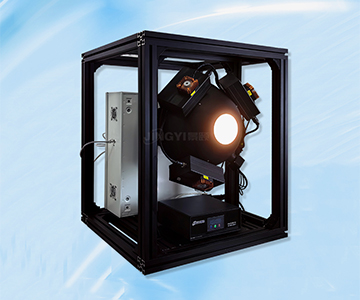
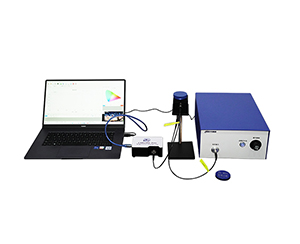
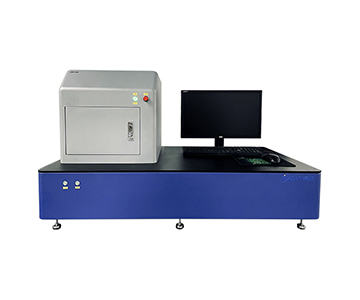
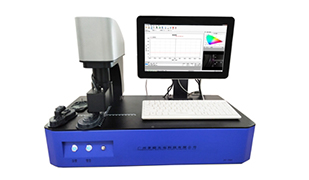
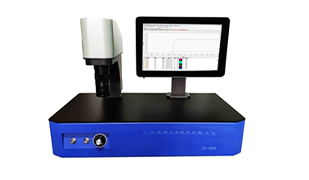
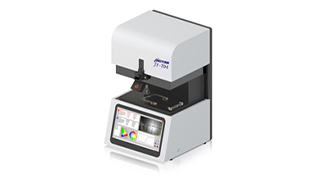
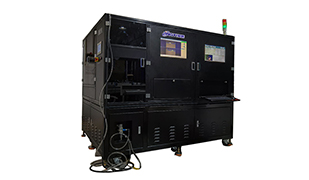
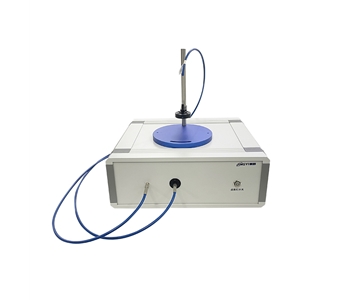
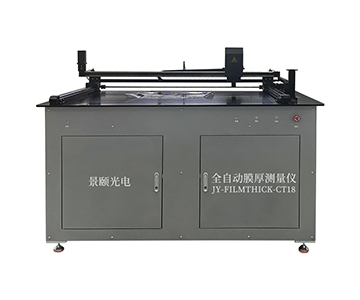
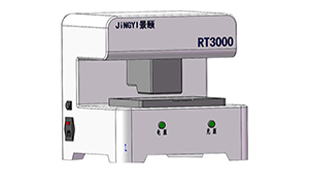
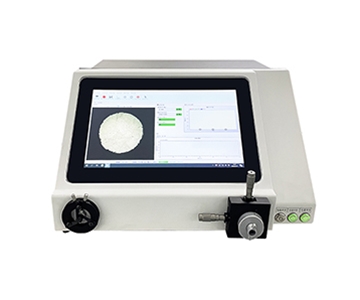
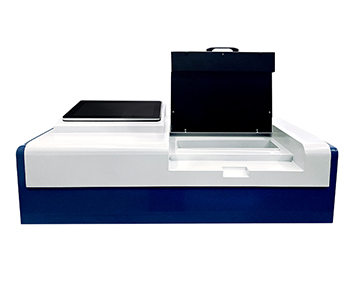
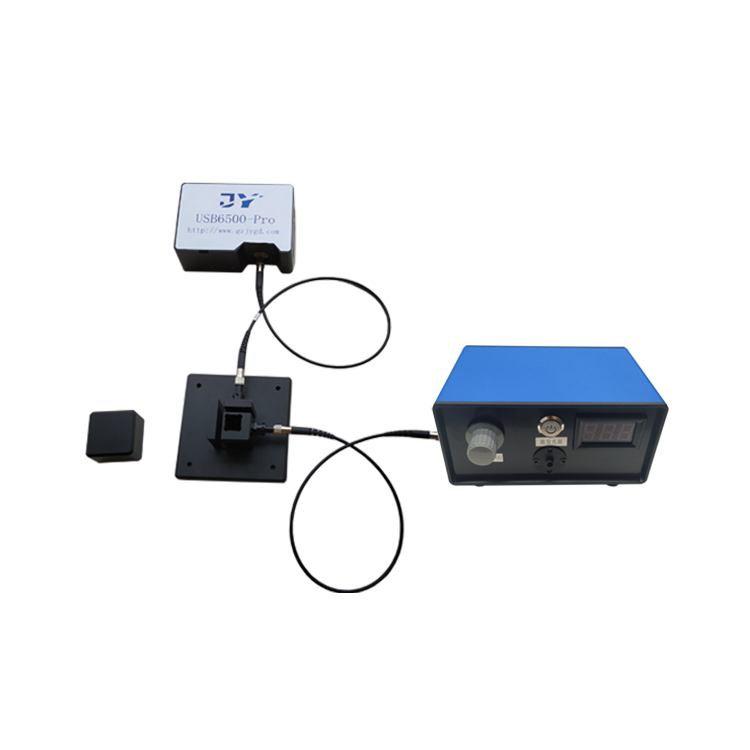
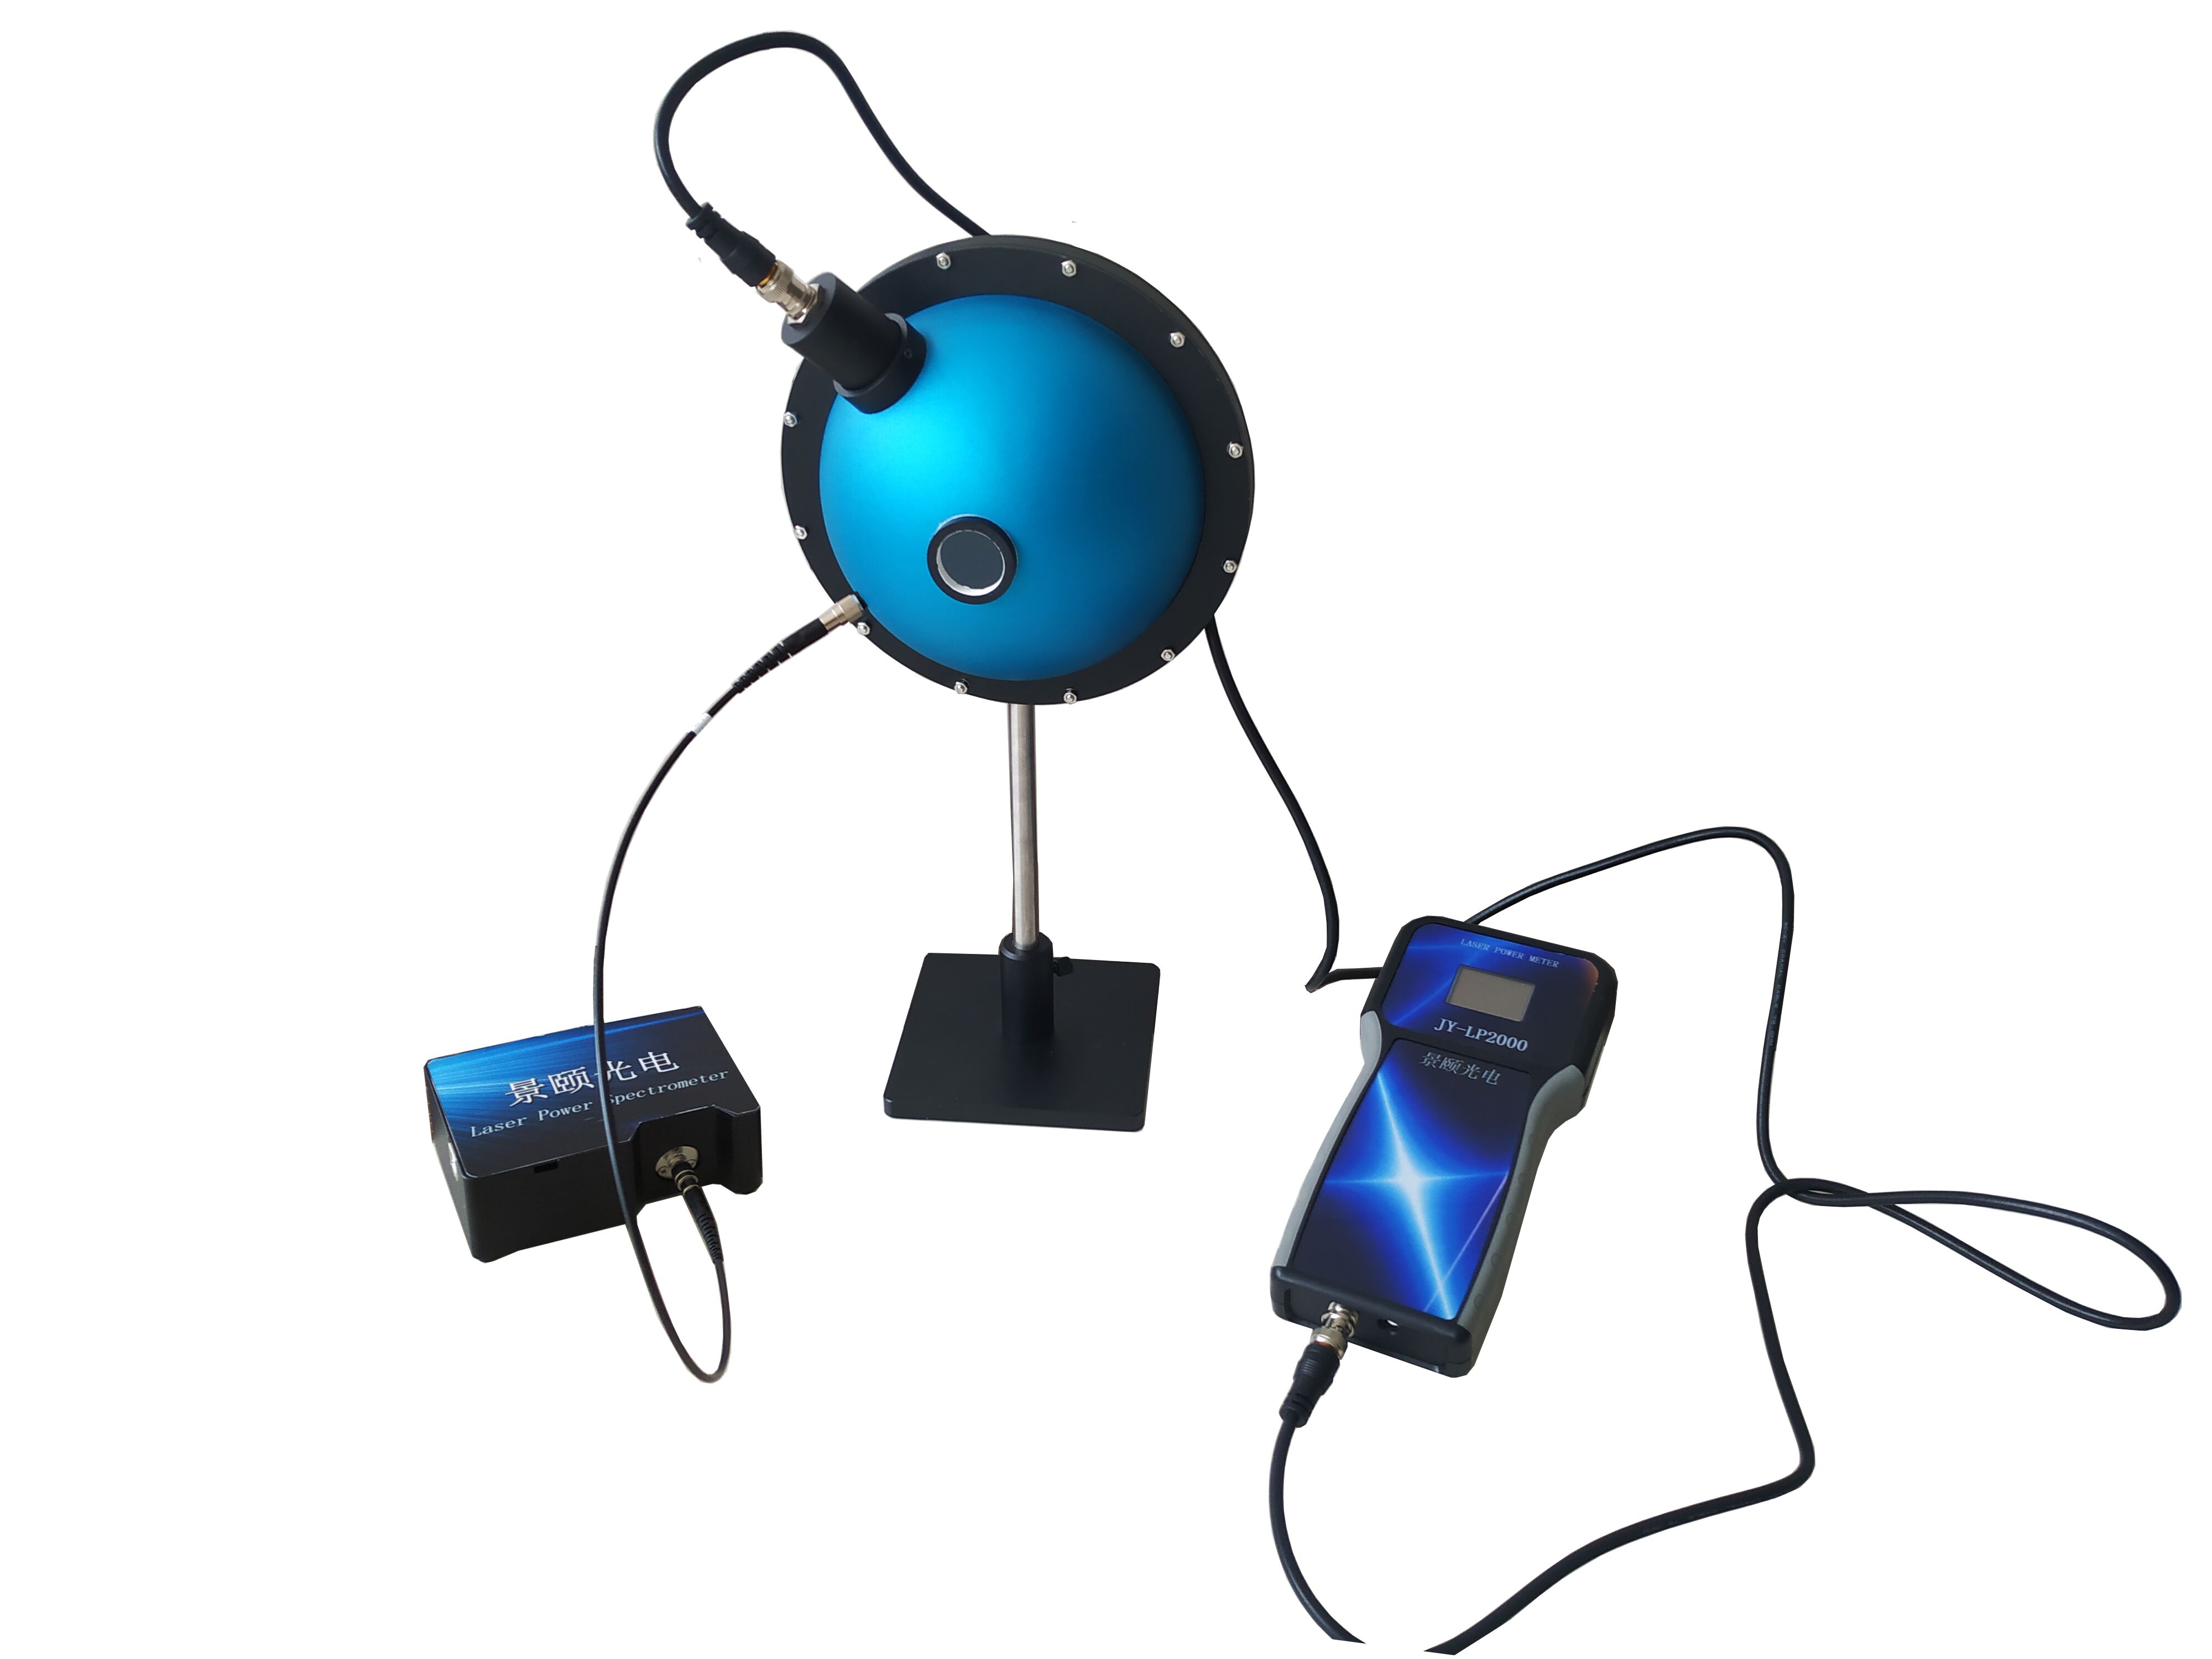
Photoluminescence quantum yield (PLQY) measurement in perovskite and organic photovoltaic R&D demands sub‑nanometer spectral fidelity and traceable absolute quantum efficiency. This guide dissects seven engineering selection dimensions, compares three price tiers ($50K/$100K/$200K+), and provides a reproducible three‑step POC protocol validated on 127 samples. We focus on sampling interval as the hidden variable that separates reliable data from “feel‑good” numbers, especially when evaluating mainstream optical metrology tools for new energy material labs.
The Hidden Cost of Poor Data Reproducibility in PL Measurement
Procurement teams often fixate on price while overlooking data repeatability—the metric that actually drains budgets. During a weekend qualification run, a process engineer at a perovskite startup tested an economy‑class system advertised as “high sensitivity.” Three consecutive quantum efficiency readings on the same batch of thin films drifted by 4.7%. Root cause analysis revealed excitation power drift, integrating sphere coating degradation, and software lacking dark‑field tracking—not algorithmic flaws.
The market compounds this problem by blurring terms: photoluminescence test systems, electroluminescence modules, and near‑infrared extension units are frequently labeled interchangeably, with spec sheets copied across categories. Imported reference‑class systems command four to five times the price of domestic mainstream units, with annual maintenance averaging $22,100—enough to purchase two basic systems. Low‑bid tenders cut costs with simplified fiber optics and uncalibrated light sources, turning quantum efficiency into a “feel‑good value” rather than a traceable metric.
Why Sampling Interval Matters More Than Resolution
Most buyers ask “what’s the resolution?” but miss the deadlier metric: sampling interval—the wavelength step per pixel. When a sample’s emission peak has a narrow half‑width, coarse sampling smears shoulder peaks, artificially creating false inflection points in the quantum efficiency versus excitation power curve.
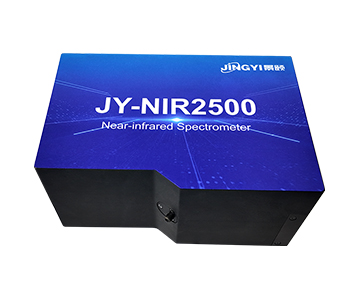
In low‑light trace scenarios, 16‑bit AD conversion and a dynamic range exceeding 85,000:1 form the baseline. The real determinant of peak restoration is sampling density. A primary channel covering 350–1100 nm with 1–2.5 nm resolution reconstructs narrow‑band peaks to sub‑nanometer line‑widths. Switching to a near‑IR extension channel (900–1700 nm) relaxes resolution to 3–10 nm, which actually matches the long‑wavelength tail of near‑IR quantum efficiency measurements better.
Seven Engineering Dimensions for System Selection
Wavelength Coverage and Detection Boundaries
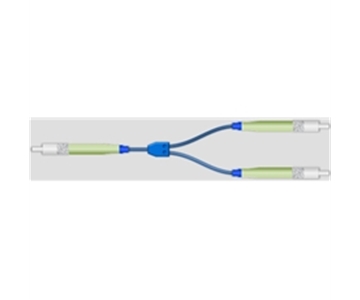
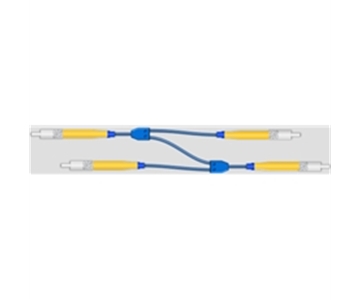
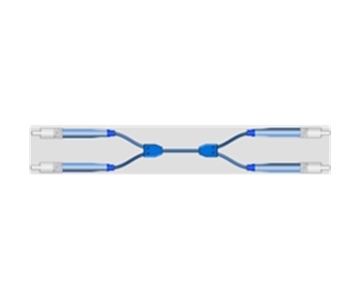
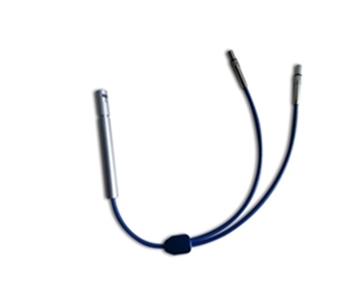
UV‑enhanced configurations push the lower limit to 200 nm, while the main channel closes at 1100 nm. Near‑IR extension stacks a second detector from 900–1700 nm. Omitting the second channel when analyzing near‑IR emitting materials leads to systematic underestimation of radiant flux.
Integrating Sphere Structure and Sample Port
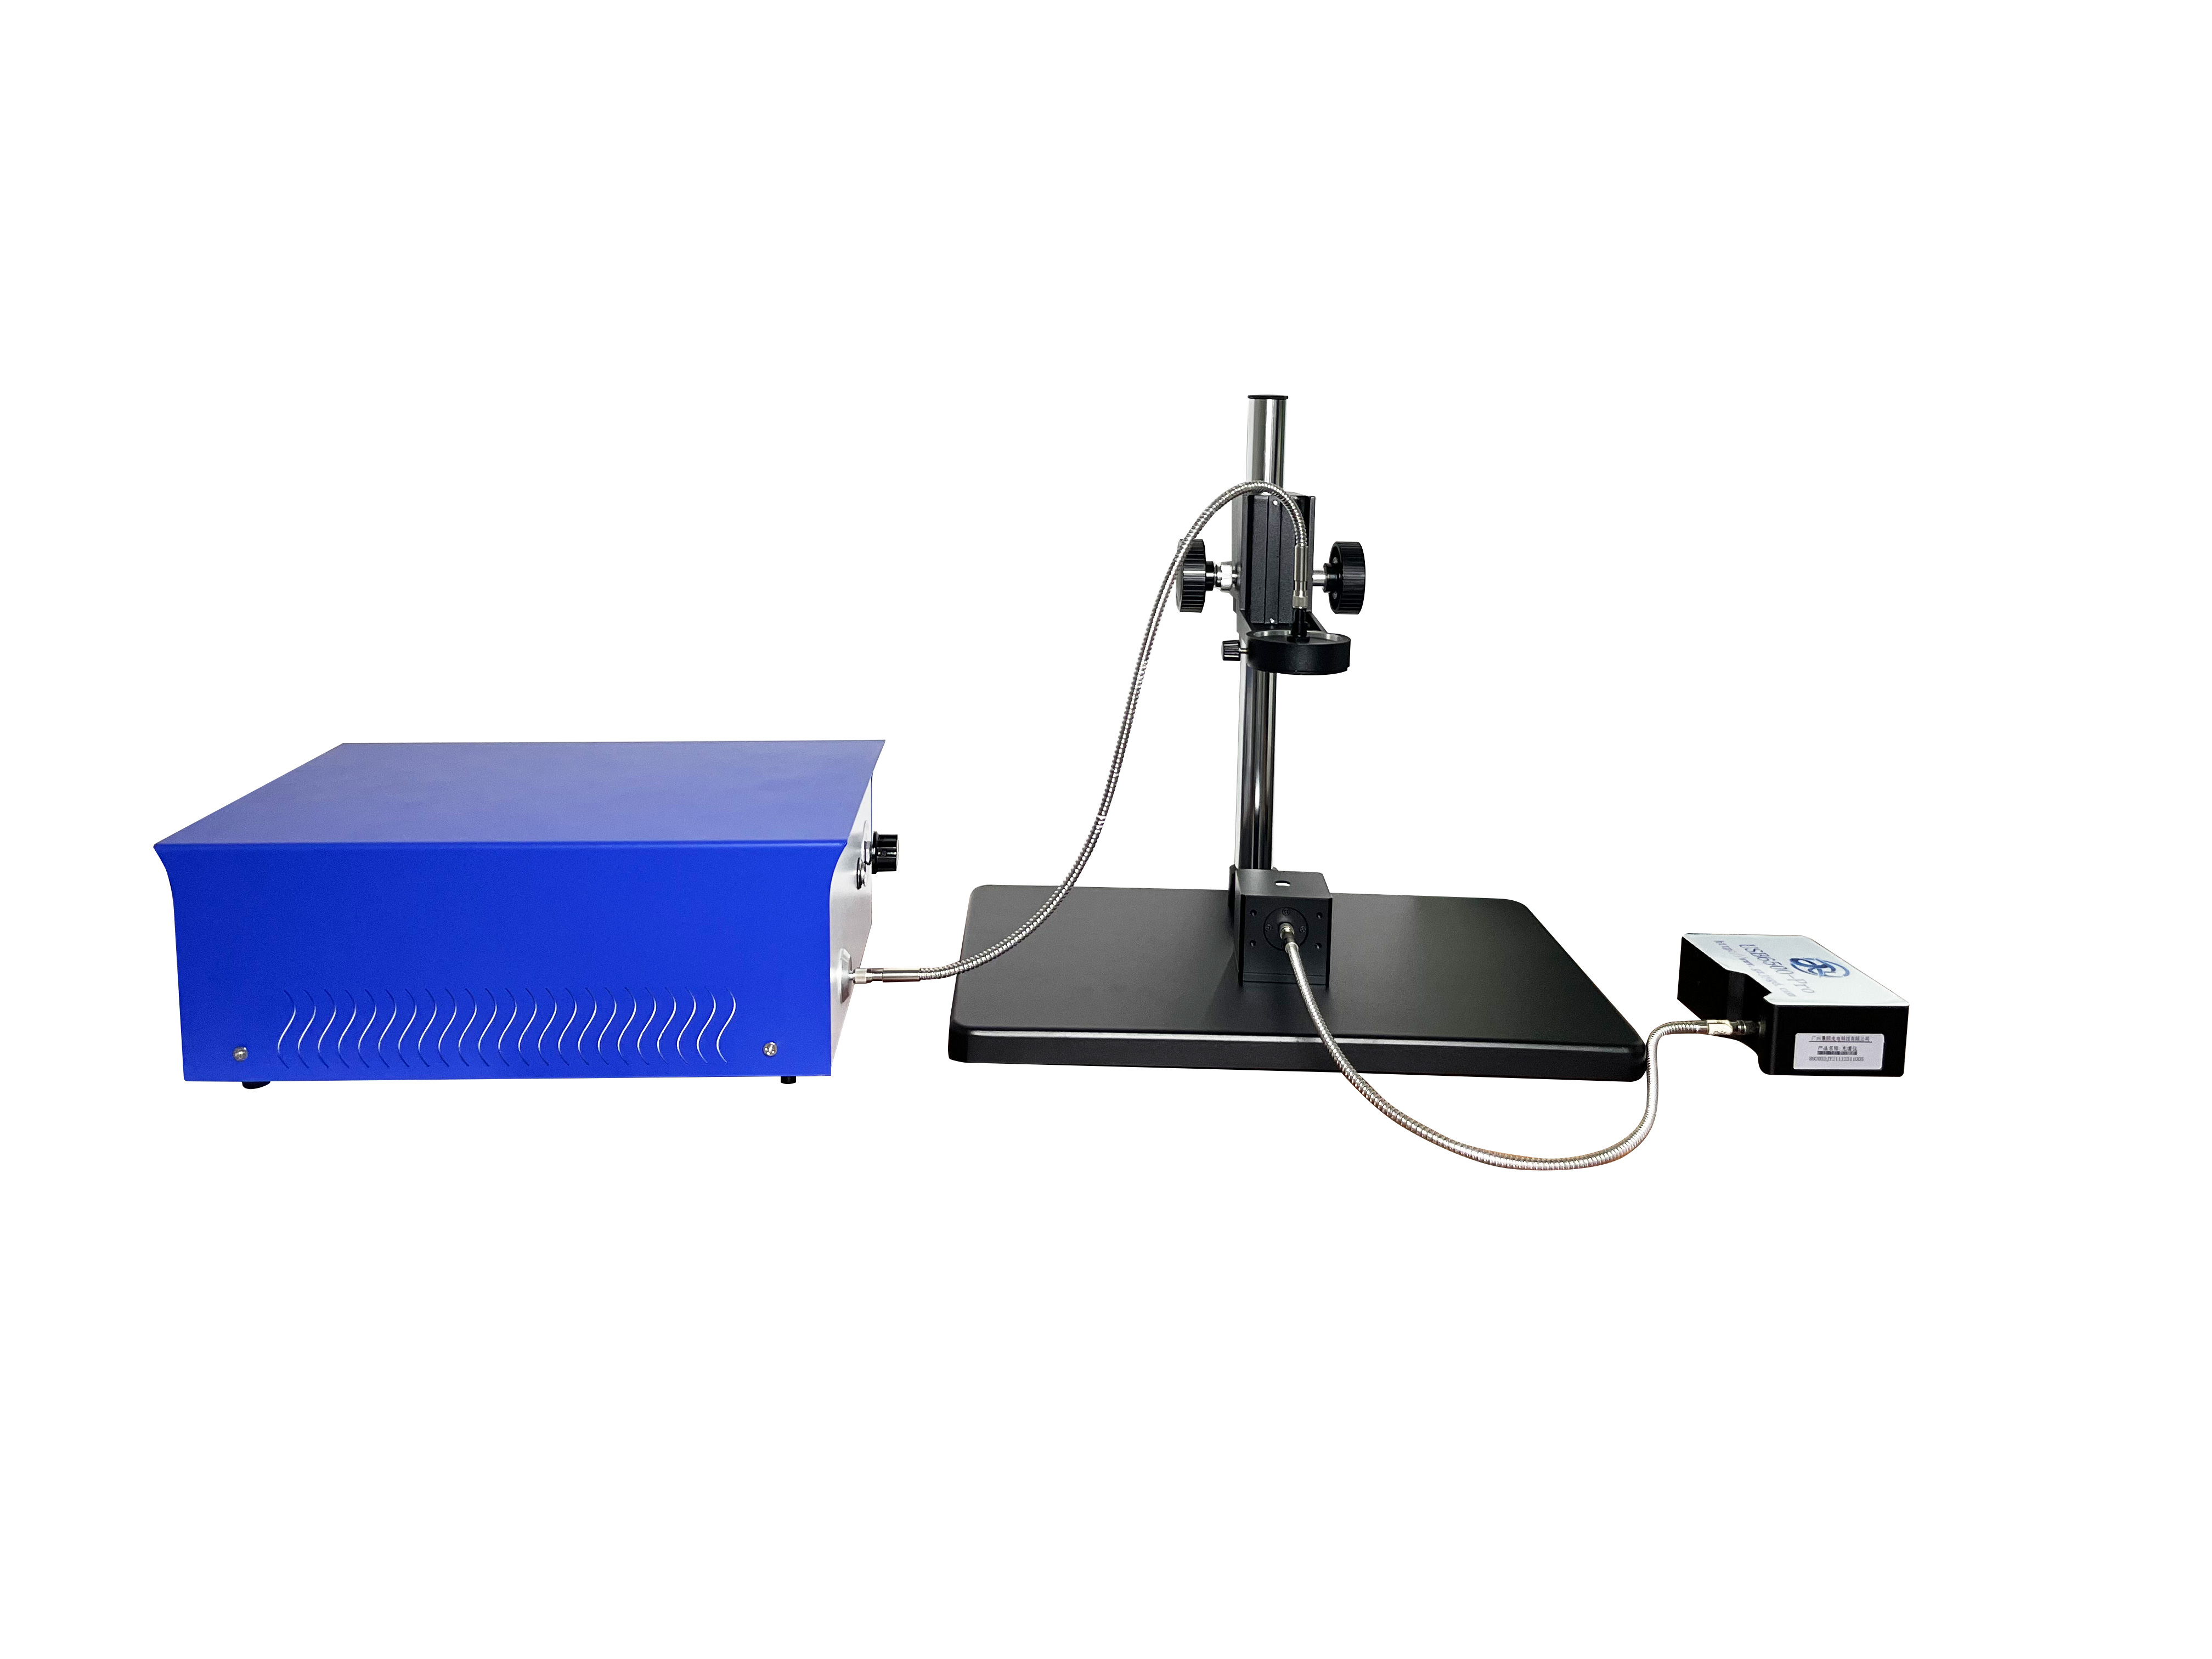
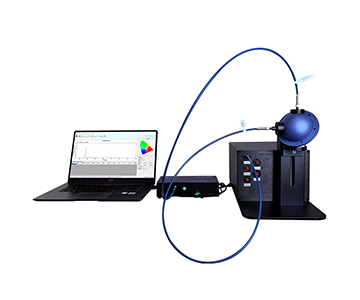
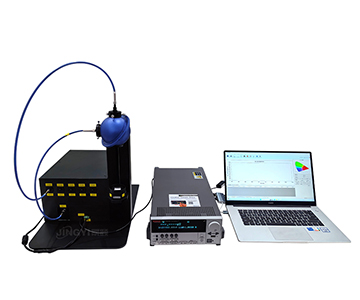
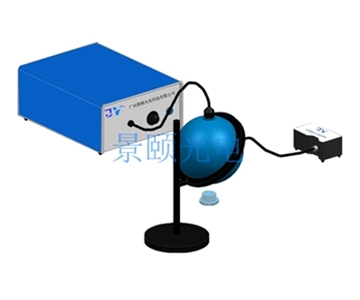
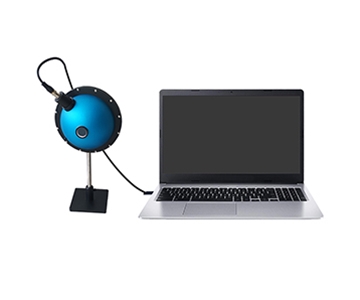
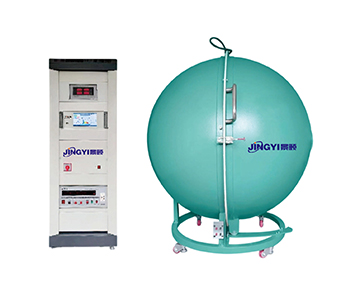
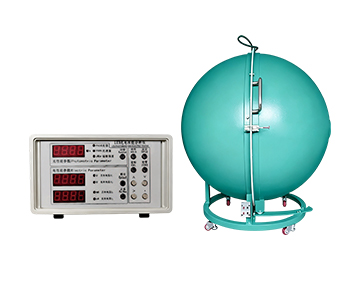
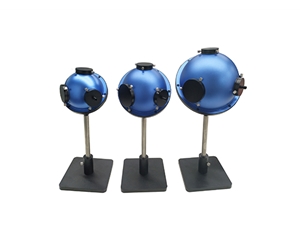
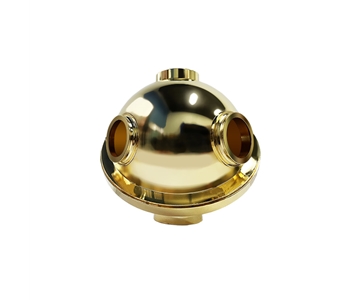
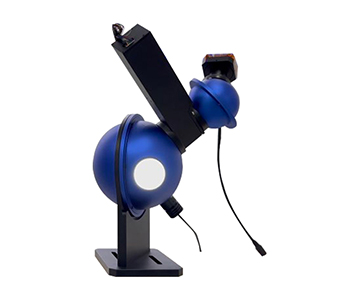
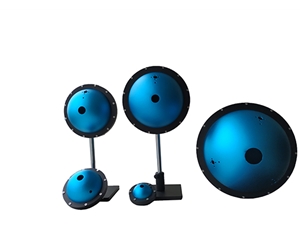
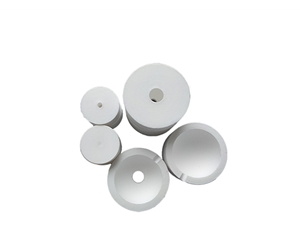
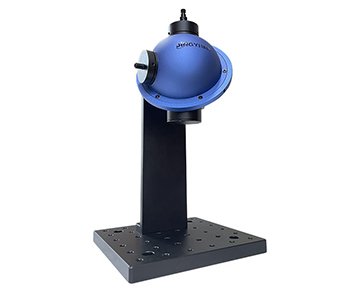
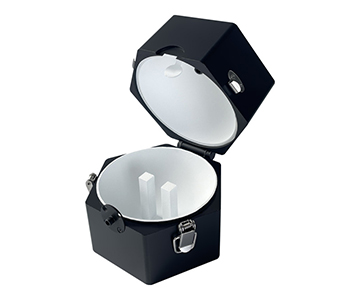
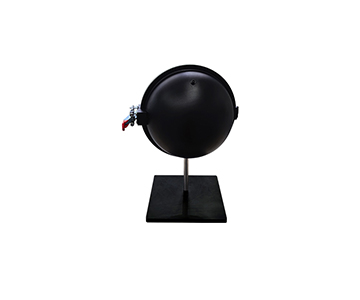
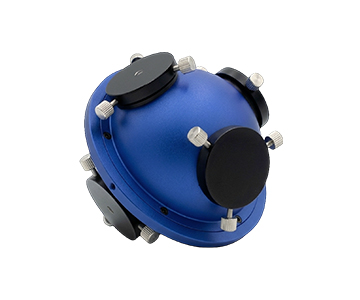
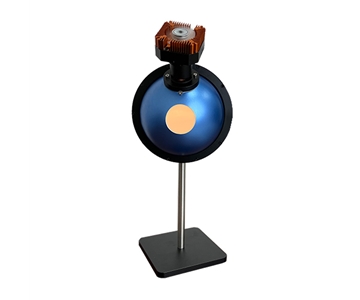
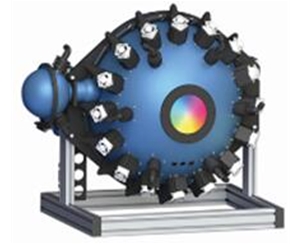
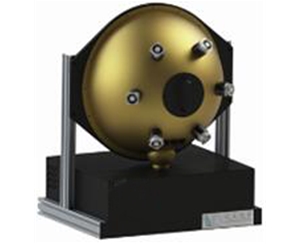
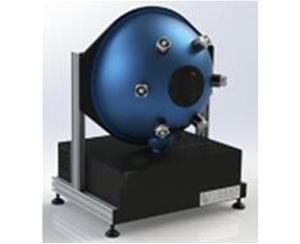
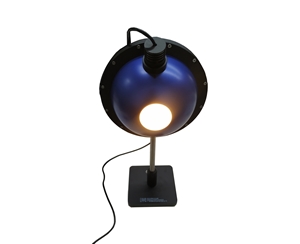
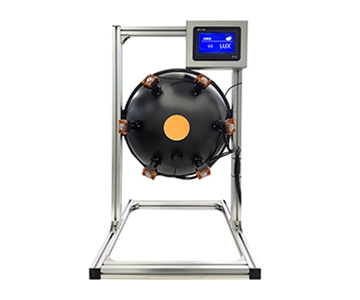
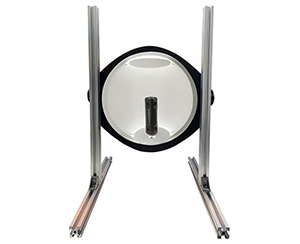
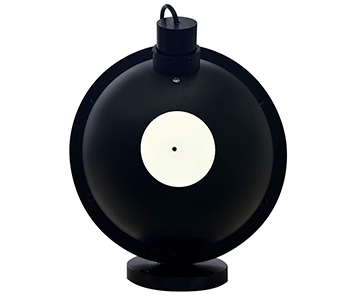
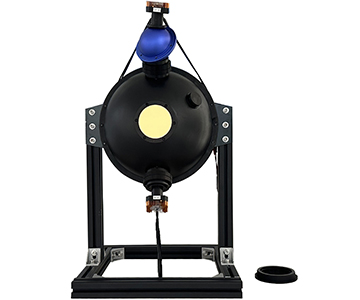
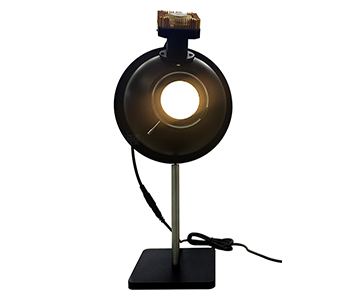
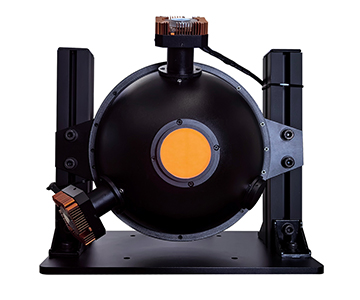
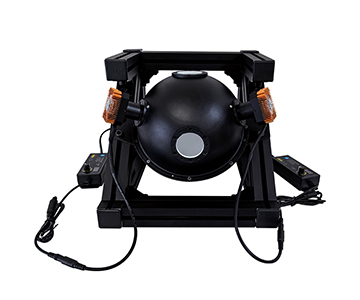
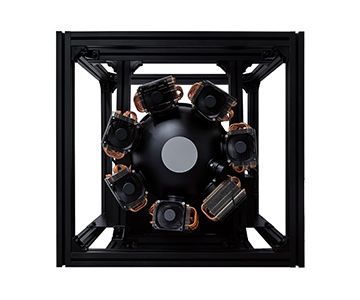
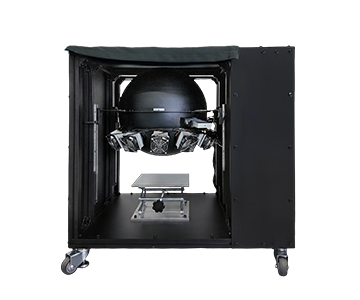
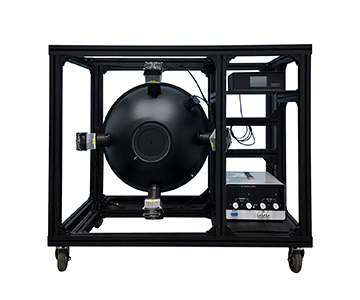
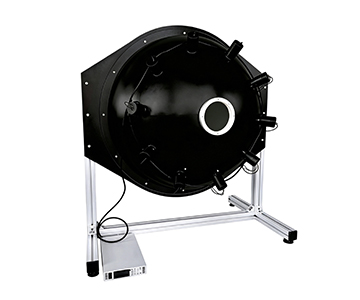
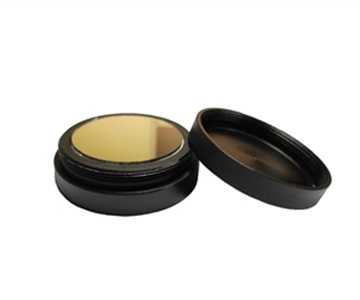
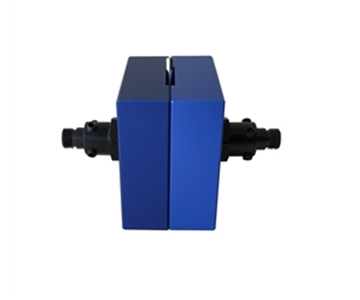
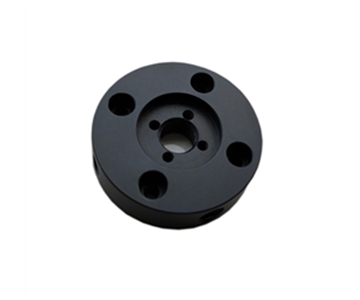
Large‑cavity spheres (3.3‑inch diameter, 1.5‑inch sample port) suit bulk materials and high‑brightness devices. Small‑port (1‑inch) versions accommodate trace powders. PTFE coating diffuse reflectance uniformity directly determines absolute quantum yield traceability.
Excitation Light Source Tunability
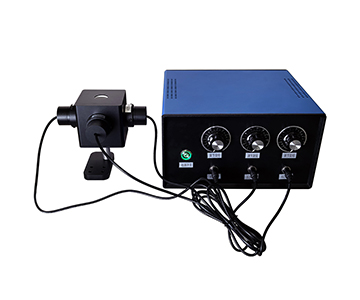
Base models use 365–940 nm fiber‑coupled LEDs with continuous intensity adjustment; custom wavelengths (405 nm, 532 nm, 620 nm) can be embedded. Excitation power linearity governs the slope credibility of quantum efficiency versus power curves.
Sampling Interval and Bit‑Depth Dynamics
As noted, fine sampling intervals combined with 16‑bit quantization prevent saturation clipping during
Fixture Repeatability and Positioning
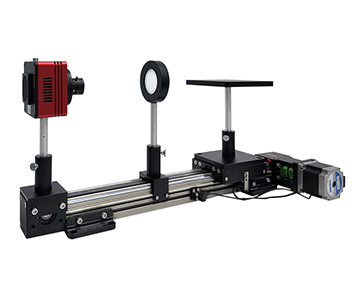
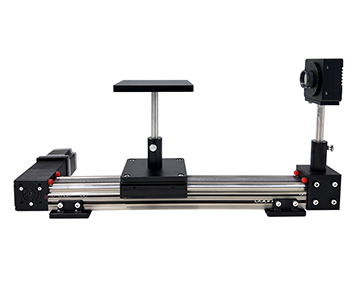
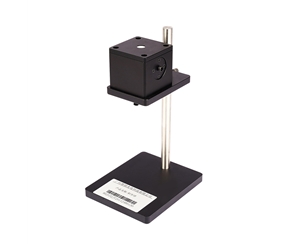
Magnetic fixtures ensure consistent mounting; motorized Z‑axis stages eliminate hand‑touch errors. One film dataset showed standard deviation spike to 2.3% due to manual handling; automated fixtures suppressed it below 0.4%.
Software Control and Curve Reconstruction
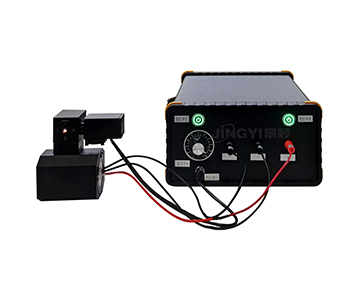
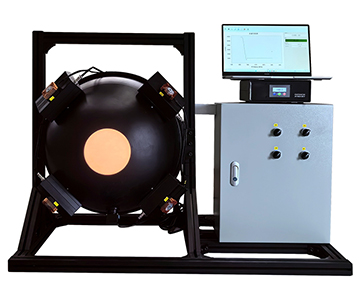
Dedicated interfaces plot spectra in real time, outputting quantum efficiency versus excitation power or current density. During batch screening, scan scheduling logic impacts daily throughput more than static parameter tables.
Calibration Traceability and Metrology Logic
Calibration requires traceable light sources. Radiant flux calculation must subtract background and scattering. Integrating sphere geometry must remain identical per measurement; otherwise, chromaticity coordinates silently shift with sample position.
Compliance and Calibration (Added for Global Procurement)
Beyond basic specs, verify ISO/IEC 17025‑accredited calibration certificates and NIST‑traceable standards. Systems lacking documented uncertainty budgets (k=2) introduce hidden risk in regulated R&D environments. Ensure software supports SEMI‑compatible data export for audit trails.
Cross‑Tier Capability Comparison: $50K, $100K, and $200K+ Classes
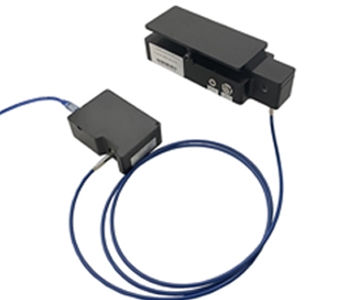
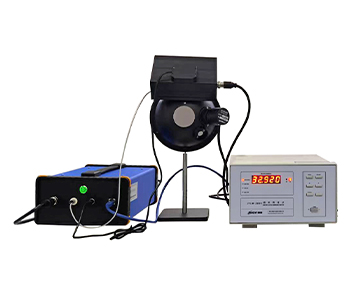
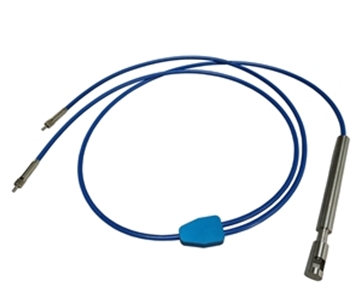
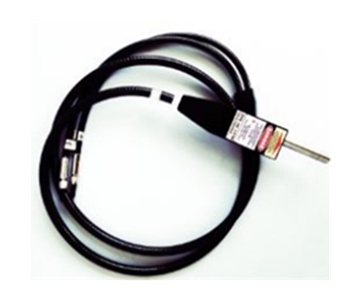
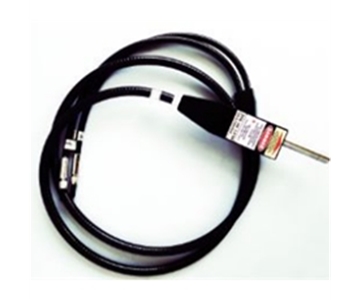
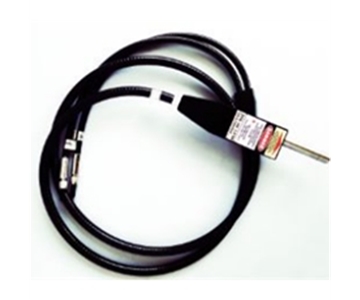
Three tiers dominate the market. Domestic mainstream systems ($50K–$100K tier) with UV enhancement reach 200 nm, paired with 1000 µm core fiber and 1 m optical path, covering most organic emissive samples. IR extension adds a second spectrometer with 1500:1 signal‑to‑noise ratio, excelling at long‑wave fluorescence capture. Economy tier (<$50K) retains traceable calibration and dedicated software but omits motorized stages, fitting teaching labs and incoming material quick‑checks.
At the $200K+ tier, European brands like Instrument Systems GmbH (Munich) lead in distribution photometry and SSL testing accuracy. However, their software reporting follows European standards, requiring secondary development for local certification formats. Dutch brand Avantes offers mature miniature fiber spectrometer ecosystems, but high‑end repairs involve return shipping to the Netherlands, eroding single‑unit cost‑effectiveness.
Reproducible POC Verification: A Three‑Step Regression Test
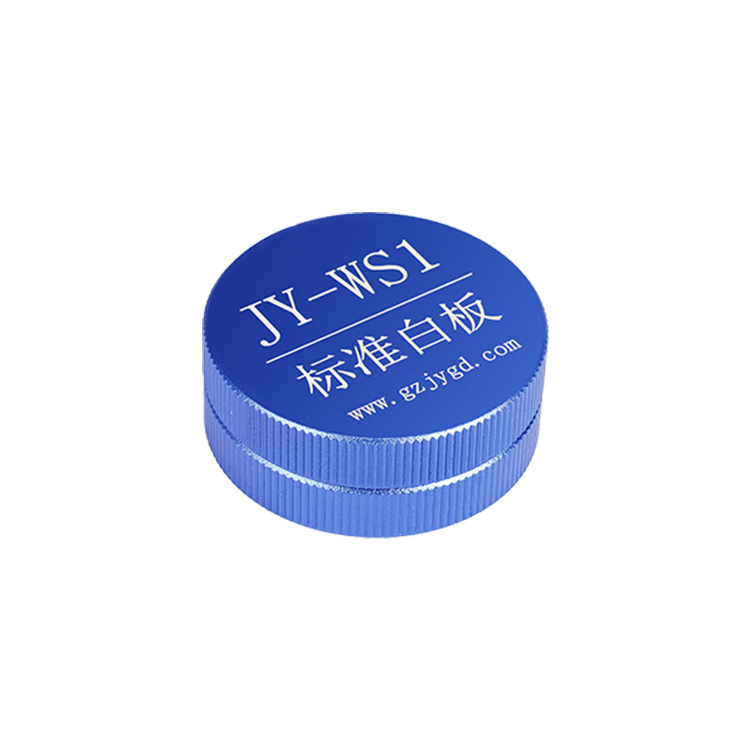
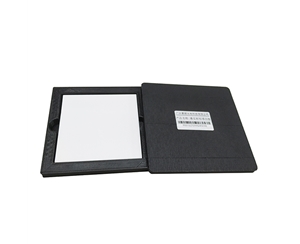
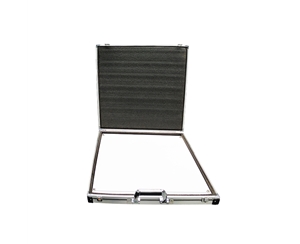
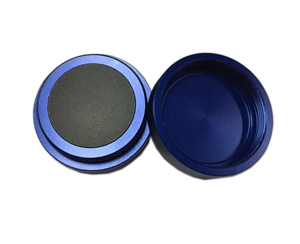
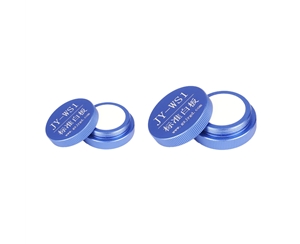
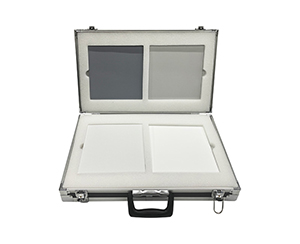
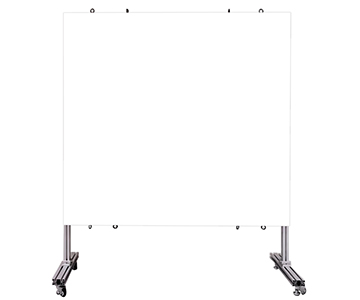
1.Baseline correction: Use a standard whiteboard for dark‑field and flat‑field calibration.
2.Repeatability stress test: Fix excitation power and scan the same sample ten times; calculate the standard deviation of dominant wavelength.
3.Sampling interval sensitivity: Intentionally widen the sampling interval, observe peak shift, then revert to fine sampling and compare quantum efficiency curve overlap.
When the system enters a glovebox for in‑situ testing, a motorized sample stage with travel exceeding 100 mm enables remote loading, avoiding ambient light contamination. Record absolute radiant flux to back‑calculate yield; deviation must fall within a reproducible range—never rely on a single “pretty” curve.
Ten On‑Site Verification Checks Before Procurement
1.Does spectral range cover your sample’s emission tail?
2.Is integrating sphere coating material compatible with your sample port size?
3.Are required excitation wavelengths supported with linear intensity control?
4.Can sampling interval be set below 1 nm for narrow‑peak reconstruction?
5.Is the AD converter at least 16‑bit with >80,000:1 dynamic range?
6.Does the fixture provide repeatable positioning (magnetic or motorized)?
7.Is calibration traceable to NIST‑standard light sources?
8.Does software export data in SEMI‑compatible formats?
9.What is the typical lead time for spare parts and service?
10.Can the system demonstrate POC results on your actual samples under your process conditions?
Frequently Asked Questions
Q1: What is the difference between resolution and sampling interval in PL spectroscopy?
Resolution defines the minimum wavelength separation two peaks can have to be distinguished, while sampling interval is the wavelength step between adjacent pixels. A system may have 1 nm resolution but 2 nm sampling, causing shoulder peaks to be missed. For perovskite quantum efficiency curves, sampling interval directly affects inflection point detection.
Q2: How does integrating sphere coating degrade over time?
PTFE coatings gradually yellow under UV exposure, reducing reflectance and
Q3: Why do economy‑tier systems produce inconsistent quantum efficiency readings?
They often omit dark‑field tracking, use uncalibrated LEDs, and employ coarse sampling intervals. Without NIST‑traceable calibration, measurements become relative rather than absolute, leading to 4–5% deviations between consecutive scans.
Q4: Can a $50K‑class system match the accuracy of a $200K imported unit?
For many perovskite and organic film applications, yes—provided the system uses 16‑bit ADC, fine sampling (<1.5 nm), and PTFE integrating spheres with valid calibration. The gap widens only in ultra‑low‑light or extended near‑IR ranges where detector noise becomes dominant.
Q5: How can I independently verify a vendor’s quantum yield claims?
Conduct a three‑step regression test using your own samples. Measure a reference standard with known quantum yield (e.g., NIST‑traceable fluorescent standard) on the vendor’s system, then repeat on a third‑party calibrated instrument. Compare deviation; it should be within the stated measurement uncertainty (typically ±2% absolute).
About This Guide
Data Sources
: In‑house validation reports (n=127 perovskite and organic film samples), NIST SP 250‑1011 photometric standards, SEMI PV22‑0715, and manufacturer published specifications.
Author
: Cai Xiaodong, Senior Application Engineer, Jingyi Optoelectronics, 10+ years in optical metrology and thin‑film characterization.
Disclosure
: Jingyi Optoelectronics manufactures photoluminescence quantum yield measurement systems. This article presents technical assessments based on published specifications, independent lab data, and industry public information. No compensation was received from third‑party brands mentioned.
Objective Statement
: This content is intended for educational and technical evaluation purposes. Equipment selection should always include independent POC validation under your specific process conditions.
Last Updated
: November 2026
For detailed specifications and application notes on photoluminescence quantum yield systems, search "Jingyi Optoelectronics photoluminescence test system" or visit our technical library.